. 2016 Feb 16;7(7):7925-39.
doi: 10.18632/oncotarget.6879.

Dlx-2 and glutaminase upregulate epithelial-mesenchymal transition and glycolytic switch

Affiliations

Dlx-2 and glutaminase upregulate epithelial-mesenchymal transition and glycolytic switch

Su Yeon Lee et al. Oncotarget. .

Abstract

Most cancer cells depend on enhanced glucose and glutamine (Gln) metabolism for growth and survival. Oncogenic metabolism provides biosynthetic precursors for nucleotides, lipids, and amino acids; however, its specific roles in tumor progression are largely unknown. We previously showed that distal-less homeobox-2 (Dlx-2), a homeodomain transcription factor involved in embryonic and tumor development, induces glycolytic switch and epithelial-mesenchymal transition (EMT) by inducing Snail expression. Here we show that Dlx-2 also induces the expression of the crucial Gln metabolism enzyme glutaminase (GLS1), which converts Gln to glutamate. TGF-β and Wnt induced GLS1 expression in a Dlx-2-dependent manner. GLS1 shRNA (shGLS1) suppressed in vivo tumor metastasis and growth. Inhibition of Gln metabolism by shGLS1, Gln deprivation, and Gln metabolism inhibitors (DON, 968 and BPTES) prevented Dlx-2-, TGF-β-, Wnt-, and Snail-induced EMT and glycolytic switch. Finally, shDlx-2 and Gln metabolism inhibition decreased Snail mRNA levels through p53-dependent upregulation of Snail-targeting microRNAs. These results demonstrate that the Dlx-2/GLS1/Gln metabolism axis is an important regulator of TGF-β/Wnt-induced, Snail-dependent EMT, metastasis, and glycolytic switch.

Keywords: Dlx-2; GLS1; Snail; epithelial-mesenchymal transition; glycolytic switch.


Conflict of interest statement

CONFLICTS OF INTEREST

The authors declare no conflicts of interest.

Figures

Figure 1
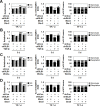
Figure 1. TGF-β and Wnt3a induces GLS1 expression by Dlx-2 activation
A-C. MCF-7 cells were transfected with Dlx-2. Changes in cellular gene transcription were detected by microarray analysis (A). Fold increases in expression as compared with Mock are shown. The cells were also analyzed by real-time qrtPCR (B) and immunoblotting (C) using the indicated primers and antibodies. **p < 0.01 versus Mock. D. MCF-7 cells co-transfected with Dlx-2 and shSnail were analyzed by real-time qrtPCR for GLS1 expression. **p < 0.01 versus Mock. E. A schematic diagram of the human GLS1 promoter regions is shown in left panel, and the 4 predicted Dlx-2 binding sites are indicated by black boxes and numbered D1, D2, D3 and D4. The ChIP-enriched DNA was amplified using primers #1, #2 or #3, which encompass the D1/D2, D3, or D4 binding sites in the GLS1 promoter, respectively. MCF-7 cells were transfected with Dlx-2 and analyzed using ChIP assays (right panel). F, G. MCF-7 cells transfected with shDlx-2 or shSnail and then treated with TGF-β were analyzed by real-time qrtPCR (F) and immunoblotting (G) for GLS1 expression. **p < 0.01 versus untreated, ##p < 0.01 versus shCon. H. MCF-7 cells were treated with TGF-β and analyzed using ChIP assays. I, J. MCF-7 cells were transfected with shRNA for Smad 2/3/4 and then treated with TGF-β. The cells were then analyzed by real-time qrtPCR (I) and immunoblotting (J) for GLS1 expression. **p < 0.01 versus untreated, ##p < 0.01 versus shCon. K, L. MCF-7 cells transfected with shDlx-2 or shSnail and then treated with Wnt3a CM were analyzed by real-time qrtPCR (K) and immunoblotting (L) for GLS1 expression. **p < 0.01 versus untreated, ##p < 0.01 versus shCon. M. MCF-7 cells were treated with Wnt3a CM and analyzed using ChIP assays. N, O. MCF-7 cells were transfected with shRNA for β-catenin, TCF4, and Axin1/2 and then treated with Wnt3a CM. The cells were then analyzed by real-time qrtPCR (N) and immunoblotting (O) for GLS1 expression. **p < 0.01 versus untreated, ##p < 0.01 versus shCon. All error bars represent SE. For all immunoblotting images, cropped blots are shown.
Figure 2
Figure 2. shGLS1 inhibits tumor growth and metastasis
A-D. HCT116 cells stably transfected with shCon or shGLS1 were injected subcutaneously into the dorsal flank of nude mice (n = 4-5). Tumor growth curves (A) and photographs of representative mice, tumors (B), tumor weight (C) and H&E staining (D) are shown. *p < 0.05; **p < 0.01 versus shCon. E-G. 1 × 10⁶ HCT116 cells stably transfected with shCon or shGLS1 were injected into the tail vein of nude mice (n = 3-5). Photographs of representative lungs (E) and H&E staining of lung sections are shown (F). The number of metastatic nodules (G). **p < 0.01 versus shCon. All error bars represent SE. All scale bars represent 100 μm.
Figure 3
Figure 3. Inhibition of Gln metabolism prevents EMT
A-C. MCF-7 cells were co-transfected with Dlx-2 and shGLS1. The cells were analyzed for cell morphology by phase-contrast microscopy (A). The cells were also analyzed by real-time qrtPCR (B) and immunoblotting (C) using the indicated primers and antibodies. **p < 0.01 versus Mock, ##p < 0.01 versus shCon. D-I. MCF-7 cells were transfected with shGLS1 and then treated with TGF-β (D-F) or Wnt3a CM (G-I). The cells were analyzed by phase-contrast microscopy for cell morphology (D, G), and by real-time qrtPCR (E, H) and immunoblotting (F, I) using the indicated primers and antibodies. **p < 0.01 versus untreated, #p < 0.05; ##p < 0.01 versus shCon. J-L. MCF-7 cells were co-transfected with Snail and 2 different shGLS1 constructs (#1 and #2). The cells were analyzed for cell morphology by phase-contrast microscopy (J). The cells were also analyzed by real-time qrtPCR (K) and immunoblotting (L) using the indicated primers and antibodies. **p < 0.01 versus Mock, #p < 0.05; ##p < 0.01 versus shCon. M, N. MCF-7 cells were transfected with shDlx-2 and then treated with TGF-β in the presence or absence of α-KG and analyzed for cell morphology by phase-contrast microscopy (M). The cells were also analyzed by real-time qrtPCR for E-cadherin, GLS1, and Snail expression (N). **p < 0.01 versus untreated, ##p < 0.01 versus shCon, §p < 0.05; §§p < 0.01 versus shDlx-2 in the absence of α-KG. All error bars represent SE. All scale bars represent 100 μm. For all immunoblotting images, cropped blots are shown.
Figure 4
Figure 4. shDlx-2 or Gln metabolism inhibition increase the expression of p53
A, B. MCF-7 cells transfected with shDlx-2 or shGLS1 and then treated with α-KG were analyzed by real-time qrtPCR (A) and immunoblotting (B) for p53 expression. **p < 0.01 versus shCon, ##p < 0.01 versus untreated. C, D. MCF-7 cells treated with DON or cultured in Gln-free medium were analyzed by real-time qrtPCR (C) and immunoblotting (D) for p53 expression. **p < 0.01 versus control. E, F. MCF-7 cells transfected with shDlx-2 or shSnail and then treated with TGF-β were analyzed by real-time qrtPCR (E) and immunoblotting (F) for p53 expression. **p < 0.01 versus shCon, ##p < 0.01 versus untreated. G. MCF-7 cells co-transfected with shDlx-2 or shGLS1 and shp53 and then treated with TGF-β were analyzed by phase-contrast microscopy for cell morphology (left) and circularity (right). The borders (white) drawn along the cell edges are shown for quantification of circularity. The results (54-158 cells in each group) are presented as mean ± SE. **p < 0.01 versus untreated, ##p < 0.01 versus shCon with TGF-β, §§p < 0.01 versus shDlx-2 or shGLS1 with TGF-β. H. MCF-7 cells transfected with shp53 and then cultured in complete or Gln-free medium with TGF-β were analyzed by phase-contrast microscopy for cell morphology (left) and circularity (right). The borders (white) drawn along the cell edges are shown for quantification of circularity. The results (26-134 cells in each group) are presented as mean ± SE. **p < 0.01 versus untreated, ##p < 0.01 versus complete medium with TGF-β, §§p < 0.01 versus shCon in Gln-free medium with TGF-β. All error bars represent SE. All scale bars represent 100 μm. For all immunoblotting images, cropped blots are shown.
Figure 5
Figure 5. Gln metabolism is linked to TGF-β-, Wnt3a-, and Dlx-2/Snail-induced glycolytic switch and mitochondrial repression
A. MCF-7 cells were co-transfected with Dlx-2 and shGLS1. The cells were analyzed for Glc consumption, Lac production, mitochondrial respiration, and ATP source. **p < 0.01 versus Mock, ##p < 0.01 versus shCon. B, C. MCF-7 cells were transfected with shGLS1 and then treated with TGF-β (B) or Wnt3a CM (C). The cells were analyzed for Glc consumption, Lac production, mitochondrial respiration, and ATP source. **p < 0.01 versus untreated, ##p < 0.01 versus shCon. D. MCF-7 cells were co-transfected with Snail and shGLS1. The cells were analyzed for Glc consumption, Lac production, mitochondrial respiration and ATP source. **p < 0.01 versus Mock, ##p < 0.01 versus shCon. The amount of ATP produced by aerobic respiration (black bars) and glycolysis (gray bars) was calculated by measuring oxygen consumption and Lac production in the cells (right panels in A-D). All error bars represent SE.
Figure 6
Figure 6. The expression of Dlx-2, GLS1, p53, Snail, and Snail-targeting miRNAs in human tumors
A-C. Real-time qrtPCR data showing expression of Dlx-2, GLS1, p53 and Snail mRNA, and immunoblotting for Dlx-2, Snail, and GLS1 protein in normal (N) and tumor (T) tissues from the indicated tumor types and histological stages (TNM classification) of breast (A), colon (B) and ovarian cancer (C). D. Ponceau S-stained membranes showing loading of same amount of proteins. E. Real-time qrtPCR data of Snail-targeting miRNAs in normal (N) and tumor (T) tissues in the indicated tumor types. Relative levels of miRNAs were normalized to the corresponding normal tissues. *p < 0.05; **p < 0.01 versus matched normal (N) tissues. All error bars represent SE. F. A schematic representation showing a new function of Dlx-2/GLS1-driven Gln metabolism that contributes to Snail-dependent EMT and glycolytic switch. For all immunoblotting images, cropped blots are shown.

Similar articles

Cited by

References

    1. Hsu PP, Sabatini DM. Cancer cell metabolism: Warburg and beyond. Cell. 2008;134:703–707. - PubMed
    1. Vander Heiden MG, Cantley LC, Thompson CB. Understanding the Warburg effect: the metabolic requirements of cell proliferation. Science. 2009;324:1029–1033. - PMC - PubMed
    1. Warburg O. On the origin of cancer cells. Science. 1956;123:309–314. - PubMed
    1. Cairns RA, Harris IS, Mak TW. Regulation of cancer cell metabolism. Nat Rev Cancer. 2011;11:85–95. - PubMed
    1. Dang CV. Links between metabolism and cancer. Genes Dev. 2012;26:877–890. - PMC - PubMed

Publication types

MeSH terms