Tissue transglutaminase-2 promotes gastric cancer progression via the ERK1/2 pathway
- PMID: 26771235
- PMCID: PMC4872769
- DOI: 10.18632/oncotarget.6883
Tissue transglutaminase-2 promotes gastric cancer progression via the ERK1/2 pathway
Abstract
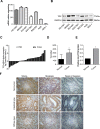
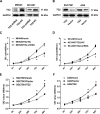
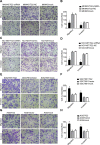
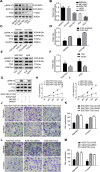
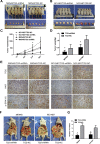
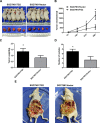
Gastric cancer (GC) is one of the most common tumors worldwide and involves extensive local tumor invasion, metastasis, and poor prognosis. Understanding mechanisms regulating progression of GC is necessary for developing effective therapeutic strategies. Tissue transglutaminase-2 (TG2), a multifunctional member of the transglutaminase family, has been shown to be critical for tumor initiation and progression. However, how TG2 promotes the progression of GC is unknown. We report that TG2 was highly expressed in GC tissues and positively associated with depth of tumor invasion and late TNM stage. With gain- and loss-of-function approaches, we observed that TG2 promoted GC cell proliferation, migration, invasion, as well as tumorigenesis and peritoneal metastasis in vivo. These events were associated with the ERK1/2 pathway activation and an ERK1/2 inhibitor (U0126) inhibited cell proliferation, migration, and invasion induced by overexpression of TG2. In summary, TG2 contributes to tumorigenesis and progression of GC by activating the ERK1/2 signaling pathway and is a potential therapeutic target of metastatic gastric cancer.
Keywords: ERK1/2; TG2; gastric cancer; tumor progression.
Conflict of interest statement
The authors made no disclosures.
Figures
Similar articles
-
miR-215 promotes malignant progression of gastric cancer by targeting RUNX1.Oncotarget. 2016 Jan 26;7(4):4817-28. doi: 10.18632/oncotarget.6736. Oncotarget. 2016. PMID: 26716895 Free PMC article.
-
MicroRNA-25 promotes gastric cancer proliferation, invasion, and migration by directly targeting F-box and WD-40 Domain Protein 7, FBXW7.Tumour Biol. 2015 Sep;36(10):7831-40. doi: 10.1007/s13277-015-3510-3. Epub 2015 May 6. Tumour Biol. 2015. PMID: 25944166
-
MicroRNA-1225-5p inhibits proliferation and metastasis of gastric carcinoma through repressing insulin receptor substrate-1 and activation of β-catenin signaling.Oncotarget. 2016 Jan 26;7(4):4647-63. doi: 10.18632/oncotarget.6615. Oncotarget. 2016. PMID: 26684358 Free PMC article.
-
Transglutaminase-2: evolution from pedestrian protein to a promising therapeutic target.Amino Acids. 2017 Mar;49(3):425-439. doi: 10.1007/s00726-016-2320-2. Epub 2016 Aug 25. Amino Acids. 2017. PMID: 27562794 Review.
-
Transglutaminase is a tumor cell and cancer stem cell survival factor.Mol Carcinog. 2015 Oct;54(10):947-58. doi: 10.1002/mc.22375. Epub 2015 Aug 10. Mol Carcinog. 2015. PMID: 26258961 Free PMC article. Review.
Cited by
-
An Autophagy-Related Gene Signature Associated With Clinical Prognosis and Immune Microenvironment in Gliomas.Front Oncol. 2020 Oct 19;10:571189. doi: 10.3389/fonc.2020.571189. eCollection 2020. Front Oncol. 2020. PMID: 33194668 Free PMC article.
-
Proteomic analysis of holocarboxylase synthetase deficient-MDA-MB-231 breast cancer cells revealed the biochemical changes associated with cell death, impaired growth signaling, and metabolism.Front Mol Biosci. 2024 Jan 11;10:1250423. doi: 10.3389/fmolb.2023.1250423. eCollection 2023. Front Mol Biosci. 2024. PMID: 38283944 Free PMC article.
-
Potential targets of TMEM176A in the growth of glioblastoma cells.Onco Targets Ther. 2018 Nov 2;11:7763-7775. doi: 10.2147/OTT.S179725. eCollection 2018. Onco Targets Ther. 2018. PMID: 30464524 Free PMC article.
-
Activated hepatic stellate cells promote epithelial-to-mesenchymal transition in hepatocellular carcinoma through transglutaminase 2-induced pseudohypoxia.Commun Biol. 2018 Oct 25;1:168. doi: 10.1038/s42003-018-0177-5. eCollection 2018. Commun Biol. 2018. PMID: 30393774 Free PMC article.
-
Role of Moonlighting Proteins in Disease: Analyzing the Contribution of Canonical and Moonlighting Functions in Disease Progression.Cells. 2023 Jan 5;12(2):235. doi: 10.3390/cells12020235. Cells. 2023. PMID: 36672169 Free PMC article.
References
-
- Ferlay J, Soerjomataram I, Ervik M, Dikshit R, Eser S, Mathers C, Rebelo M, Parkin D, Forman D, Bray F. GLOBOCAN 2012 v1.0, Cancer Incidence and Mortality Worldwide: IARC CancerBase No. 11 [Internet] Lyon, France: International Agency for Research on Cancer; 2013. Available from: http://globocan.iarc.fr, accessed on day/month/year.
-
- Hundahl SA, Phillips JL, Menck HR. The National Cancer Data Base Report on poor survival of U.S. gastric carcinoma patients treated with gastrectomy: Fifth Edition American Joint Committee on Cancer staging, proximal disease, and the “different disease” hypothesis. Cancer. 2000;88:921–932. - PubMed
-
- Lorand L, Conrad SM. Transglutaminases. Molecular and cellular biochemistry. 1984;58:9–35. - PubMed
-
- Facchiano A, Facchiano F. Transglutaminases and their substrates in biology and human diseases: 50 years of growing. Amino acids. 2009;36:599–614. - PubMed
-
- Mehta K, Kumar A, Kim HI. Transglutaminase 2: a multi-tasking protein in the complex circuitry of inflammation and cancer. Biochemical pharmacology. 2010;80:1921–1929. - PubMed
Publication types
MeSH terms
Substances
LinkOut - more resources
Full Text Sources
Other Literature Sources
Medical
Miscellaneous

