. 2016 Jan 12;6(1):121-36.
doi: 10.1016/j.stemcr.2015.12.006.

Identification of Distinct Breast Cancer Stem Cell Populations Based on Single-Cell Analyses of Functionally Enriched Stem and Progenitor Pools

Affiliations

Identification of Distinct Breast Cancer Stem Cell Populations Based on Single-Cell Analyses of Functionally Enriched Stem and Progenitor Pools

Nina Akrap et al. Stem Cell Reports. .

Abstract

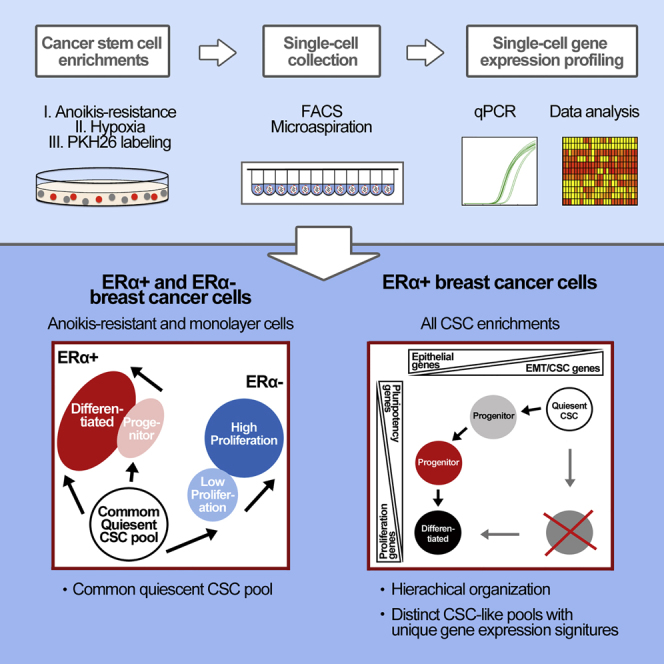
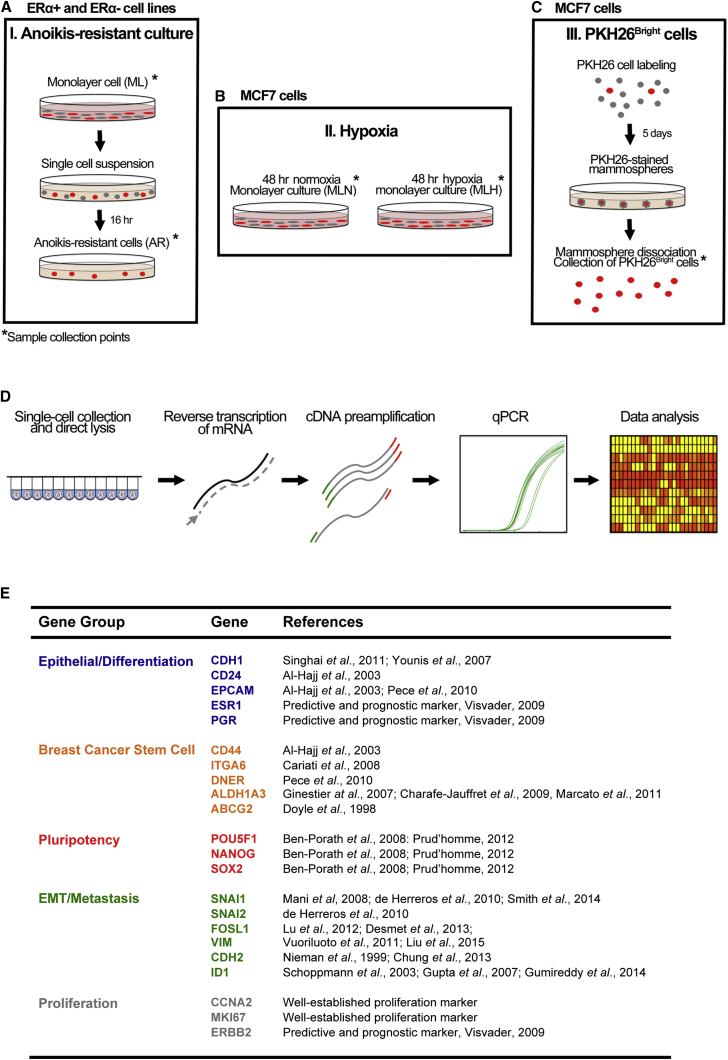
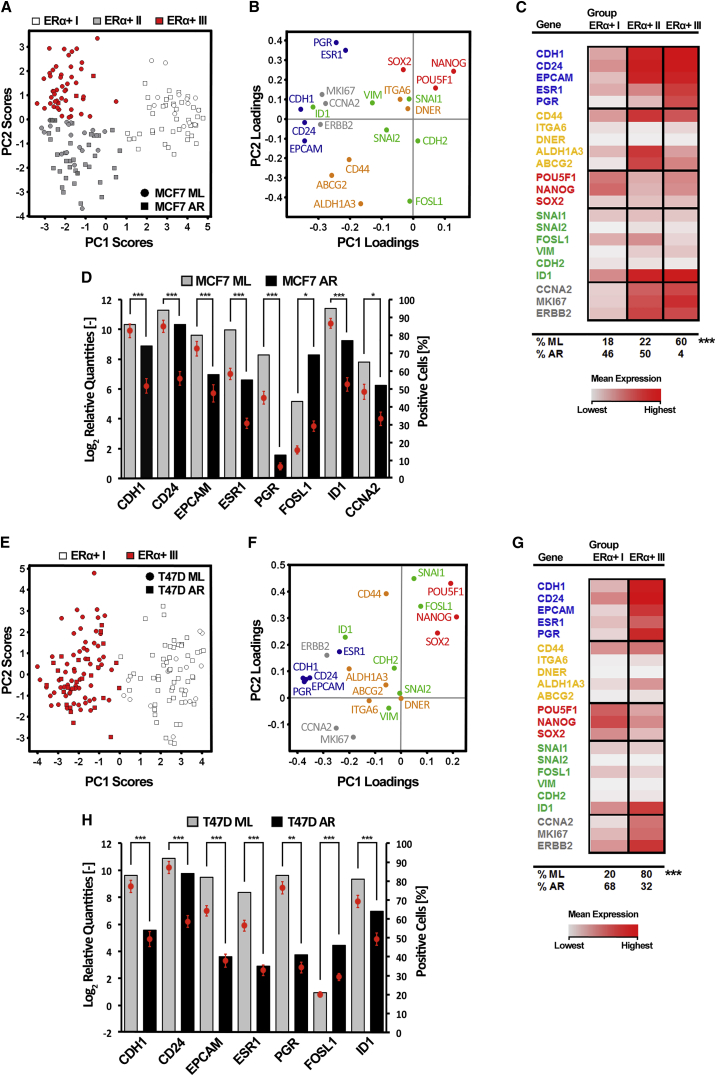
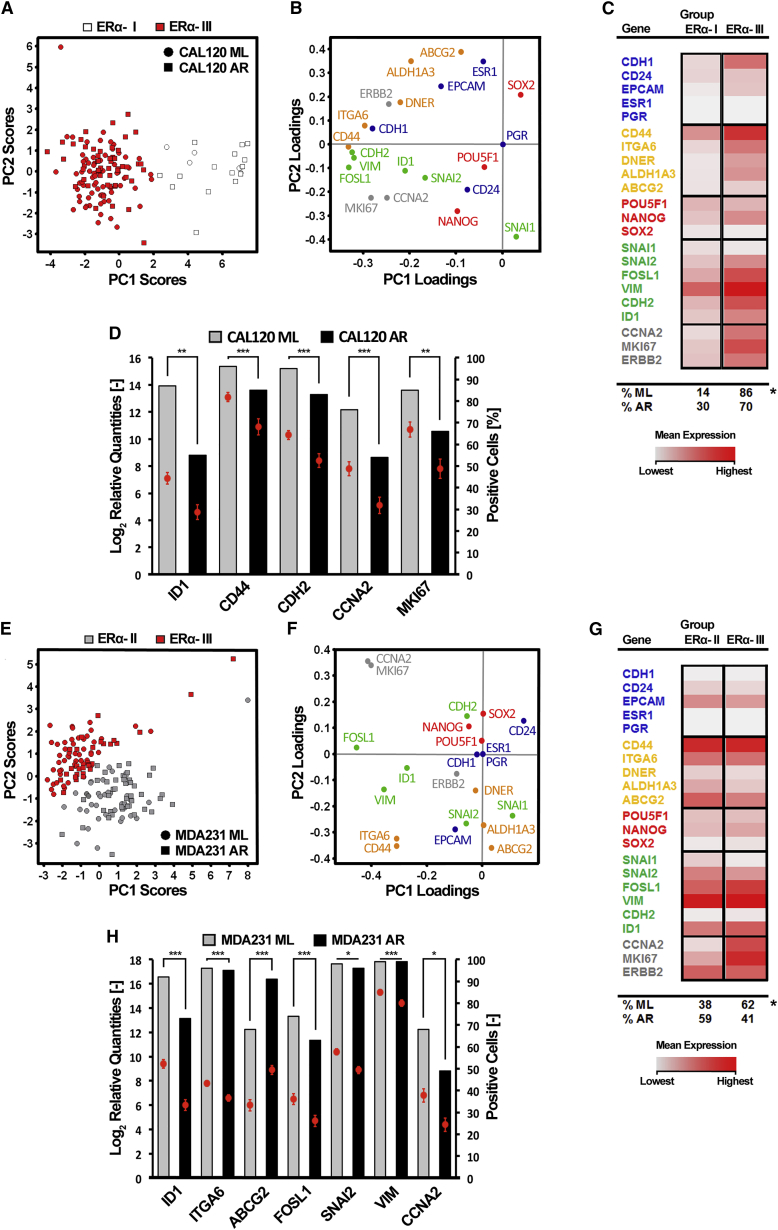
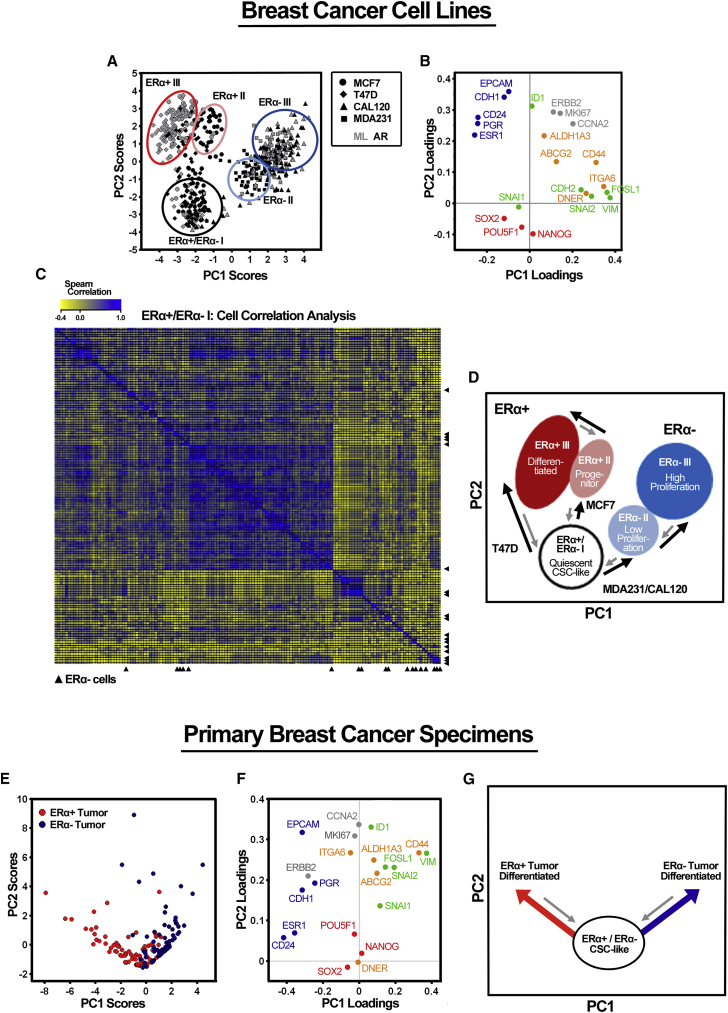
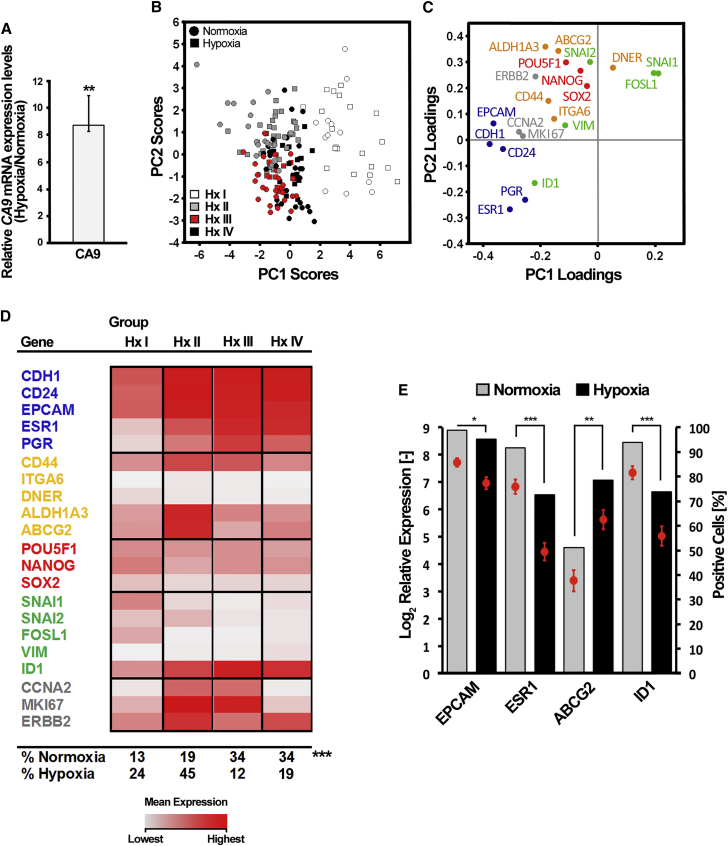
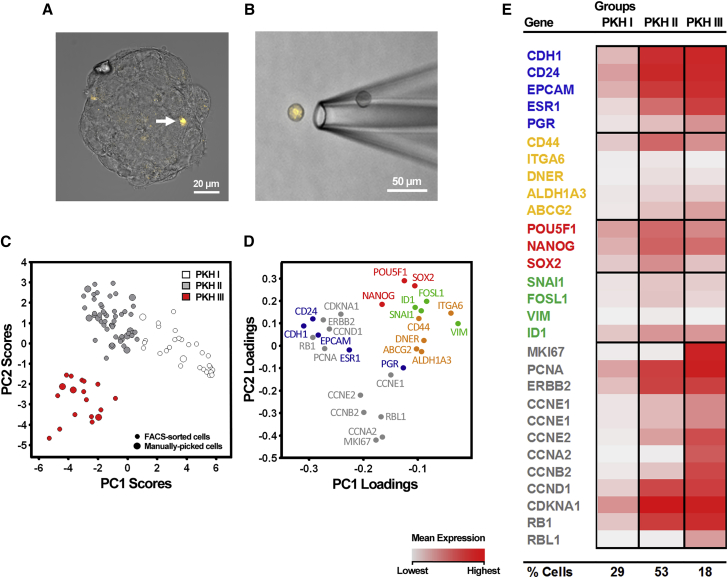
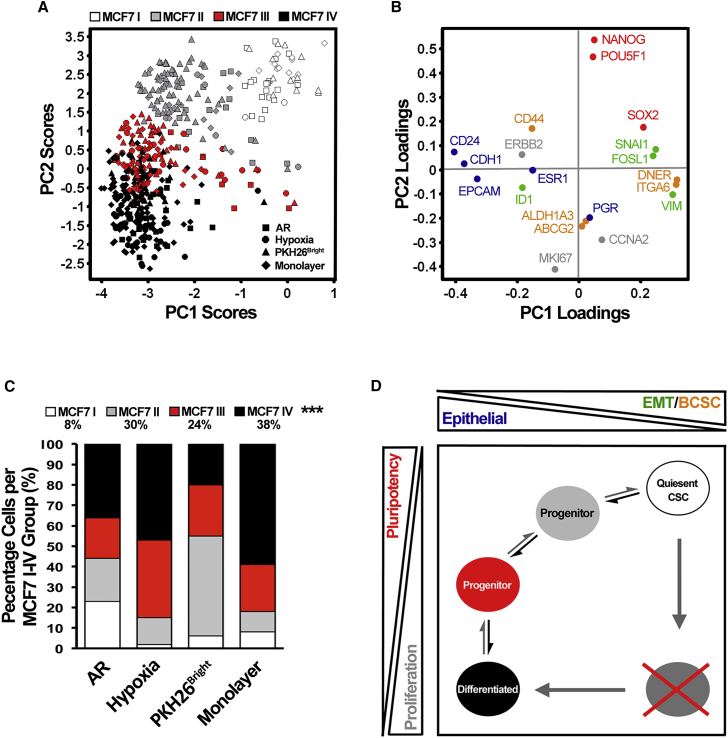
The identification of breast cancer cell subpopulations featuring truly malignant stem cell qualities is a challenge due to the complexity of the disease and lack of general markers. By combining extensive single-cell gene expression profiling with three functional strategies for cancer stem cell enrichment including anchorage-independent culture, hypoxia, and analyses of low-proliferative, label-retaining cells derived from mammospheres, we identified distinct stem cell clusters in breast cancer. Estrogen receptor (ER)α+ tumors featured a clear hierarchical organization with switch-like and gradual transitions between different clusters, illustrating how breast cancer cells transfer between discrete differentiation states in a sequential manner. ERα- breast cancer showed less prominent clustering but shared a quiescent cancer stem cell pool with ERα+ cancer. The cellular organization model was supported by single-cell data from primary tumors. The findings allow us to understand the organization of breast cancers at the single-cell level, thereby permitting better identification and targeting of cancer stem cells.


Figures

None
Graphical abstract
Figure 1
Figure 1
Workflow of CSC Enrichment Methods and Single-Cell Gene Expression Profiling (A–C) Breast cancer cell lines were cultured as regular monolayers, and cancer stem-like cells were enriched using three established techniques: (A) Growth in anchorage-independent culture (ERα+ and ERα− cell lines); (B) hypoxia (1% O2 for 48 hr) (MCF7 cells); (C) non-dividing, PKH26Bright cells cultured as mammospheres (MCF7 cells). (D) Single-cell gene expression profiling. Individual cells were collected by either FACS or microaspiration, lysed, and immediately frozen on dry ice. Single-cell RNA was reverse transcribed, followed by targeted cDNA pre-amplification and quantitative real-time PCR. Single-cell data were analyzed using various uni- and multivariate statistical tools. (E) Analyzed genes grouped by known expression patterns based on pre-existing literature. Full-length references are provided in the Supplemental Information.
Figure 2
Figure 2
Single-Cell Gene Expression Analysis of ERα+ Breast Cancer Cells Reveals Two Modes of Differentiation Single-cell gene expression profiling of ERα+ MCF7 and T47D cells grown in monolayer (ML) and anchorage-independent (anoikis-resistant, AR) cultures. (A and E) PCA scores of individual MCF7 and T47D cells. Identified ERα+ I–III groups are indicated by different colors. In the PCA scores plot each cell is represented by a dot. The position of a cell is defined by its gene expression profile. (B and F) PCA gene loadings, illustrating the contribution to the PCA scores in (A) and (E). (C and G) Mean expression levels of the classified ERα+ I–III groups. The percentages of ML and AR cells per identified group are indicated at the bottom of the table. Statistical significance of groups was determined by Fisher's exact test, ∗∗∗p ≤ 0.001. (D and H) Differentially expressed genes between ML and AR cells. Mean expression ± SEM are shown as dots (scale indicated at left y axis) and percentage of cells expressing a given gene are represented as bars (scale indicated at right y axis). The Mann-Whitney U test was used to identify significantly regulated genes, and p values were Bonferroni adjusted to correct for multiple testing. p ≤ 0.05, ∗∗p ≤ 0.01, ∗∗∗p ≤ 0.001. Number of analyzed cells: MCF7, ML: n = 80; AR: n = 77; T47D, ML: n = 78; AR: n = 80. See also Figures S1 and S3; Tables S2 and S4.
Figure 3
Figure 3
Single-Cell Gene Expression Analysis of ERα− Breast Cancer Cells Reveals Subpopulations of Cells with Variable Proliferative Capacity Single-cell gene expression profiling of ERα− CAL120 and MDA231 cells grown in monolayer (ML) or anchorage-independent (anoikis-resistant, AR) cultures. (A and E) PCA scores of individual CAL120 and MDA231 cells. Identified ERα− I–III groups are indicated in different colors. In the PCA scores plot each cell is represented by a dot. The position of a cell is defined by its gene expression profile. (B and F) PCA gene loadings, illustrating the contribution to the PCA scores in (A) and (E). (C and G) Mean expression levels of the PCA-identified ERα− I–III groups. The percentages of ML and AR cells per identified group are indicated at the bottom of the table. Statistical significance of groups was determined by Fisher's exact test, p ≤ 0.05. (D and H) Differentially expressed genes between ML and AR cells. Mean expression ± SEM are shown as dots (scale indicated at left y axis) and percentage of cells expressing a given gene are represented as bars (scale indicated at right y axis). The Mann-Whitney U test was used to identify significantly regulated genes, and p values were Bonferroni adjusted to correct for multiple testing. p ≤ 0.05, ∗∗p ≤ 0.01, ∗∗∗p ≤ 0.001. Number of analyzed cells: CAL120, ML: n = 75; AR: n = 65; MDA231, ML: n = 84; AR, n = 75. See also Figures S2 and S3; Tables S3 and S4.
Figure 4
Figure 4
ERα+ and ERα− Cells Define a Common Quiescent Cell Pool Featuring CSC-like Characteristics Single-cell gene expression analysis of all 615 ERα+ and ERα− breast cancer cells. (A) PCA scores of individual MCF7, T47D (ERα+) as well as CAL120 and MDA231 (ERα−) cells, cultured as monolayers (ML) and in anchorage-independent growth conditions (anoikis-resistant, AR). Each cell is represented by a symbol, specific for the cell line as shown in the figure. Identified groups are indicated in different colors. (B) PCA gene loadings, illustrating the contribution to the PCA scores in (A). (C) Cell-to-cell correlation heatmap of the ERα+/ERα− I group using the Spearman correlation coefficient. ERα− cells are indicated by black arrow heads. (D) Hypothesized cellular organization of ERα+ and ERα− cell lines. The model mimics the PCA score plot in (A). Cell state conversions are indicated as bidirectional process, black arrows denote differentiation, and gray arrows indicate putative de-differentiation. (E) PCA scores of individual cells generated from one ERα+ and one ERα− primary tumor, respectively. (F) PCA gene loadings, illustrating the contribution to the PCA scores in (D). (G) Hypothesized cellular organization of ERα+ and ERα− primary tumors. The model mimics the PCA score plot in (E). Directions of cell state conversions are indicated by arrows (red and blue, differentiation; gray, de-differentiation).
Figure 5
Figure 5
Hypoxia Enriches Two Distinct Populations with CSC Characteristics in ERα+ MCF7 Cells Single-cell gene expression profiling of ERα+ MCF7 cells grown in normoxic (21% O2) and hypoxic (1% O2) culture for 48 hr. (A) Fold change of carbonic anhydrase 9 (CA9) mRNA expression between normoxic and hypoxic MCF7 cells. Mean expression ± SD (n = 3) is shown. Statistical significance was determined with Student's t test, ∗∗p ≤ 0.01. (B) PCA scores of individual normoxic and hypoxic MCF7 cells. Cells have been divided into four stable groups based on Kohonen self-organizing map (SOM) analysis, displayed as Hx I–IV. Normoxic and hypoxic cells are represented by dots and squares, respectively. (C) PCA gene loadings, signifying the contribution to the PCA scores in (B). (D) Mean expression of PCA-identified Hx I–IV groups. The percentages of normoxic and hypoxic cells per SOM group are indicated at the bottom of the table. Statistical significance of the identified groups was computed using the chi-square test, ∗∗∗p ≤ 0.001. (E) Differentially expressed genes between normoxic and hypoxic cells. Mean expression ± SEM is shown as dots (scale indicated at left y axis) and percentage of cells expressing a given gene are represented as bars (scale indicated at right y axis). The Mann-Whitney U test was used to identify significantly regulated genes, and p values were Bonferroni adjusted to correct for multiple testing. p ≤ 0.05, ∗∗p ≤ 0.01, ∗∗∗p ≤ 0.001. Normoxic cells: n = 84; hypoxic cells: n = 84. See also Figure S4 and Table S5.
Figure 6
Figure 6
Single-Cell Gene Expression Analysis of Label-Retaining Mammosphere-Initiating ERα+ MCF7 Cells Reveals Three Distinct Subpopulations with CSC-like Features Single-cell gene expression profiling of PKH26 label-retaining ERα+ MCF7 cells isolated from mammosphere cultures. (A) Maximum-intensity projection of a confocal micrograph of a mammosphere containing a single PKH26Bright cell (white arrow). (B) Micrograph of a PKH26Bright MCF7 single cell derived from dissociated mammospheres and collected by microaspiration. (C) PCA scores of PKH26Bright MCF7 cells, collected by FACS (n = 90) and microaspiration (n = 14). Identified PKH I–III groups are indicated by different colors. Each cell is represented by a dot. (D) PCA gene loadings showing the contribution to the PCA scores in (C). (E) Mean expression levels of the PCA-identified PKH I–III groups. The percentages of cells per SOM group are indicated at the bottom of the table. See also Figures S5 and S6.
Figure 7
Figure 7
ERα+ MCF7 Cells Feature Distinct Differentiation States Organized in a Hierarchical Manner (A) PCA scores displaying ERα+ MCF7 cells. For a comprehensive analysis of cell types present, enriched anoikis-resistant (AR), hypoxic and PKH26Bright cells, as well as corresponding monolayer (ML) populations were subjected to PCA. Cells were classified into four groups, MCF7 I–IV, using SOMs. Data were autoscaled by cell to compensate for absolute differences in expression levels. (B) PCA gene loadings showing the contribution to the PCA scores in (A). (C) Percentage of cells per identified MCF7 I–IV group. Statistical significance of the identified groups was verified by using the chi-square test, ∗∗∗p ≤ 0.001. (D) Proposed model displaying distinct identified cell states and hierarchical organization of MCF7 cells. The trend of gene expression of epithelial/differentiation, breast cancer stem cell (BCSC), pluripotency, EMT/metastasis, and proliferation-associated genes are indicated outside the box that mimics the PCA score plot in (A). Based on gradual gene regulation, differentiation and putative de-differentiation likely take place sequentially via several progenitor states along the hierarchy as further highlighted by the gray crossed circle, indicating a non-likely differentiation route.

References

    1. Al-Hajj M., Wicha M.S., Benito-Hernandez A., Morrison S.J., Clarke M.F. Prospective identification of tumorigenic breast cancer cells. Proc. Natl. Acad. Sci. USA. 2003;100:3983–3988. - PMC - PubMed
    1. Badve S., Nakshatri H. Breast-cancer stem cells—beyond semantics. Lancet Oncol. 2012;13:e43–48. - PubMed
    1. Bertos N.R., Park M. Breast cancer—one term, many entities? J. Clin. Invest. 2011;121:3789–3796. - PMC - PubMed
    1. Chaffer C.L., Brueckmann I., Scheel C., Kaestli A.J., Wiggins P.A., Rodrigues L.O., Brooks M., Reinhardt F., Su Y., Polyak K. Normal and neoplastic nonstem cells can spontaneously convert to a stem-like state. Proc. Natl. Acad. Sci. USA. 2011;108:7950–7955. - PMC - PubMed
    1. Charafe-Jauffret E., Ginestier C., Monville F., Finetti P., Adelaide J., Cervera N., Fekairi S., Xerri L., Jacquemier J., Birnbaum D. Gene expression profiling of breast cell lines identifies potential new basal markers. Oncogene. 2006;25:2273–2284. - PubMed

Publication types

MeSH terms

Substances