. 2016 Jan 14;164(1-2):115-127.
doi: 10.1016/j.cell.2015.11.057.

Force Feedback Controls Motor Activity and Mechanical Properties of Self-Assembling Branched Actin Networks

Affiliations

Force Feedback Controls Motor Activity and Mechanical Properties of Self-Assembling Branched Actin Networks

Peter Bieling et al. Cell. .

Abstract

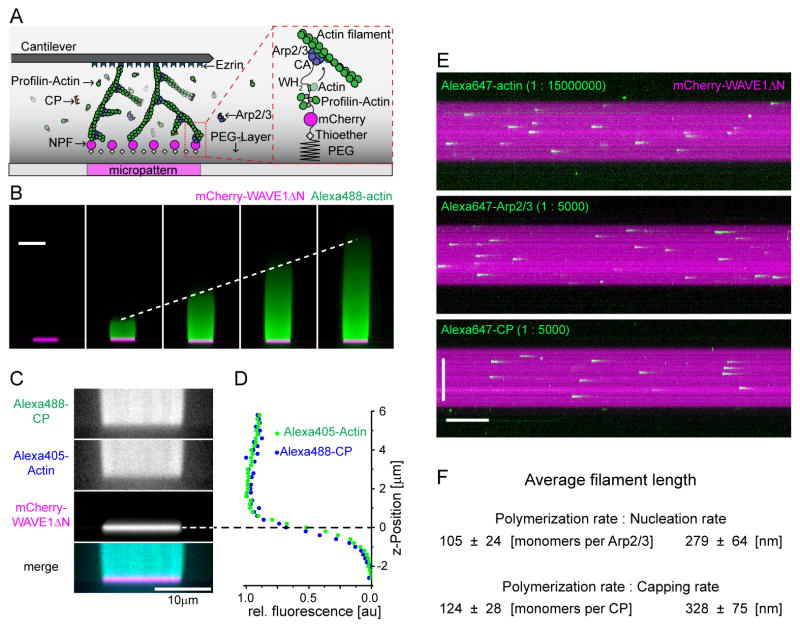
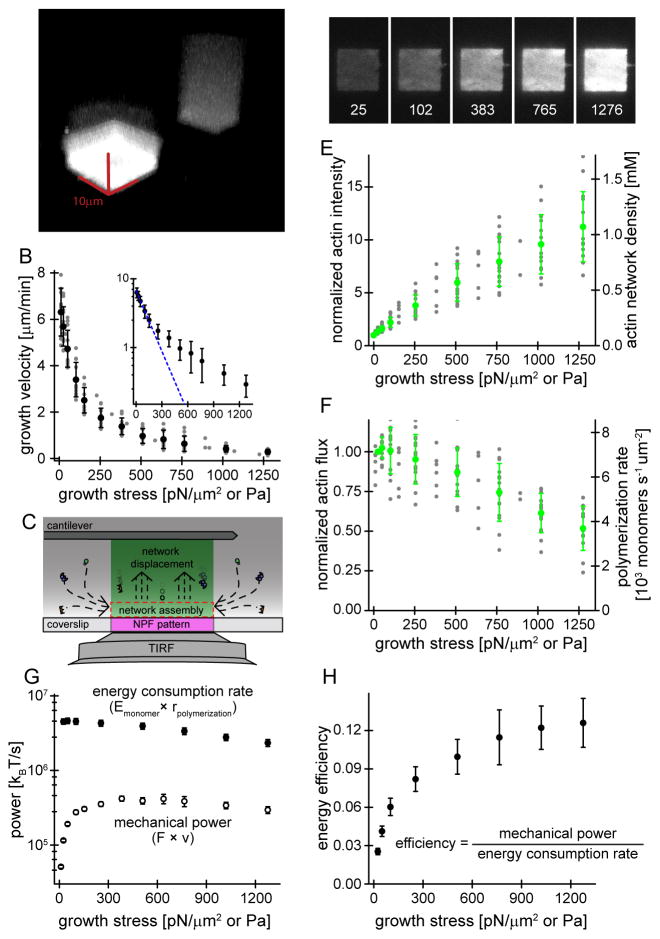
Branched actin networks--created by the Arp2/3 complex, capping protein, and a nucleation promoting factor--generate and transmit forces required for many cellular processes, but their response to force is poorly understood. To address this, we assembled branched actin networks in vitro from purified components and used simultaneous fluorescence and atomic force microscopy to quantify their molecular composition and material properties under various forces. Remarkably, mechanical loading of these self-assembling materials increases their density, power, and efficiency. Microscopically, increased density reflects increased filament number and altered geometry but no change in average length. Macroscopically, increased density enhances network stiffness and resistance to mechanical failure beyond those of isotropic actin networks. These effects endow branched actin networks with memory of their mechanical history that shapes their material properties and motor activity. This work reveals intrinsic force feedback mechanisms by which mechanical resistance makes self-assembling actin networks stiffer, stronger, and more powerful.


Figures

Fig. 1
Fig. 1. Reconstitution of branched network with in vivo-like properties from micropatterned surfaces
(A) Scheme: NPF patches, bound to a PEG passivated coverslip, rapidly assemble dendritic networks from profilin-actin, CP and Arp2/3. Networks are visualized by fluorescence microscopy and mechanically manipulated through an AFM cantilever. (B) Confocal microscopy (reconstructed axial view) of actin assembly (Alexa488-actin, green) from WAVE1ΔN micropatterns (magenta) after indicated time of protein addition (5μM actin (1% Alexa 488-labeled), 5μM profilin, 100nM Arp2/3, 100nM CP). (C) Reconstructed axial view for indicated dendritic network components from confocal imaging. Conditions as in B) with 15% TMR-CP and 5% Alexa647-Arp2/3. (D) Intensity profiles of actin (blue) and CP (green) along axial dimension from confocal microscopy. Surface position (z=0) was defined by the maximal mCherry-WAVE1 fluorescence signal (dashed line) (E) Space-time plots (kymographs) from single molecule TIRF imaging of either actin (top), Arp2/3 (middle) or CP (bottom) incorporation into dendritic networks at a small reference stress of 25 pN/μm2. Rates were determined by the product of the incorporation rate and the known labeling ratio (see Suppl. Methods). (F) Average filament lengths as determined by the ratio of the single-molecule polymerization and the nucleation (top) or the capping (bottom) rate. All error indicators are SEM.
Fig. 2
Fig. 2. Force-feedback increases density and mechanical efficiency of branched actin networks
(A) 3D reconstruction from confocal microscopy of two networks growing under an AFM cantilever (left) or freely into solution (right). (B) Steady-state growth velocities of networks as a function of growth stress. Grey=raw data, black=averages. Inset is a semi-logarithmic replot together with a single exponential fit (dashed blue line) to the low-force data. (C) Scheme of network assembly visualized by TIRFM. (D) TIRFM images of networks (Alexa488-actin) at indicated growth stress. (E) Actin intensity (left y-axis, normalized to unloaded control) and the calculated actin density (right y-axis, calibrated by single molecule experiments (Fig. 1E and Methods)) as a function of growth stress. Grey=raw data, green=averages. (F) Actin flux (left y-axis, product of network density (see Fig. 2B) and growth velocity (see Fig. 2C), normalized to flux at 25 pN/μm2) and polymerization rates (right y-axis, calibrated by single molecule experiments (see Fig.1E)) as a function of growth stress. Grey=raw data, green=averages. (G) Logarithmic plot of energy consumption rate (product of polymerization rate (rpolymerization, Fig. 2F) and free energy change per monomer (Emonomer= 3.18 kBT, see Suppl. Methods)) and mechanical power (calculated by the product of velocity (v) and force (F) (see Fig. 2E)) as a function of growth stress. (H) Mean energy efficiency (determined by the ratio of the mechanical power and the energy consumption rate (see Fig. 2G)) as a function of growth stress. Error bars are SD (B, E, F) or SEM (G,H).
Fig. 3
Fig. 3. Force-feedback increases the density of free barbed ends within the network but does not alter the stoichiometry of its constituents
(A) Scheme of network assembly under low (left) or high stress (middle and right). Density increase by either rise in the number of free ends (middle) and/or changes in packing of filaments (right). (B) TIRFM images of TMR-CP binding (top alone (greyscale) or as color merge with Alexa488-actin (green and magenta, bottom)) to networks either unloaded or assembled under 1020 pN/μm2 load at indicated times after kinetic arrest (t=0 is the addition of labeling mix (27.5 μM Latrunculin B, 27.5μM phalloidin, 18.5 nM TMR-CP). (C) Free barbed end densities (normalized to unloaded control) from either TIRFM (magenta) or 3D STORM (black) as a function of growth stress. (D) Free barbed end (magenta) or actin (green) densities normalized to unloaded control as a function of growth stress. The increased free end density (vertical, solid lines) accounts for a fraction of actin density rise and the residual rise is due to denser filament packing (diagonal, dotted lines). (E) Ratio of fluorescence intensities (left y-axis, normalized to unloaded control) or average filament lengths (right y-axis, calibrated by single molecule assays, Fig.1F) of actin/CP (magenta) or actin/Arp2/3 (blue) as a function of growth stress. Error bars are SD.
Fig. 4
Fig. 4. Adaptation to load- and growth-forces shapes the material properties of branched networks
(A) Scheme of network assembly under high (dark red arrow, top) or low (light red arrow, bottom) growth stress, resulting in high (dark green) or low (light green) network density. (B) Actin fluorescence from TIRFM imaging (green, left y-axis) and initial elasticity from microrheology (black, right y-axis) as a function of growth stress. Measurements were performed at low test load (12.5–25 pN/μm2) following network arrest. (C) Change in network height (orange) after growth stress release to low levels (12.5 - 25 pN/μm2) following arrest for networks assembled at different growth stresses as indicated. Height was normalized to the initial network height at the moment of growth arrest (blue). (D) Scheme: Networks are assembled under growth stresses (red arrows, left), arrested (dashed line) and then subjected to increasing test load (blue arrows, right). Elasticity is measured at each test load. (E) Network elasticity as a function of test load for networks assembled at different growth stresses as indicated. (F) as (E) with elasticity normalized to the initial elasticity and the test load normalized to the growth stress. (G) Network viscosity as a function of test load for networks assembled under different growth stresses as indicated. (H) Same as (G) but with the test load normalized to the growth stress. Error bars are SD (B–C) or are ½ SD (D–H).
Fig. 5
Fig. 5. Loading beyond the growth force causes mechanical failure leading to history-dependent mechanical properties
(A) Scheme: Networks are assembled at different growth stresses (red arrow, left) resulting in different network densities (green), arrested (dashed line) and initial height and elasticity are measured under low test load. Networks are then subjected to stress cycles consisting of high test load followed by a low test load, recovery step during which the residual height and elasticity is determined (blue arrows, right). (B) Residual network height (normalized to the initial height) measured during the recovery step as a function of the previously applied high test load for networks assembled under different growth stress. The dashed magenta line is the ideal elastic case (full recovery). (C) Same as (B) but with the test load normalized to the growth stress. Residual network height was normalized to the residual height after the test load reached the growth stress. (D) Residual network elasticity measured during the recovery step as a function of the previously applied high test load for networks assembled under different growth stresses. (E) Same as (D) but with the residual elasticity normalized to the initial elasticity. (F) Top: Composite network assembly. Networks are first assembled at a high growth stress, i.e at high actin density (left). Upon reaching a defined height, growth stress is reduced giving rise to a sparse network layer (right). Bottom: Growth stress (red, left y-axis) and actin fluorescence (green, right y-axis) of a discontinuous, two-layered network as a function of network height. (G) Network elasticity as a function of test load for either homogenous networks assembled at constant growth stress (510 or 25 pN/μm2) or a composite network assembled at 510 and 25 pN/μm2 as indicated. Dashed magenta line is the estimated network elasticity for the composite network assuming purely elastic behavior (Methods). The continuous magenta line is an estimate that additionally includes mechanical failure (plastic deformation) (Methods). All error bars are ½ SD.
Fig. 6
Fig. 6. Branched network mechanics are distinct from random gels and not fundamentally changed by crosslinkers
(A) Elasticity of entangled (light grey, from Gardel et al., 2003) or cross-linked random gels (dark grey, from Gardel et al., 2004, 0.03 actin:scruin ratio) compared to branched networks (green) as a function of actin density. Lines are power laws with indicated scaling factors (Methods). (B) Double-logarithmic plot of network elasticity as a function of test load (prestress) for either random cross-linked networks of different actin concentration (magenta, from dark to light=29.4, 21.4, 8.33 μM, 0.03 actin:scruin ratio, from Gardel et al., 2004) or branched networks assembled at indicated growth stress (green). The dashed magenta line indicates the “universal” scaling behavior of random actin gels. (C) Fluorescence of network-bound Filamin-A (red) or a-Actinin (blue) by confocal microscopy as a function of total concentration. Lines are fits to single-site binding models. Dashed lines indicate concentrations used for mechanical measurements resulting in a fractional occupancy of binding sites as indicated (D) Network elasticity as a function of test load for networks assembled at a growth stress of 25 (light) or 510 pN/μm2 (dark) growth stress and additionally crosslinked with either Filamin-A (red) or a-Actinin (blue) or a buffer control (black). (E) Residual network height (normalized to initial network height) for networks assembled at low (25 pN/μm2) growth stress, crosslinked with Filamin-A (red), α-Actinin (blue) or a buffer control (black) as a function of the previously applied test load. Height was measured during the recovery step. (F) Same as (E) but for networks assembled at high (510 pN/μm2) growth stress. All error bars are ½ SD.
Fig. 7
Fig. 7. Branched network motor activity depends on the mechanical environment
(A) Scheme of branched actin networks (green) pushing against the ECM (orange) at the leading edge. (B) Scheme of a network pushing against an AFM cantilever. The AFM can operate either keeping the force constant (zero external stiffness, left) or the external stiffness constant (defined force at a given cantilever deflection, right). (C) Sample height (top), normalized growth velocity (middle) and force (bottom) for two networks assembled under constant high (50 nN) growth force (blue area), resulting in high (dark green traces) network stiffness. At t=0, force-feedback is disengaged and networks displace cantilevers imposing either high (k=0.1N/m, dark orange area) or low (k=0.01N/m, light orange area) external stiffness. The drop in velocity can be predicted (dashed lines) from the known network stiffness (Methods). (D) Same as (C) for two networks grown under constant high (50 nN, dark blue area) or low (5 nN, light blue area) growth force (light blue area), resulting in high (dark green trace) and low (light green trace) network stiffness, respectively. After disengaging the force-feedback, networks are challenged with the same external cantilever stiffness (k=0.1 N/m, dark orange area) (E) Sample height as a function of time for networks pushing against cantilevers of different stiffnesses. Networks were grown in the absence of force to a height of 3μm before cantilever contact (t=0). (F) Network growth velocity as a function of growth force under either constant force (blue dashed line, see Fig. 2E) or constant stiffness conditions (orange) for three different external (cantilever) stiffnesses as indicated. Error bars are SD.

References

    1. Akin O, Mullins RD. Capping protein increases the rate of actin-based motility by promoting filament nucleation by the Arp2/3 complex. Cell. 2008;133:841–851. - PMC - PubMed
    1. Beltzner CC, Pollard TD. Pathway of actin filament branch formation by Arp2/3 complex. J Biol Chem. 2008;283:7135–7144. - PubMed
    1. Bisi S, Disanza A, Malinverno C, Frittoli E, Palamidessi A, Scita G. Membrane and actin dynamics interplay at lamellipodia leading edge. Curr Opin Cell Biol. 2013;25:565–573. - PubMed
    1. Cameron LA, Svitkina TM, Vignjevic D, Theriot JA, Borisy GG. Dendritic organization of actin comet tails. Curr Biol. 2001;11:130–135. - PubMed
    1. Carter NJ, Cross RA. Mechanics of the kinesin step. Nature. 2005;435:308–312. - PubMed

Publication types

MeSH terms

Substances