. 2016 Jan 14;164(1-2):183-196.
doi: 10.1016/j.cell.2015.11.034.

Astrocytes Assemble Thalamocortical Synapses by Bridging NRX1α and NL1 via Hevin

Affiliations

Astrocytes Assemble Thalamocortical Synapses by Bridging NRX1α and NL1 via Hevin

Sandeep K Singh et al. Cell. .

Abstract

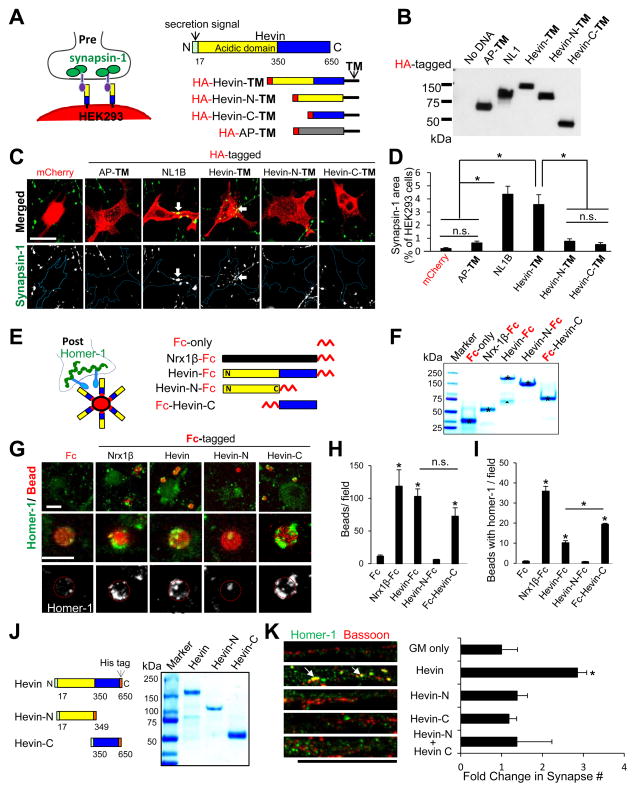
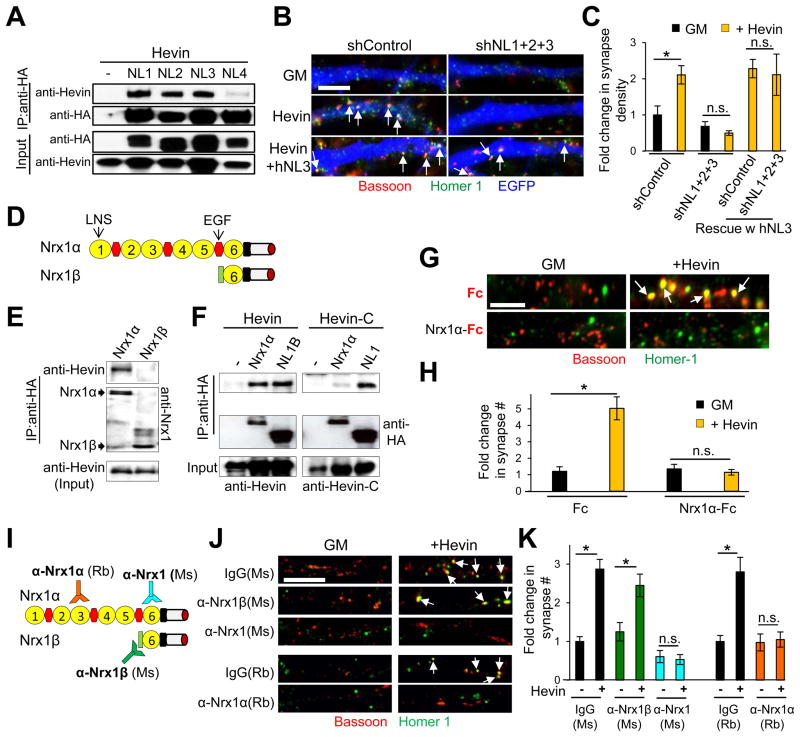
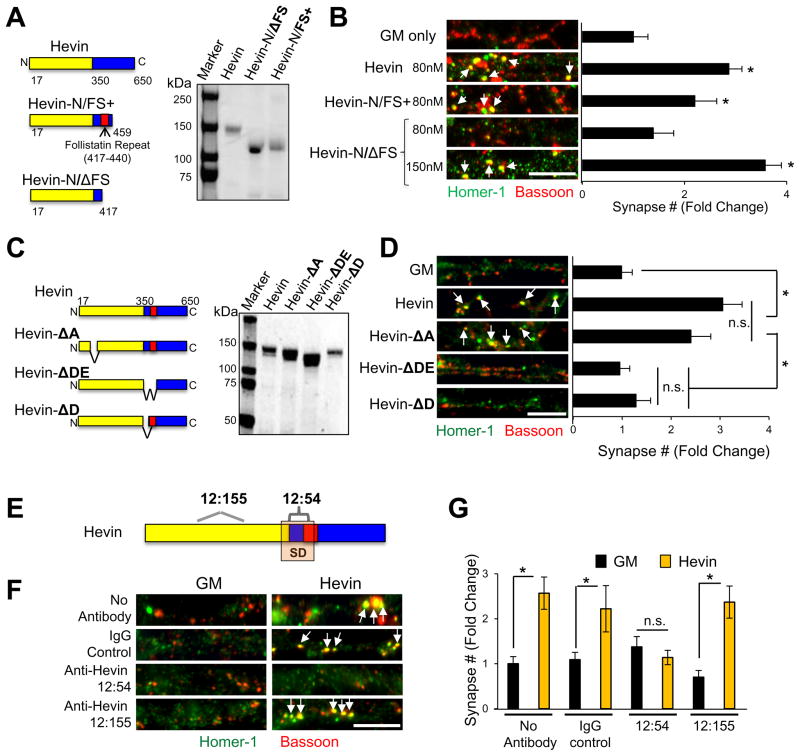
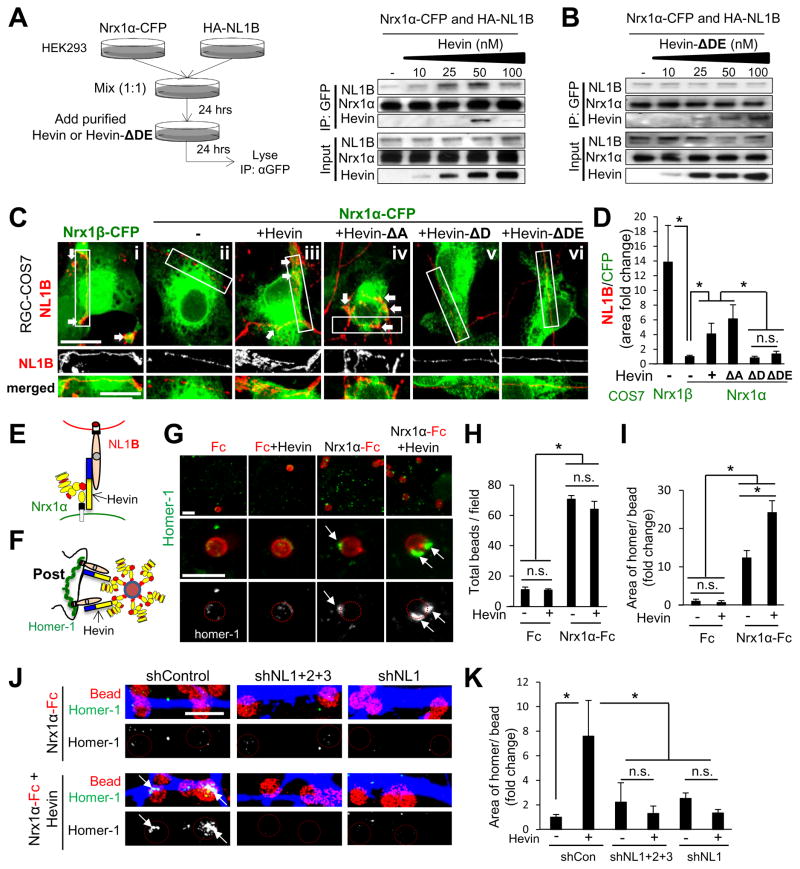
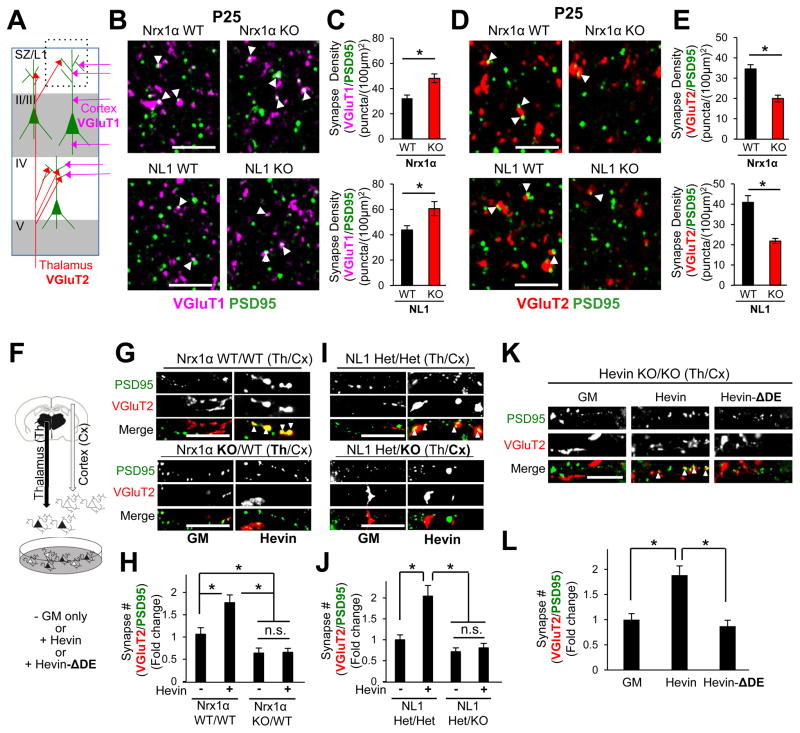
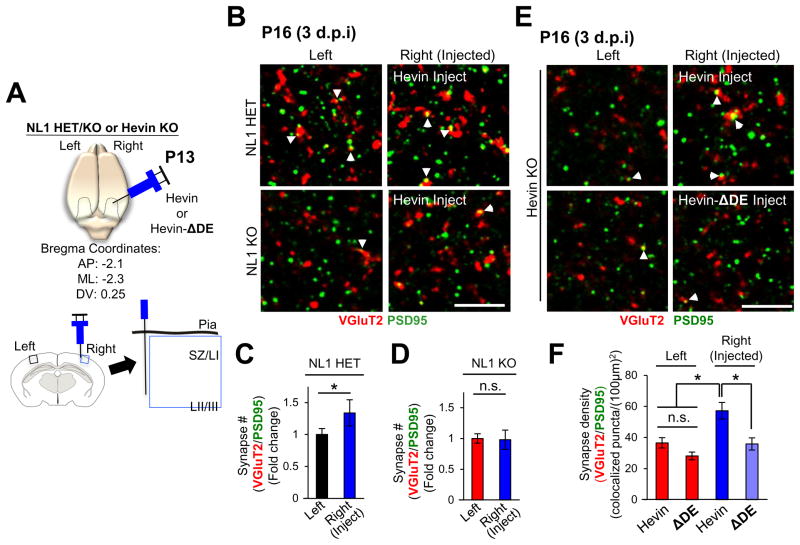
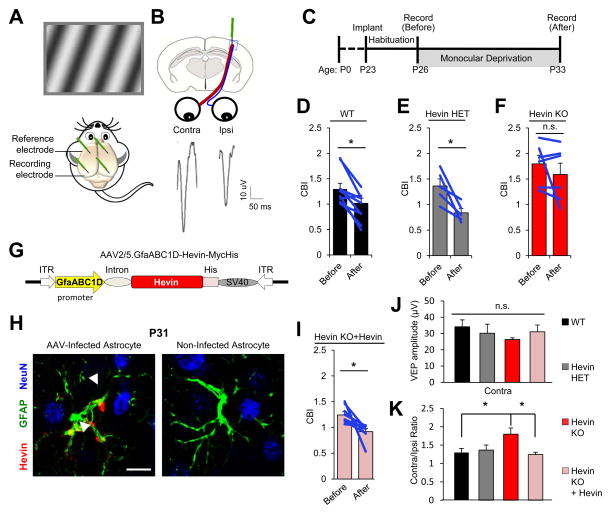
Proper establishment of synapses is critical for constructing functional circuits. Interactions between presynaptic neurexins and postsynaptic neuroligins coordinate the formation of synaptic adhesions. An isoform code determines the direct interactions of neurexins and neuroligins across the synapse. However, whether extracellular linker proteins can expand such a code is unknown. Using a combination of in vitro and in vivo approaches, we found that hevin, an astrocyte-secreted synaptogenic protein, assembles glutamatergic synapses by bridging neurexin-1alpha and neuroligin-1B, two isoforms that do not interact with each other. Bridging of neurexin-1alpha and neuroligin-1B via hevin is critical for the formation and plasticity of thalamocortical connections in the developing visual cortex. These results show that astrocytes promote the formation of synapses by modulating neurexin/neuroligin adhesions through hevin secretion. Our findings also provide an important mechanistic insight into how mutations in these genes may lead to circuit dysfunction in diseases such as autism.


Conflict of interest statement

The authors declare no conflicts of interest.

Figures

Figure 1
Figure 1. Hevin organizes pre and postsynaptic specializations
(A) RGC-HEK293 co-culture assay: Trans-membrane-anchored (TM) and HA-tagged hevin and its fragments were expressed in HEK293 cells co-cultured with RGCs. (B) Western blot analysis of the HEK293 expression of HA-tagged constructs. (C) Representative images of synapsin-1 (green) clustering (arrow) on HA-tagged TM constructs expressed HEK293 cells (red). Scale bar= 20μm. (D) Quantification of the hemisynapse assay (n=15–18 cells/condition) as the area of synapsin-1 on HEK293 cells (% HEK293 cell area). (E) Schematic of the Fc-tagged proteins and homer-1-clustering in RGC-bead assay. (F) SDS-PAGE analysis of pure Fc-tagged proteins (asterisk). In the Hevin-Fc lane a naturally occurring hevin cleavage product is also detected (triangle). (G) Representative images of RGCs in the postsynaptic bead-clustering assay. Scale bar= 5μm. Quantification of the number of beads/field (H) orbeads with homer-1 clusters/field (I)(n=10–15 fields/condition). (J) Purified full-length hevin or hevin fragments (5μg/lane). (K) (Left) Representative images of RGC dendrites treated with growth media (GM) only, 80nM hevin, or hevin fragments showing synapses as co-localization of bassoon and homer-1 (arrows). Scale bar= 20μm. (Right) Quantification of co-localized synaptic puncta/cell as fold change normalized to GM condition (n>20 cells/condition). For all graphs: *p<0.05, one way ANOVA followed by Fisher’s LSD Post-Hoc test, error bars ±SEM.See also Figure S1.
Figure 2
Figure 2. NLs and Nrx1α are synaptic receptors for hevin
(A) Hevin co-immunoprecipitates (co-IP) with HA-tagged NLs in HEK293 cells. (B) Representative images of shRNA-transfected dendrite stretches (blue). Synapses are labeled as co-localized bassoon (red) and homer-1 (green) puncta. (C) Quantification of fold change in the density of synapses made onto transfected neurons as fold change normalized to the shControl-no hevin condition (n>40 cells per condition).(D) Domain structures of Nrx1αand Nrx1β. (E) Hevin co-IP with HA-tagged Nrx1α, but not with Nrx1β in HEK293 cells. (F) Co-IP of Hevin-C fragment with Nrx1α and NL1. (G) Representative images of RGC dendrites treated with hevin and Fc-tagged proteins stained with bassoon (red) and homer-1 (green). Scale bar= 5μm. (H) Quantification of fold change in synapse number/cell normalized to the Fc-only treatment (3.2±0.76 synapses in Fc-only condition, n=20 cells/condition). For (C) and (H) *p<0.05; Student’s t-test; n.s., not significant, error bars±SEM. (I) Schematic presentation of the epitope locations for anti-Nrx1 antibodies. (J) Representative images of RGC dendrites with bath-applied Nrx1α-recognizing antibodies with or without hevin. (K) Quantification of fold change in synapse number/cell (n>28 cells/condition, *p<0.05; one way ANOVA followed by Fisher’s LSD Post-Hoc test, error bars±SEM). Fold change is calculated by normalizing to the number of synapses/cell in respective Ms or Rb control antibody-only treated condition (2.72±0.97 and 3.36±0.16 synapses in Ms and Rb antibody-only condition, respectively). Scale bars= 5μm. See also Figure S2.
Figure 3
Figure 3. Identification of a region within hevin that is critical for its receptor interactions and synaptogenic activity
(A) Domain organization and SDS-PAGE analysis of hevin and two synaptogenic hevin fragments. (B) Representative images of RGC dendrites treated with GM or recombinant hevin proteins. Synapses are labeled as the co-localization of bassoon (red) and homer-1 (green) puncta (arrows). (C) Schematics and SDS-PAGE analysis of hevin and hevin deletion mutants. (D) Representative images of RGC dendrites treated with GM, hevin or hevin deletion mutants, arrows point to co-localized synaptic puncta. (B and D) Data is presented as fold change in synapse number/cell compared to GM (n>35 cells). (E) Schematic of hevin’s putative synaptogenic region (SD) and epitopes for the two rat monoclonal antibodies against hevin. (F) Representative images from dendrites of RGCs treated with GM or hevin in the presence of serotype matched control rat antibody (IgG-Control) or anti-Hevin 12:155 or anti-Hevin 12:54. (G) Quantification of fold changes in synapse number/cell relative to GM condition (3.25±0.84 synapses/cell, n>20 cells/condition). *p<0.05, one way ANOVA followed by Fisher’s LSD Post-Hoc test error bars±SEM. Scale bars= 5μm. See also Figure S3.
Figure 4
Figure 4. Hevin bridges interaction-incompatible Nrx1α and NL1B transcellularly
(A) Triple co-IP strategy: HEK293 cells were transfected with Nrxα or NL1 isoforms and cells were mixed in the presence of various hevin or Hevin-ΔDE concentrations. Western blot analyses of the effects of hevin (A) or Hevin-ΔDE (B) on Nrx1α/NL1B interactions. (C) Representative images of the co-clustering of CFP-tagged α or β Nrx1-expressing COS7 cells (green) co-cultured with HA-NL1B expressing RGCs (red). Scale bar= 10μm. (D) Quantification of NL1B clustering onto Nrx1-expressing COS7 cells. Data presented as fold change of the ratios of NL1B area per Nrx1-expressing cell area (n=15–38 cells per condition) normalized to Nrx1α-CFP expressing cells in GM condition. (E) Hevin can bridge incompatible Nrx1α and NL1B transcellularly. (F) Schematic presentation of the Nrx1α-bead assay. (G) Representative images of analyzed fields (top) or single beads (middle and bottom) showing homer-1 (green) clustering on Nrx1α-Fc-coated beads (red) in the presence or absence of hevin. Scale bar= 5μm. Quantification of the number of beads/field (H) and fold chance in the area of homer-1 clusters per bead (I) (n=10–15 fields/condition) normalized to the Nrx1α-Fc beads without hevin condition. (J) Representative images of shRNA-transfected dendrites (blue) stained for homer-1 (green) and beads (red circles). Scale bar= 5μm. (K) Quantification of the area of homer-1 clusters per bead (n=10 fields/condition) as fold change normalized to the shControl no hevin condition. *p<0.05 one way ANOVA followed by Fisher’s LSD Post-Hoc test, error bars±SEM. See also Figure S4 and S5.
Figure 5
Figure 5. Nrx1α and NL1 are required for thalamocortical synapse formation
(A) Excitatory synaptic circuitry within the mouse V1 cortex. Synapse density analysis was performed in the synaptic zone (SZ/L1, dashed black box). (B and D) Representative zoomed-in images of P25 Nrx1α (top) or NL1 (bottom) WT and KO V1 cortices stained for (B) VGluT1 (magenta) and PSD95 (green) or (D) VGluT2 (red) and PSD95. Scale bar= 5μm. Quantification of (C) VGluT1/PSD95 or (E) VGluT2/PSD95 synapse density in Nrx1α (top) or NL1 (bottom) littermate WT and KO mice (n=3 mice/genotype). Data are represented as mean synaptic density per (100μm)2±SEM. *p<0.05, Student’s t-test. (F) Schematic of thalamocortical co-culture experiments. Representative images of dendrite segments treated with or without hevin (80nM) from (G) WT cortical (Cx) neurons co-cultured with Nrx1α WT or KO thalamic (Th) neurons or (I) NL1 HET or KO cortical (Cx) neurons co-cultured with NL1 HET thalamic (Th) neurons. Co-localization of VGluT2 (red) and PSD95 (green) mark thalamocortical synapses (arrowheads). Quantification of fold change in VGluT2/PSD95 positive synapse number/cell normalized to the number of synapses (H) in Nrx1α WT/WT (Cx/Th) cultures without Hevin or (J) in NL1 HET/HET (Cx/Th) cultures without Hevin. (K) Representative images of dendrite segments from cortical neurons in thalamocortical co-cultures prepared from Hevin KO mice with or without hevin or Hevin-ΔDE (80nM). (L) Quantification of VGluT2/PSD95 synapse numbers/cell normalized to GM condition. (H, J and L) n>30 cells/condition, *p<0.05; one way ANOVA followed by Fisher’s LSD Post-Hoc test, error bars±SEM). See also Figure S6.
Fig 6
Fig 6. Hevin induces thalamocortical synapse formation in vivo by bridging NL1 and Nrx1α
(A) Schematics of in vivo hevin or Hevin-ΔDE injection experiments into the cortices of P13 NL1 HET/KO or Hevin KO mice at the indicated bregma coordinates. Imaging and analysis for VGluT2/PSD95 was limited to the SZ just outside of the injection site (blue box). (B and E) Representative zoomed-in images of synaptic staining in left (uninjected) and right (injected) hemispheres of (B) NL1 HET and KO littermates or (E) Hevin KOs. Thalamocortical synapses are visualized by the VGlut2/PSD95 colocalization (arrowheads). Scale bar= 5μm. (C–D) Quantification of VGluT2/PSD95 synapses in NL1 HET or KO brains. Data presented as fold change in synapse number normalized to the number of synapses of the uninjected (left) hemisphere. *p<0.05, Student’s t-test; n.s., not significant, n=3 mice/genotype. Synapse density in the left (uninjected) cortices of NL1 HETs (78.87±6.96 VGluT2/PSD95 puncta/(100μm)2) and KOs (48.88±3.01 VGluT2/PSD95 puncta/(100μm)2) were significantly different from each other (p = 0.0002) (F) Quantification of thalamocortical synapse densities in Hevin KOs injected with hevin or Hevin-ΔDE.Data are presented as mean synaptic density per (100 μm)2±SEM. *p<0.05, one way ANOVA followed by Fisher’s LSD Post-Hoc test.
Figure 7
Figure 7. Astrocyte-Secreted Hevin is required for Ocular Dominance Plasticity (ODP)
(A) Mice were implanted with recording electrodes in layer 4 of the V1B cortex. A visual stimulus is displayed to mice while visually evoked potentials (VEPs) are recorded. (B) Cartoon schematic and VEP tracings from independent eye stimulations. (C) Experimental timeline used to study ODP. (D–F) Contralateral bias indices (CBI) before and after monocular deprivation (MD). Data are presented as mean CBI±SEM. *p<0.05; paired t-test; n.s., not significant. (G) AAV2/5-GfaABC1D-Hevin-myc-His viral construct used for astrocyte-specific rescue of hevin expression. (H) Hevin (red) expression is driven specifically in astrocytes (GFAP+, green), but not in neurons (NeuN+, blue). Scale bar= 10μm. (I) Astrocyte-specific hevin expression fully rescues ODP in Hevin KOs. Data are presented as mean CBI±SEM. *p<0.05; paired t-test. (J) Absolute VEP amplitude does not differ between all groups. (K) Comparison of CBIs before MD. Data are presented as mean CBI±SEM. (J–K) *p<0.05; one way ANOVA followed by Fisher’s LSD Post-Hoc test.

Comment in

  • Synaptogenesis: A synaptic bridge.
    Yates D. Yates D. Nat Rev Neurosci. 2016 Mar;17(3):135. doi: 10.1038/nrn.2016.12. Epub 2016 Feb 11. Nat Rev Neurosci. 2016. PMID: 26865017 No abstract available.

References

    1. Baudouin S, Scheiffele P. SnapShot: Neuroligin-neurexin complexes. Cell. 2010;141:908, 908 e901. - PubMed
    1. Bear MF, Kleinschmidt A, Gu QA, Singer W. Disruption of experience-dependent synaptic modifications in striate cortex by infusion of an NMDA receptor antagonist. The Journal of neuroscience : the official journal of the Society for Neuroscience. 1990;10:909–925. - PMC - PubMed
    1. Boucard AA, Chubykin AA, Comoletti D, Taylor P, Sudhof TC. A splice code for trans-synaptic cell adhesion mediated by binding of neuroligin 1 to alpha- and beta-neurexins. Neuron. 2005;48:229–236. - PubMed
    1. Bourne HR, Nicoll R. Molecular machines integrate coincident synaptic signals. Cell. 1993;72(Suppl):65–75. - PubMed
    1. Budreck EC, Kwon OB, Jung JH, Baudouin S, Thommen A, Kim HS, Fukazawa Y, Harada H, Tabuchi K, Shigemoto R, et al. Neuroligin-1 controls synaptic abundance of NMDA-type glutamate receptors through extracellular coupling. Proceedings of the National Academy of Sciences of the United States of America. 2013;110:725–730. - PMC - PubMed

Publication types