. 2016 Jan 14;164(1-2):293-309.
doi: 10.1016/j.cell.2015.11.062.

Functional Genomic Landscape of Human Breast Cancer Drivers, Vulnerabilities, and Resistance

Affiliations

Functional Genomic Landscape of Human Breast Cancer Drivers, Vulnerabilities, and Resistance

Richard Marcotte et al. Cell. .

Abstract

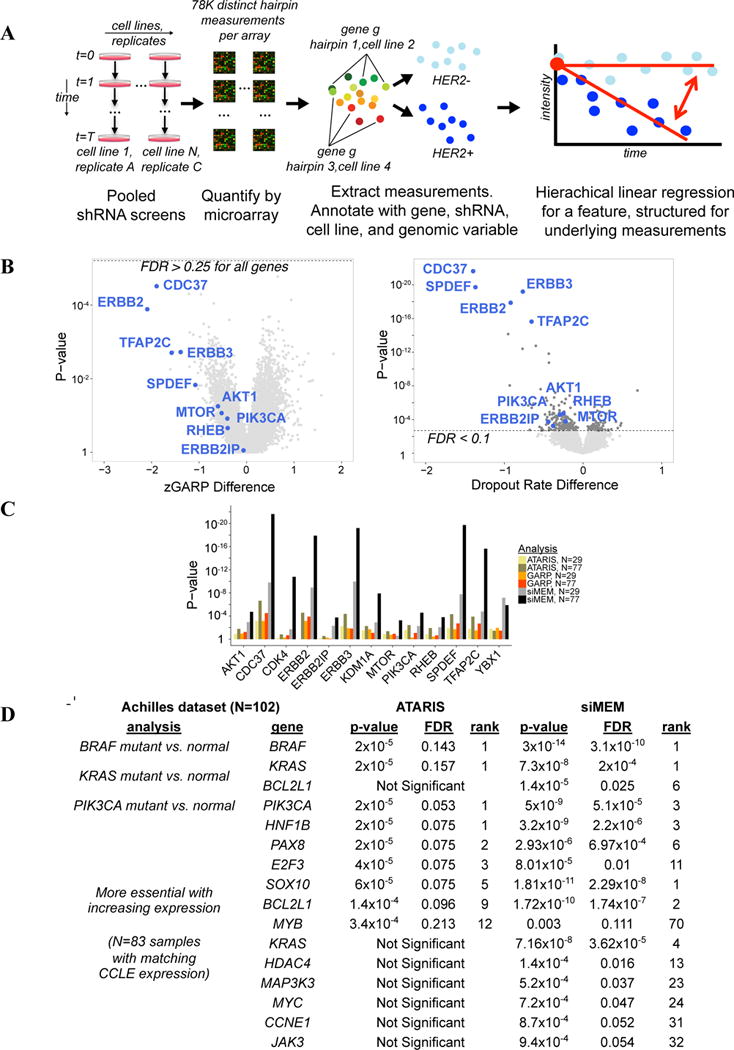
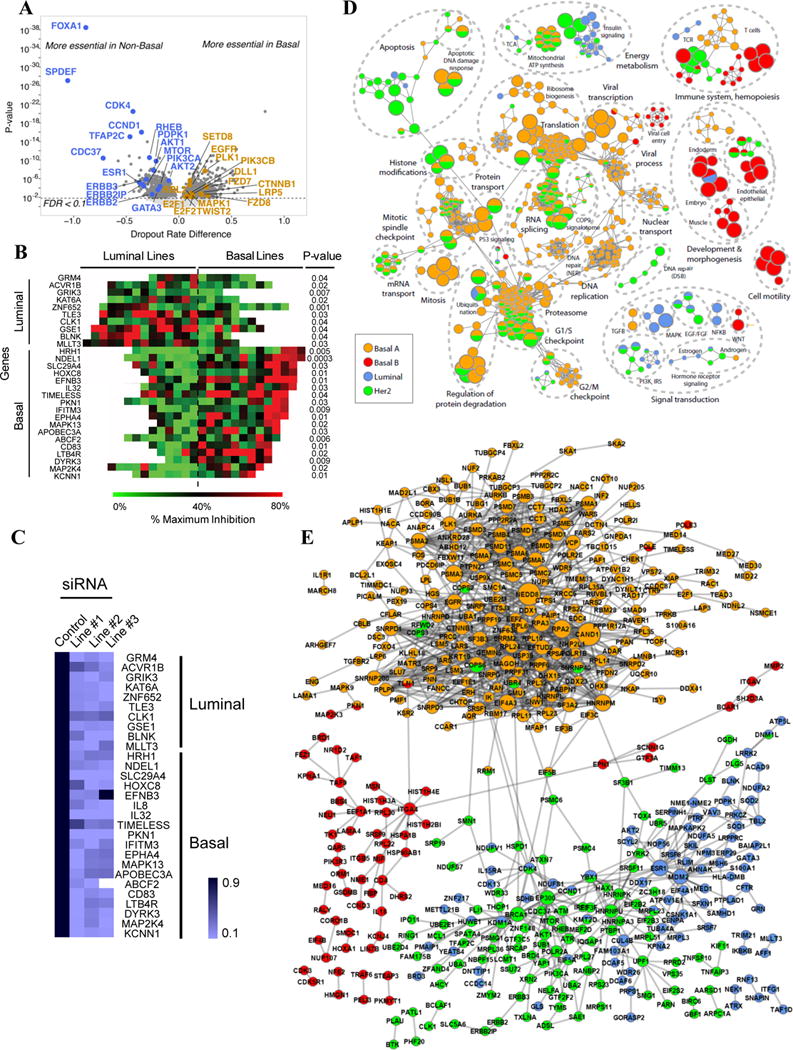
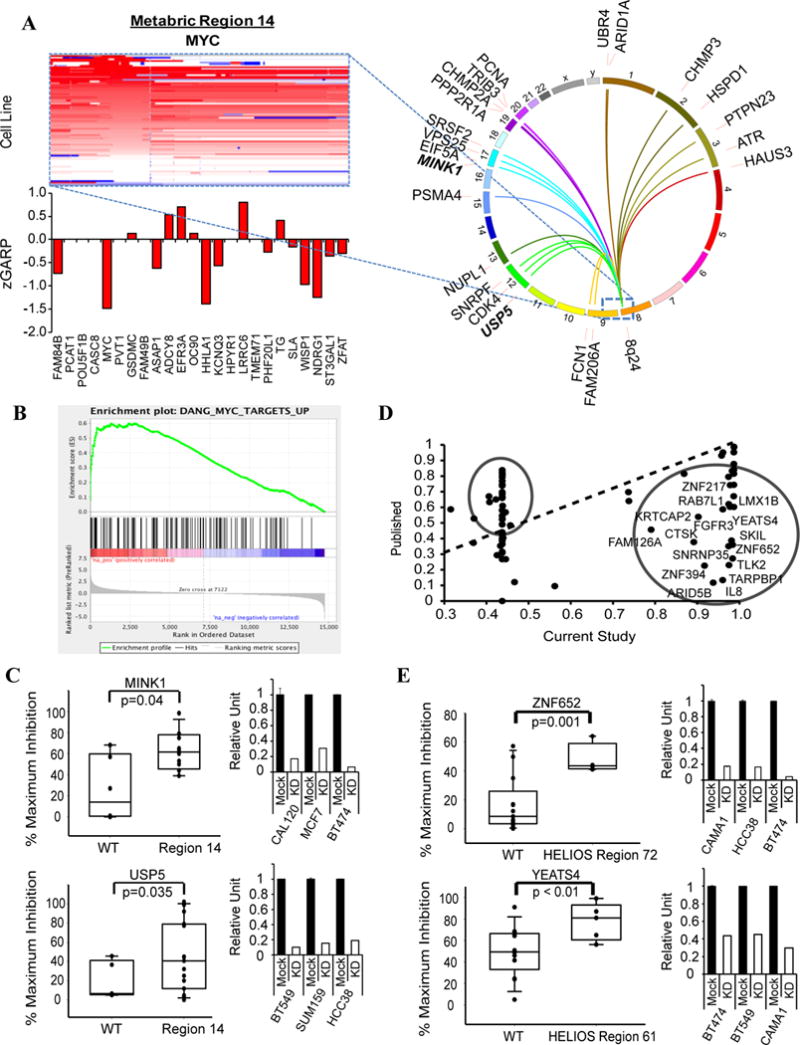
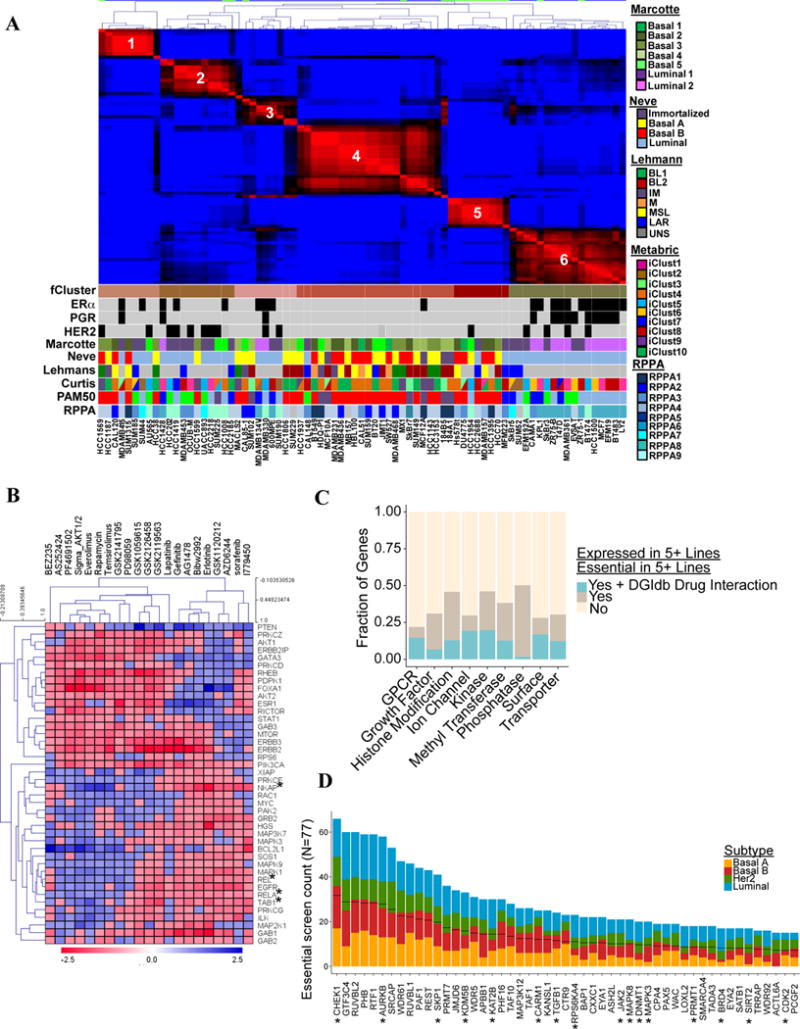
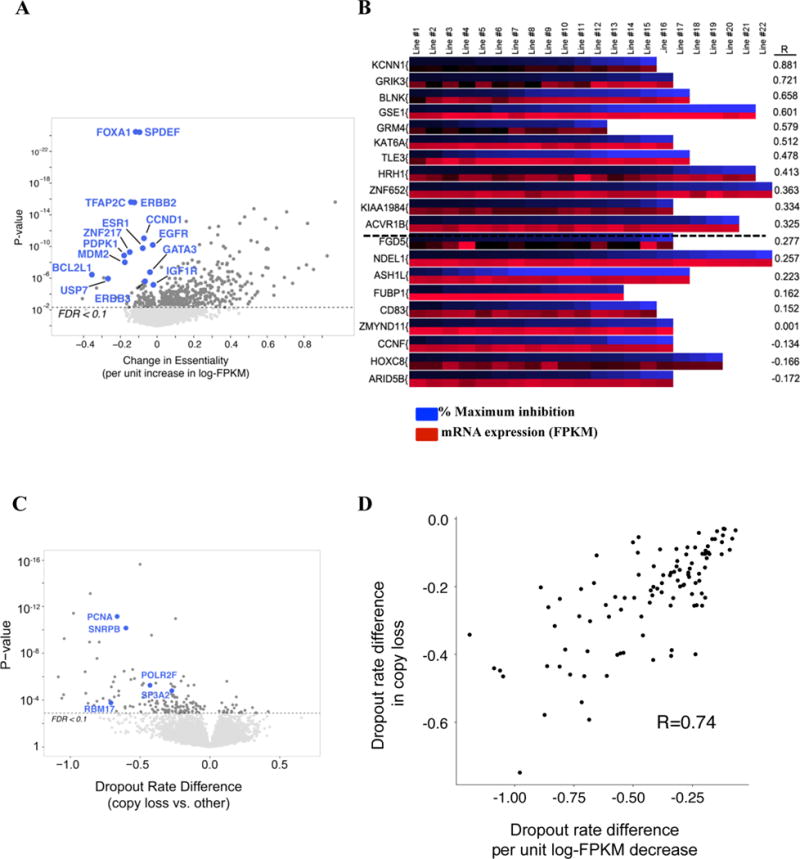
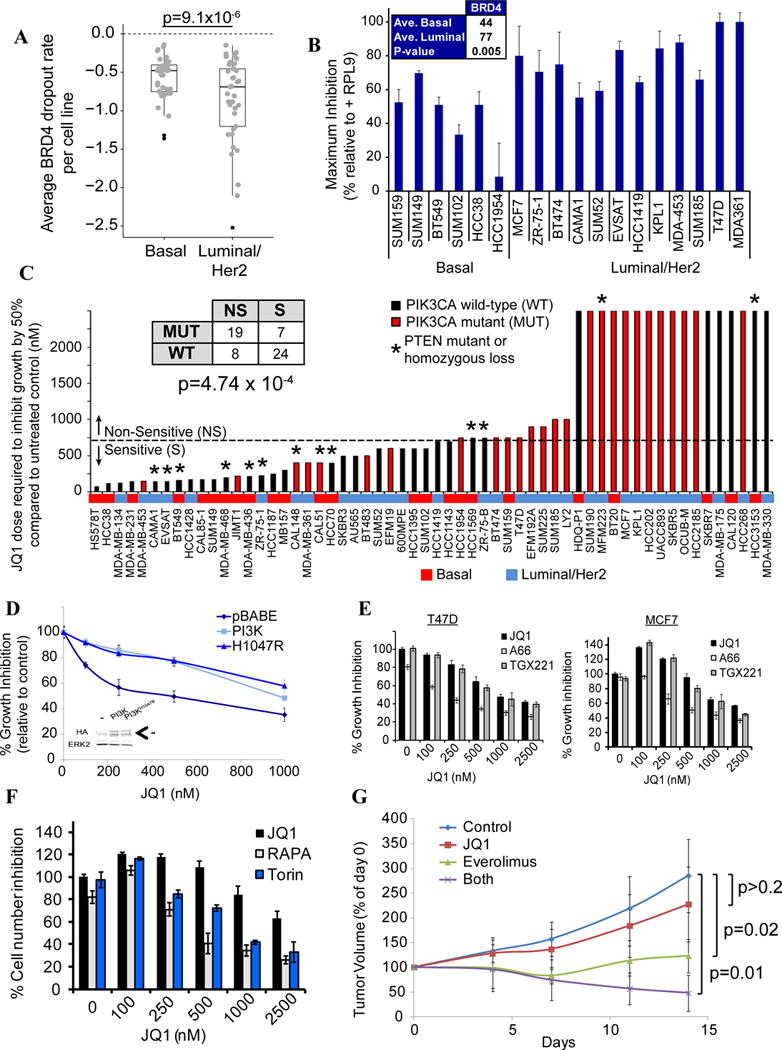
Large-scale genomic studies have identified multiple somatic aberrations in breast cancer, including copy number alterations and point mutations. Still, identifying causal variants and emergent vulnerabilities that arise as a consequence of genetic alterations remain major challenges. We performed whole-genome small hairpin RNA (shRNA) "dropout screens" on 77 breast cancer cell lines. Using a hierarchical linear regression algorithm to score our screen results and integrate them with accompanying detailed genetic and proteomic information, we identify vulnerabilities in breast cancer, including candidate "drivers," and reveal general functional genomic properties of cancer cells. Comparisons of gene essentiality with drug sensitivity data suggest potential resistance mechanisms, effects of existing anti-cancer drugs, and opportunities for combination therapy. Finally, we demonstrate the utility of this large dataset by identifying BRD4 as a potential target in luminal breast cancer and PIK3CA mutations as a resistance determinant for BET-inhibitors.


Figures

Figure 1
Figure 1
Genomic/proteomic characterization. A) CNA profiles of breast tumors (top) from TCGA and cell lines (bottom). B) NMF clustering of RNAseq data for breast cancer lines. ESR1 (ER), ERBB2 (HER2), PGR (PR), and AR (AR) expression are represented by black squares. Lines were assigned to published subtypes (colored boxes). C) NMF clustering of RPPA data. D) Frequency of indicated mutations in cell lines and tumors, grouped into basal and luminal/HER2 subtypes. Tumor data are from COSMIC. Also see Figure S1 and Table S1.
Figure 2
Figure 2
siMEM overview. A) Experimental scheme. Samples were hybridized to microarrays and dropout was quantified. Hierarchical linear regression summarizes data as a combination of initial measurement intensity, baseline trend, and difference in essentiality associated with changes in a genomic covariate (light blue vs. dark blue). B) Volcano plot of zGARP (left) and siMEM (right) essentiality differences associated with HER2+ lines. Dotted lines show FDR cutoff. C) siMEM produces the best p-values for known positives. D) BRAF, PIK3CA or KRAS mutant vs. normal, and expression vs. essentiality analyses of the Achilles dataset (N=102). Also see Figure S2, Table S2 and Extended Experimental Procedures.
Figure 3
Figure 3
Subtype-specific essential genes. A) Volcano plot of basal- and luminal/HER2-specific essentials. B) Heat map shows % proliferation-inhibition, compared to general essential RPL9 (100% inhibition), after pooled siRNA treatment (p-values: 1-sided t test). C) Knockdown efficiency (by q-RT-PCR) of siRNAs for genes in (B). D) Subtype-specific pathways. Each node represents a process; functionally similar nodes are grouped and labeled by enriched function. Nodes are colored according to the subtype in which the process is enriched; processes enriched in more than one subtype have multiple colors. Red: basal B; Orange: basal A; Green: HER2+; Blue: luminal. E) PPI networks for subtype-specific genes. Nodes represent genes, and are multi-colored if present in multiple subtypes; edges represent interactions. Also see Figure S3 and Table S3.
Figure 4
Figure 4
cis- and trans-essential genes for CNAs. A) Heat map showing 8q24 amplification (METABRIC-14, containing MYC) in cell lines. Red=amplification, blue=deletion. Bar graph shows average zGARP score for genes in the amplified region in amplicon+ lines. CIRCOS plot depicts top 20 significant genes (by siMEM) in amplicon+ vs –amplicon cells. B) GSEA of trans-essential genes for MYC targets (FDR < 0.0001). C) Validation of 8q24 trans-essential genes with siRNAs. Y-axis: % maximum inhibition Bar graphs: Knockdown efficiency (by qRT-PCR) of siRNAs. D) Correlation between published HELIOS scores (Y-axis) (Sanchez-Garcia et al. 2014) and new scores (X-axis) obtained using our screen data. Circled genes deviate from earlier score and represent potential new amplified drivers. E) Validation of HELIOS genes with siRNAs. Y-axis: % maximum inhibition Bar graphs: Knockdown efficiency of siRNAs. p-values were calculated by 1-sided t test. Also see Figure S4 and Table S4.
Figure 5
Figure 5
Screen refines classification and pathway identification. A) NMF clustering of screen results (zGARP). ESR1, ERBB2, and PGR expression are shown by black squares. Colored boxes indicate major published sub-categories. B) Unsupervised analysis of essential genes implicated in PI3K/mTOR or EGFR/MEK/ERK pathways. Heat map shows association of essentiality for each gene (this study) with sensitivity to drugs targeting these pathways (Daemen et al. 2013). C) Fraction of essential genes overlapping with reported “druggable” gene categories or gene-drug interactions (DGIdb). D) Top-ranked histone-modifying enzymes deemed essential in our screen, by breast cancer subtype. *Reported gene-drug interaction in DGIdb. Black lines represent 50% of lines in which the gene is essential. Also see Figure S5 and Table S5.
Figure 6
Figure 6
Additional features of shRNA screens. A) Volcano plot of relationship between essentiality and gene expression. X-axis: change in dropout rate per unit increase in expression log-FPKM; Y-axis: p-value. B) Heat map showing % inhibition of proliferation following knockdown by siRNA in cell lines. For each gene, the upper row (blue) represents maximum growth inhibition, while the lower row (red) represents mRNA levels of the same gene in each line. R=Pearson correlation. C) Vulnerabilities associated with genomic loss (CYCLOPS genes). D) Strong agreement (Spearman rho=0.74, p-value < 2.2 × 10⁻¹⁶) between genes more essential with heterozygous loss (FDR < 0.25) and genes whose essentiality changes significantly with expression (FDR < 0.25). Also see Figure S6 and Table S6.
Figure 7
Figure 7
BRD4 is luminal-essential, and PIK3CA mutations cause BET-I resistance. A) Box plot showing BRD4 dropout in each line, by subtype. B) BRD4 siRNAs confirm pooled screen results. Averages are maximum percent inhibition (p=0.005, Student’s t-test). C) Effect of JQ1 on breast cancer lines. Table (inset) shows number of lines, grouped by JQ1 sensitivity (NS=non-sensitive, S=sensitive) and PIK3CA status (mut=mutated, wt=wild-type). Red shading shows lines with PIK3CA mutations. Mutant lines were more likely to be JQ1-resistant (p < 4.7×10⁻⁴, chi-square test). Sensitive lines have GI50 < 750nM. *Lines with PTEN mutation/homozygous deletion. D) WT or mutant PIK3CA (H1047R) render JQ1-sensitive SkBr3 line resistant to JQ1. Inset: Immunoblot showing expression of PIK3CA-p110α. Arrow indicates the specific band. E) JQ1 cooperates with PIK3CA (A66; 1 μM), but not with PIK3CB (TGX; 1μM) inhibitors to decrease MCF7 and T47D proliferation. “0” JQ1 represents A66 or TGX alone. F) JQ1 cooperates with mTOR inhibitors (Rapamycin; 0.5nM, Torin; 50nM) to decrease MCF7 proliferation. “0” represents Rapamycin or Torin alone. G) JQ1 and Everolimus cooperatively inhibit xenograft growth. MCF7 cells (2 × 10⁶) were injected into mammary fat pads of athymic nude mice bearing a slow release estrogen pellet. When tumors were 5×5mm (~21 days), mice were grouped into: 1) control, 2) JQ1 (50mg/kg/day IP), 3) Everolimus (5mg/kg/day by gavage), and 4) JQ1+Everolimus daily. Tumors were measured with calipers every 3–4 days. p value: 1-sided Student’s t-test. Also see Figure S7.

References

    1. Banerji S, Cibulskis K, Rangel-Escareno C, Brown KK, Carter SL, Frederick AM, Lawrence MS, Sivachenko AY, Sougnez C, Zou L, et al. Sequence analysis of mutations and translocations across breast cancer subtypes. Nature. 2012;486:405–409. - PMC - PubMed
    1. Barbie DA, Tamayo P, Boehm JS, Kim SY, Moody SE, Dunn IF, Schinzel AC, Sandy P, Meylan E, Scholl C, et al. Systematic RNA interference reveals that oncogenic KRAS-driven cancers require TBK1. Nature. 2009;462:108–112. - PMC - PubMed
    1. Bosher JM, Williams T, Hurst HC. The developmentally regulated transcription factor AP-2 is involved in c-erbB-2 overexpression in human mammary carcinoma. Proceedings of the National Academy of Sciences of the United States of America. 1995;92:744–747. - PMC - PubMed
    1. Buchwalter G, Hickey MM, Cromer A, Selfors LM, Gunawardane RN, Frishman J, Jeselsohn R, Lim E, Chi D, Fu X, et al. PDEF promotes luminal differentiation and acts as a survival factor for ER-positive breast cancer cells. Cancer cell. 2013;23:753–767. - PMC - PubMed
    1. Cheung HW, Cowley GS, Weir BA, Boehm JS, Rusin S, Scott JA, East A, Ali LD, Lizotte PH, Wong TC, et al. Systematic investigation of genetic vulnerabilities across cancer cell lines reveals lineage-specific dependencies in ovarian cancer. Proc Natl Acad Sci U S A. 2011;108:12372–12377. - PMC - PubMed

Publication types