

mTORC2 sustains thermogenesis via Akt-induced glucose uptake and glycolysis in brown adipose tissue
- PMID: 26772600
- PMCID: PMC4772955
- DOI: 10.15252/emmm.201505610
mTORC2 sustains thermogenesis via Akt-induced glucose uptake and glycolysis in brown adipose tissue
Abstract
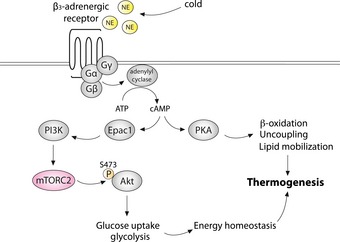
Activation of non-shivering thermogenesis (NST) in brown adipose tissue (BAT) has been proposed as an anti-obesity treatment. Moreover, cold-induced glucose uptake could normalize blood glucose levels in insulin-resistant patients. It is therefore important to identify novel regulators of NST and cold-induced glucose uptake. Mammalian target of rapamycin complex 2 (mTORC2) mediates insulin-stimulated glucose uptake in metabolic tissues, but its role in NST is unknown. We show that mTORC2 is activated in brown adipocytes upon β-adrenergic stimulation. Furthermore, mice lacking mTORC2 specifically in adipose tissue (AdRiKO mice) are hypothermic, display increased sensitivity to cold, and show impaired cold-induced glucose uptake and glycolysis. Restoration of glucose uptake in BAT by overexpression of hexokinase II or activated Akt2 was sufficient to increase body temperature and improve cold tolerance in AdRiKO mice. Thus, mTORC2 in BAT mediates temperature homeostasis via regulation of cold-induced glucose uptake. Our findings demonstrate the importance of glucose metabolism in temperature regulation.
Keywords: brown adipose tissue; glucose uptake; mTORC2; thermogenesis.
© 2016 The Authors. Published under the terms of the CC BY 4.0 license.
Figures
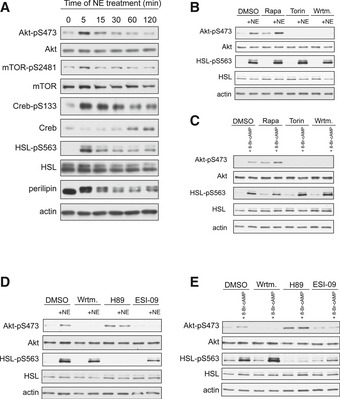
Immunoblot analysis of
BAT cells stimulated with norepinephrine (NE ) for the indicated proteins.Immunoblot analysis of
BAT cells stimulated withNE for 5 min in the presence of rapamycin (Rapa), Torin, or wortmannin (Wrtm) for the indicated proteins.Immunoblot analysis of
BAT cells stimulated with 8‐Br‐cAMP for 5 min in the presence of Rapa, Torin, or Wrtm for the indicated proteins.Immunoblot analysis of
BAT cells stimulated withNE for 5 min in the presence of Wrtm, H89, orESI ‐09 for the indicated proteins.Immunoblot analysis of
BAT cells stimulated with 8‐Br‐cAMP for 5 min in the presence of Wrtm, H89, orESI ‐09 for the indicated proteins.
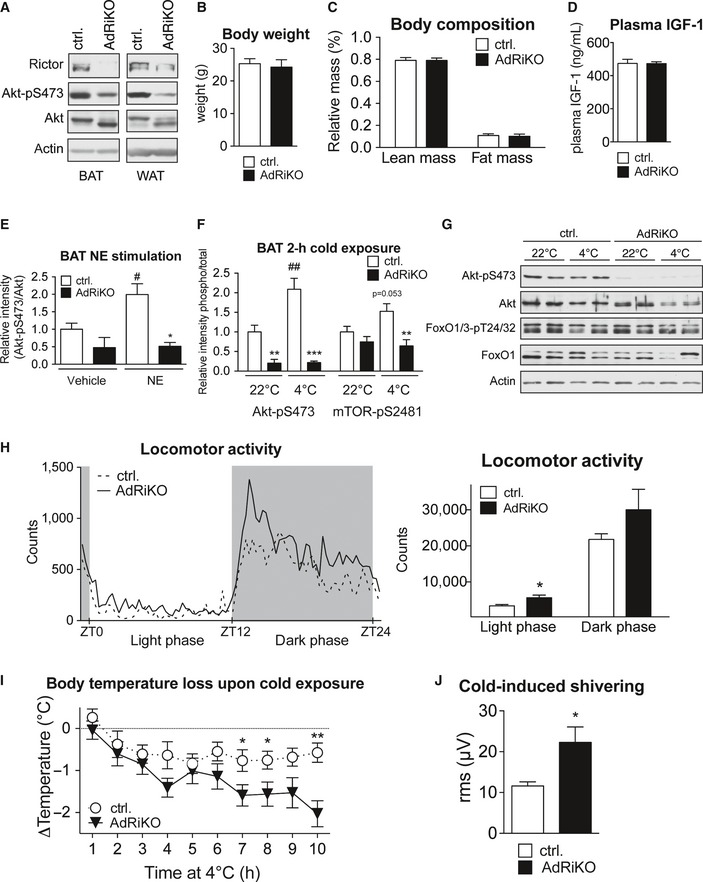
Immunoblot analysis of
BAT andsWAT of AdRiKO and control mice housed at 22°C for the indicated proteins.Body weight of AdRi
KO and control mice housed at 22°C [n = 14 (control), n = 12 (AdRiKO )].Body composition of AdRi
KO and control mice housed at 22°C (n = 18/group).Plasma
IGF ‐1 levels in AdRiKO and control mice housed at 22°C [n = 11 (control), n = 9 (AdRiKO )].Quantification of Akt‐
pS 473 band intensity relative to total Akt band intensity shown in Fig 2B (n = 3/group).Quantification of Akt‐
pS 473 andmTOR ‐pS 2481 band intensity relative to total Akt or totalmTOR band intensity shown in Fig 2C (n = 6/group).Immunoblot analysis of
sWAT of AdRiKO and control mice housed at 22 or 4°C for 2 h for the indicated proteins (n = 6/group, each lane represents a mix of 3 mice).Locomotor activity of AdRi
KO and control mice housed at 22°C (n = 13/group).Body temperature loss of AdRi
KO and control mice upon cold exposure with ad libitum access to food [n = 11 (control), n = 10 (AdRiKO )].Cold‐induced shivering of AdRi
KO and control mice housed at 4°C for 4 h (n = 6/group).
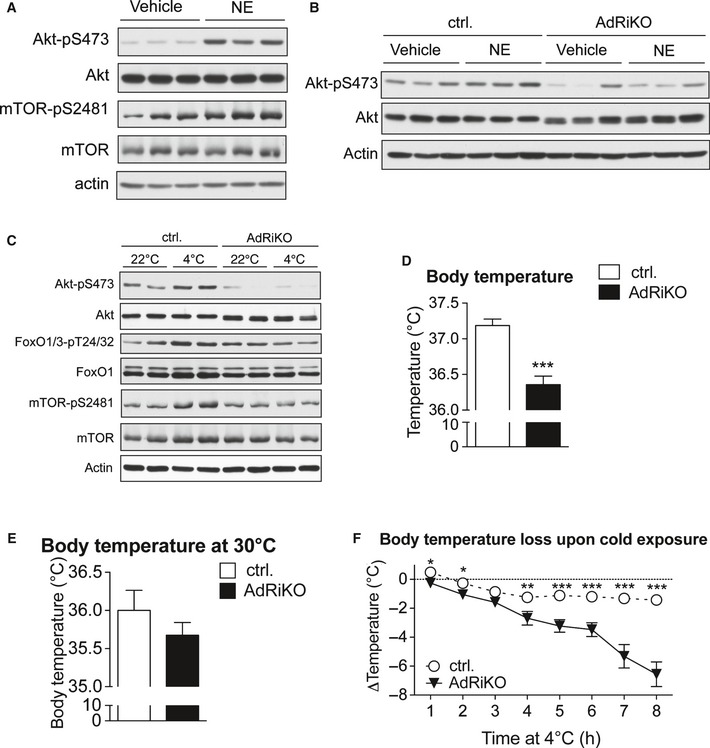
Immunoblot analysis of
BAT from control mice treated with either norepinephrine (NE ) or vehicle for 30 min for the indicated proteins (n = 3/group).Immunoblot analysis of
BAT from AdRiKO and control mice treated with either norepinephrine (NE ) or vehicle for 30 min for the indicated proteins (n = 3/group).Immunoblot analysis of
BAT from AdRiKO and control mice housed at either 22 or 4°C for 2 h for the indicated proteins (n = 6/group, each lane represents a mix of 3 mice).Body temperature of AdRi
KO and control mice housed at 22°C [n = 11 (control), n = 9 (AdRiKO )].Body temperature of AdRi
KO and control mice housed at 30°C for 2 weeks (n = 8/group).Body temperature loss upon cold exposure of AdRi
KO and control mice [n = 20 (control), n = 17 (AdRiKO )].
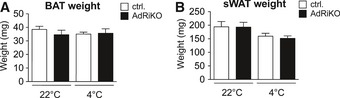
BAT weight of AdRiKO and control mice housed at 22 or 4°C for 8 h (n = 6/group). Data represent mean ±SEM .sWAT weight of AdRiKO and control mice housed at 22 or 4°C for 8 h (n = 6/group). Data represent mean ± SEM.
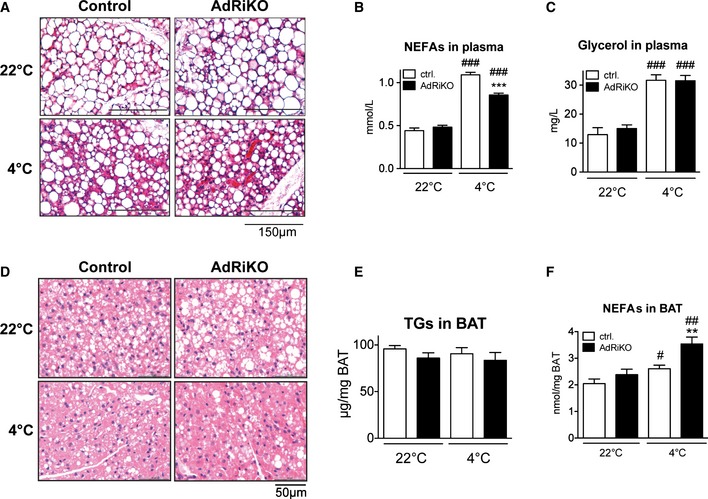
Representative H&E staining of
sWAT sections from AdRiKO and control mice (n = 5/group).Non‐esterified fatty acids (
NEFA s) in plasma of AdRiKO and control mice (n = 6/group).Glycerol in plasma of AdRi
KO and control mice (n = 6/group).Representative H&E staining of
BAT sections from AdRiKO and control mice (n = 5/group).Triglycerides (
TG s) inBAT of AdRiKO and control mice housed at 22 or 4°C for 8 h (n = 6/group).NEFA s inBAT of AdRiKO and control mice (n = 6/group).
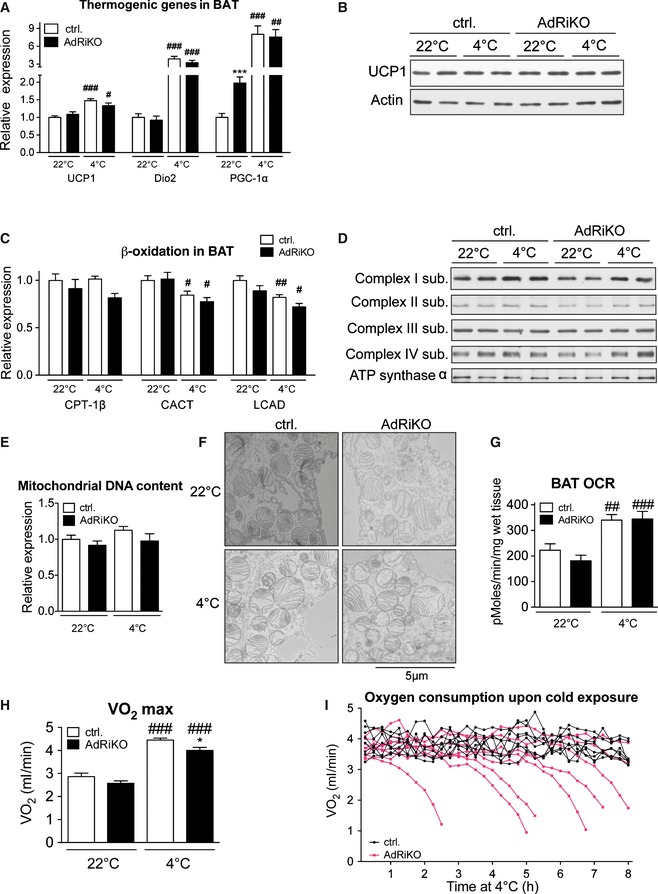
mRNA levels of the indicated genes inBAT of AdRiKO and control mice housed at 22 or at 4°C for 8 h (n = 6/group).Immunoblot analysis of
BAT from AdRiKO and control mice housed at 22 or at 4°C for 8 h for the indicated proteins (n = 6/group, each lane represents a mix of 3 mice).mRNA levels of the indicated genes inBAT of AdRiKO and control mice housed at 22 or at 4°C for 8 h (n = 6).Immunoblot analysis of
BAT from AdRiKO and control mice housed at 22 or at 4°C for 8 h for the indicated proteins (n = 6/group, each lane represents a mix of 3 mice).Mitochondrial
DNA content ofBAT from AdRiKO and control mice housed at 22 or at 4°C for 8 h (n = 6/group).Representative electron micrographs of
BAT from AdRiKO and control mice housed at 22 or at 4°C for 4 h (n = 3/group).Oxygen consumption rate (
OCR ) ofBAT explants from AdRiKO and control mice housed at 22 or at 4°C for 4 h (n = 7/group).Maximal respiration (
VO 2 max) of AdRiKO and control mice housed at 22 or at 4°C for 8 h [n = 9 (control 22°C), n = 7 (AdRiKO 22°C), n = 8 (control 4°C), n = 8 (AdRiKO 4°C)].Respiration (
VO 2) of AdRiKO and control mice upon cold exposure (n = 8/group).
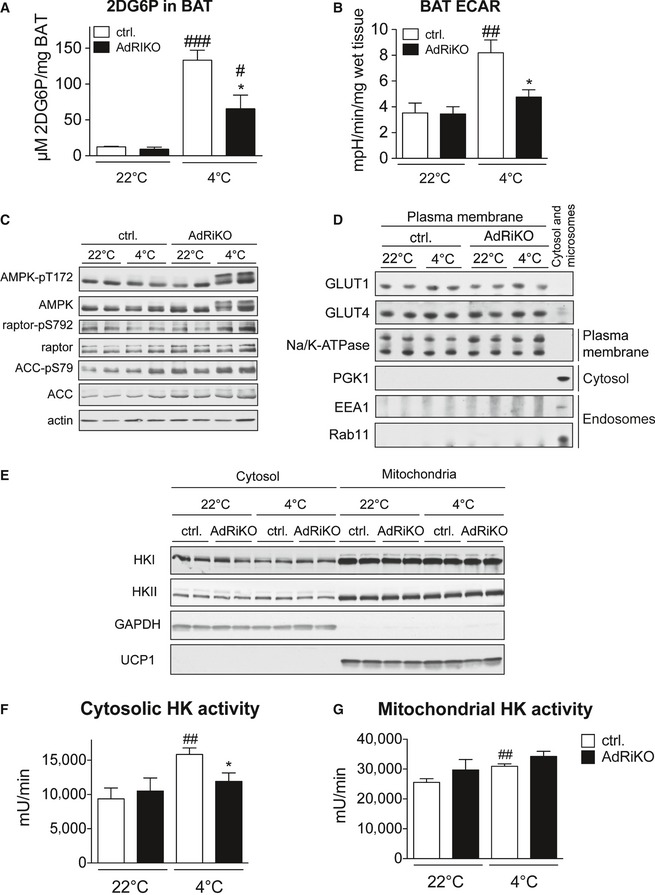
2‐deoxyglucose‐6‐phosphate (2
DG 6P) accumulation inBAT of AdRiKO and control mice housed at 22 or at 4°C for 4 h (n = 6/group).Extracellular acidification rate (
ECAR ) ofBAT explants from AdRiKO and control mice housed at 22 or at 4°C for 4 h (n = 7/group).Immunoblot analysis of
BAT from AdRiKO and control mice housed at 22 or at 4°C for 8 h for the indicated proteins (n = 6/group, each lane represents a mix of 3 mice).Immunoblot analysis of isolated plasma membranes from
BAT of AdRiKO and control mice housed at 22 or at 4°C for 8 h for the indicated proteins (n = 6/group, each lane represents a mix of 3 mice).Immunoblot analysis of mitochondrial and cytosolic fractions from
BAT of AdRiKO and control mice housed at 22 or at 4°C for 4 h for the indicated proteins (n = 6/group, each lane represents a mix of 3 mice).Cytosolic hexokinase activity in
BAT of AdRiKO and control mice housed at 22 or at 4°C for 4 h [n = 5 (control 22°C), n = 5 (AdRiKO 22°C), n = 7 (control 4°C), n = 7 (AdRiKO 4°C)].Mitochondrial hexokinase activity in
BAT of AdRiKO and control mice housed at 22 or at 4°C for 4 h [n = 5 (control 22°C), n = 5 (AdRiKO 22°C), n = 7 (control 4°C), n = 7 (AdRiKO 4°C)].
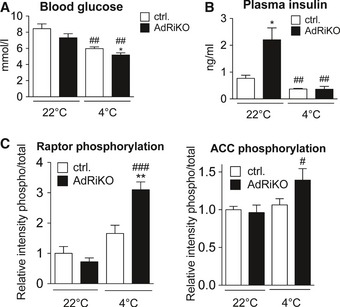
Blood glucose of AdRi
KO and control mice housed at 22 or 4°C for 8 h (n = 7/group).Plasma insulin of AdRi
KO and control mice housed at 22 or 4°C for 8 h (n = 6/group).Quantification of raptor‐
pS 792 andACC ‐pS 79 band intensity relative to total raptor or totalACC band intensity shown in Fig 5C (n = 6/group).
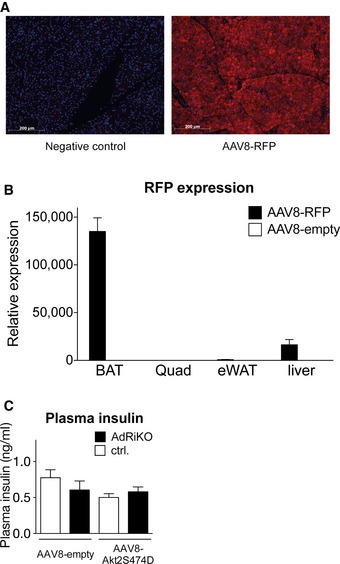
Representative immunostainings for
RFP ofBAT from control mice infected with eitherAAV 8‐RFP orAAV 8‐empty (n = 4/group).RFP mRNA expression inBAT , liver, quadriceps, andWAT of control mice infected with eitherAAV 8‐RFP orAAV 8‐empty (n = 4/group).Plasma insulin of AdRi
KO and control mice infected with eitherAAV 8‐Akt2S474D orAAV 8‐empty housed at 4°C for 4 h [n = 7 (controlAAV 8‐null), n = 6 (AdRiKO AAV 8‐null), n = 6 (controlAAV 8‐AktS474D), n = 6 (AdRiKO AAV 8‐AktS474D)].
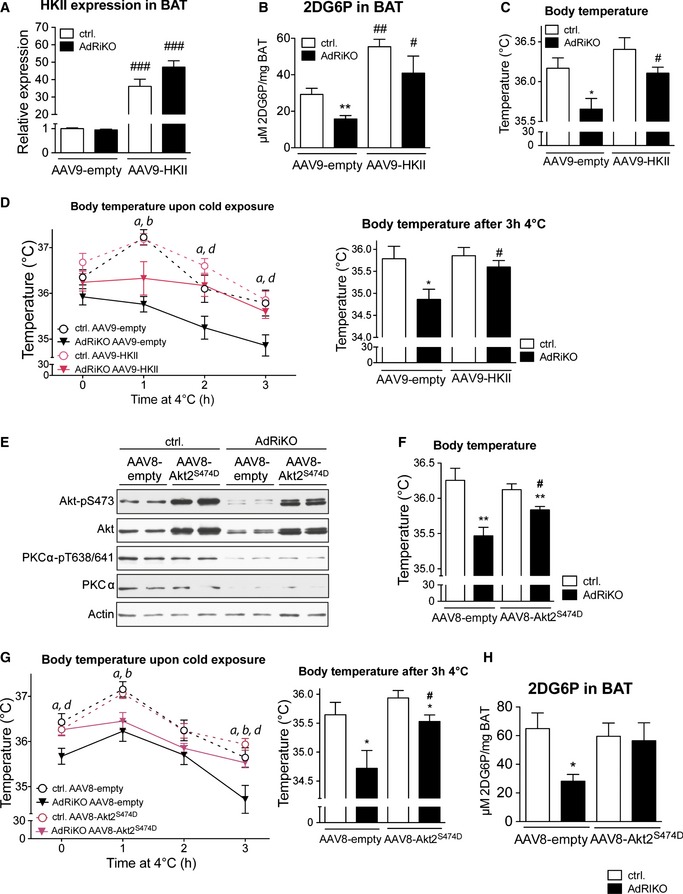
HKII mRNA expression level inBAT of AdRiKO and control mice infected with eitherAAV 9‐HKII orAAV 9‐empty (n = 8/group).Cold‐induced 2‐deoxyglucose‐6‐phosphate (2
DG 6P) accumulation inBAT of AdRiKO and control mice infected with eitherAAV 9‐HKII orAAV 9‐empty housed at 4°C for 4 h (n = 8/group).Body temperature of AdRi
KO and control mice infected with eitherAAV 9‐HKII orAAV 9‐empty housed at 22°C (n = 8/group).Body temperature upon cold exposure of AdRi
KO and control mice infected with eitherAAV 9‐HKII orAAV 9‐empty. The left panel represents body temperature after each hour of cold exposure, while the right panel represents body temperature as a bar graph for the 3‐h cold exposure time point (n = 8/group). a: significant difference between AdRiKO and control mice infected withAAV 9‐empty; b: significant difference between AdRiKO and control mice infected withAAV 9‐HKII ; d: significant difference between AdRiKO mice infected withAAV 9‐empty andAAV 9‐HKII .Immunoblot analysis of
BAT from AdRiKO and control mice infected with eitherAAV 8‐Akt2S474D orAAV 8‐empty (n = 6/group, each lane represents a mix of 3 mice).Body temperature of AdRi
KO and control mice infected with eitherAAV 8‐Akt2S474D orAAV 8‐empty housed at 22°C (n = 11/group).Body temperature upon cold exposure of AdRi
KO and control mice infected with eitherAAV 8‐Akt2S474D orAAV 8‐empty. The left panel represents body temperature after each hour of cold exposure, while the right panel represents body temperature as a bar graph for the 3‐h cold exposure time point (n = 11/group). a: significant difference between AdRiKO and control mice infected withAAV 8‐empty; b: significant difference between AdRiKO and control mice infected withAAV 8‐Akt2S474D; d: significant difference between AdRiKO mice infected withAAV 8‐empty andAAV 8‐Akt2S474D.Cold‐induced 2‐deoxyglucose‐6‐phosphate (2
DG 6P) accumulation inBAT of AdRiKO and control mice infected with eitherAAV 8‐Akt2S474D orAAV 8‐empty housed at 4°C for 4 h [n = 7 (controlAAV 8‐null), n = 6 (AdRiKO AAV 8‐null), n = 6 (controlAAV 8‐AktS474D), n = 6 (AdRiKO AAV 8‐AktS474D)].
References
-
- Albert V, Hall MN (2014) mTOR signaling in cellular and organismal energetics. Curr Opin Cell Biol 33C: 55–66 - PubMed
-
- Cannon B, Nedergaard J (2004) Brown adipose tissue: function and physiological significance. Physiol Rev 84: 277–359 - PubMed
-
- Clapham JC, Arch JR (2011) Targeting thermogenesis and related pathways in anti‐obesity drug discovery. Pharmacol Ther 131: 295–308 - PubMed
Publication types
MeSH terms
Substances
Grants and funding
LinkOut - more resources
Full Text Sources
Other Literature Sources
Molecular Biology Databases
Miscellaneous
