. 2016 Jan 15;30(2):220-32.
doi: 10.1101/gad.270439.115.

Combined deletion of cathepsin protease family members reveals compensatory mechanisms in cancer

Affiliations

Combined deletion of cathepsin protease family members reveals compensatory mechanisms in cancer

Leila Akkari et al. Genes Dev. .

Abstract

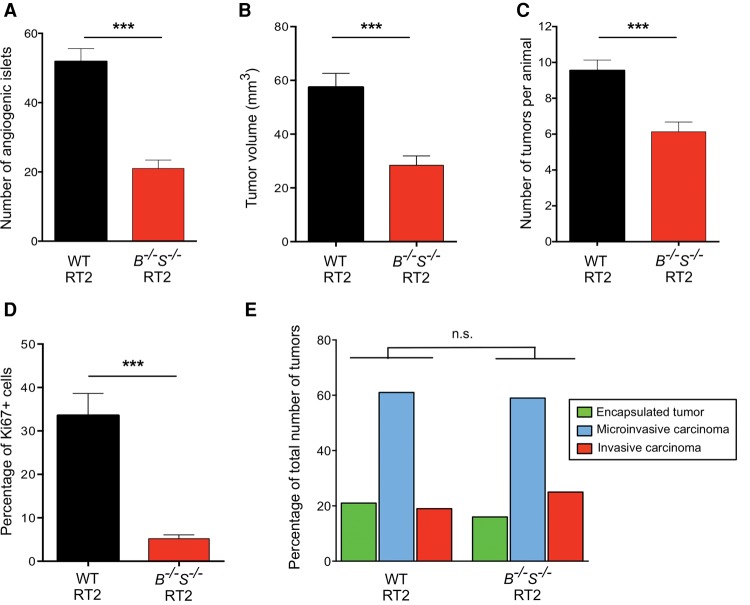
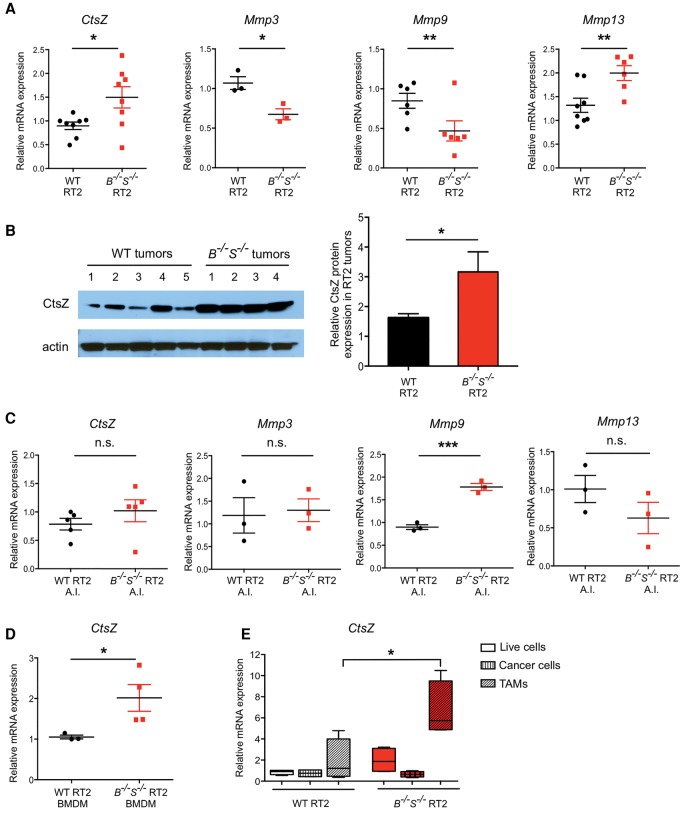
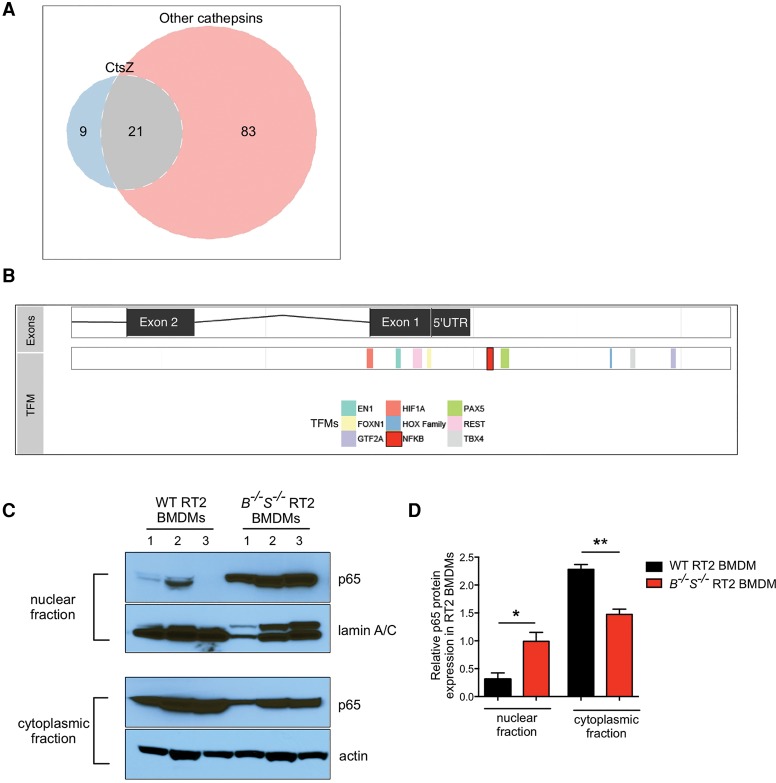
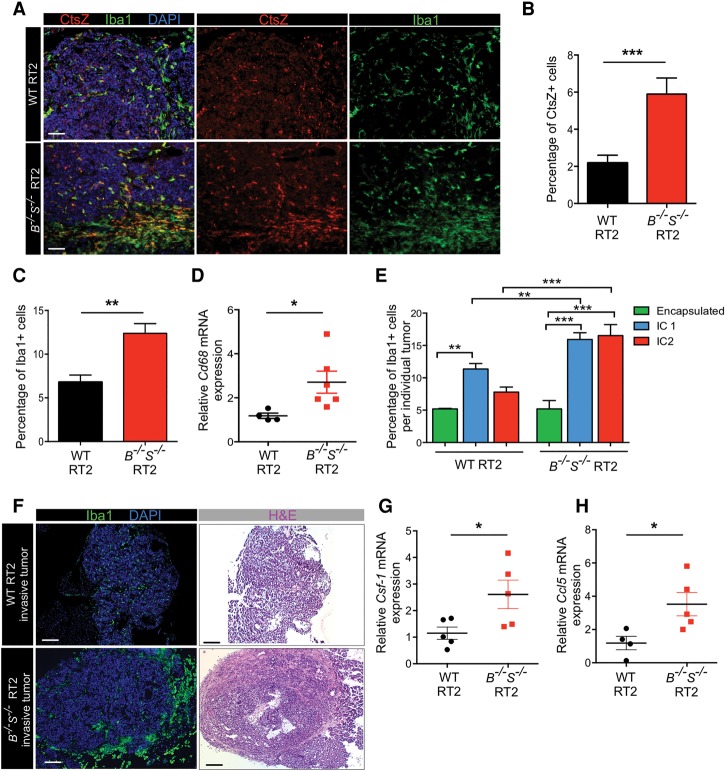
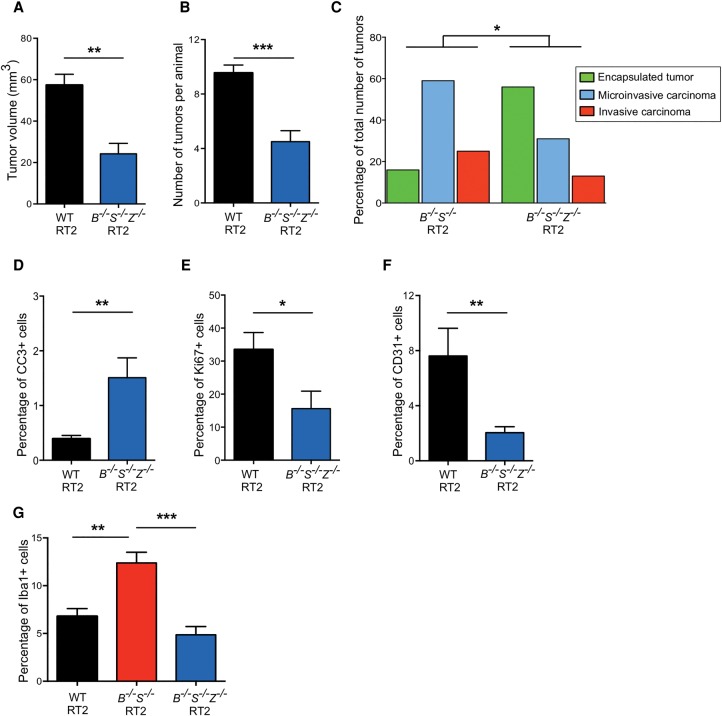
Proteases are important for regulating multiple tumorigenic processes, including angiogenesis, tumor growth, and invasion. Elevated protease expression is associated with poor patient prognosis across numerous tumor types. Several multigene protease families have been implicated in cancer, including cysteine cathepsins. However, whether individual family members have unique roles or are functionally redundant remains poorly understood. Here we demonstrate stage-dependent effects of simultaneously deleting cathepsin B (CtsB) and CtsS in a murine pancreatic neuroendocrine tumor model. Early in tumorigenesis, the double knockout results in an additive reduction in angiogenic switching, whereas at late stages, several tumorigenic phenotypes are unexpectedly restored to wild-type levels. We identified CtsZ, which is predominantly supplied by tumor-associated macrophages, as the compensatory protease that regulates the acquired tumor-promoting functions of lesions deficient in both CtsB and CtsS. Thus, deletion of multiple cathepsins can lead to stage-dependent, compensatory mechanisms in the tumor microenvironment, which has potential implications for the clinical consideration of selective versus pan-family cathepsin inhibitors in cancer.

Keywords: invasion; macrophage; tumor microenvironment.


Figures

Figure 1.
Figure 1.
Simultaneous deletion of CtsB and CtsS reduces angiogenic switching and tumor growth but does not affect tumor invasion. (A) Angiogenic switching was assessed in 10.5-wk-old wild-type RT2 or CtsB−/−S−/− RT2 mice (n = 10 mice for both genotypes) by manually counting the number of angiogenic islets in the pancreas. The graph shows the average number of angiogenic islets per mouse. (B) Cumulative tumor volume, represented as the sum of the volumes of all tumors per mouse, was calculated for 13.5-wk-old wild-type RT2 (n = 57) and CtsB−/−S−/− RT2 (n = 46) mice. (C) Graph depicting the average number of tumors per mouse in wild-type and CtsB−/−S−/− RT2 animals at the 13.5-wk endpoint. The following numbers of animals were analyzed per group: wild-type RT2, n = 52; CtsB−/−S−/− RT2, n = 37. (D) Quantitation of Ki67+ cells in wild-type and CtsB−/−S−/− RT2 tumors relative to the total number of DAPI+ cells showed an 85% decrease in cell proliferation in tumors deficient for both CtsB and CtsS. All tumors from five wild-type RT2 and 11 CtsB−/−S−/− RT2 mice were analyzed. (E) Graph showing the proportions of encapsulated, microinvasive (IC1), and invasive (IC2) carcinomas in wild-type RT2 and CtsB−/−S−/− RT2 mice at 13.5 wk. The following numbers of samples were analyzed: wild-type RT2, 18 mice, 97 tumors; CtsB−/−S−/− RT2, 14 mice, 68 tumors. The graphs show mean + SEM. Statistical significance was calculated by unpaired two-tailed Student's t-test (AD) or using a cumulative logit model with generalized estimating equations to correct for correlations within individual mice (E). (n.s.) Nonsignificant; (***) P < 0.001.
Figure 2.
Figure 2.
Analysis of protease gene expression in CtsB−/−S−/− RT2 tumors identifies macrophage-derived CtsZ as a potential compensatory factor. (A) The mRNA expression level of CtsZ, Mmp3, Mmp9, and Mmp13 was determined by quantitative PCR (qPCR) in wild-type RT2 and CtsB−/−S−/− RT2 whole tumors (end-stage, 13.5 wk). This analysis demonstrated increased expression of CtsZ and Mmp13 and decreased Mmp3 and Mmp9 expression in the CtsB−/−S−/− RT2 tumors. Three to nine independent tumors per genotype were used for analysis. (B) Representative protein extracts from wild-type RT2 tumors (n = 5) and CtsB−/−S−/− RT2 tumors (n = 4), at 13.5 wk, were analyzed for CtsZ expression. Actin served as a loading control. Quantification of CtsZ normalized to the loading control using ImageJ software showed a significant increase in protein expression in CtsB−/−S−/− RT2 tumors. n = 7 replicate experiments and 31 independent tumors. (C) mRNA expression level of CtsZ, Mmp3, Mmp9, and Mmp13 was determined by qPCR in premalignant angiogenic islets (A.I.) from wild-type RT2 and CtsB−/−S−/− RT2 mice at 10.5 wk of age. No significant changes in expression of CtsZ, Mmp3, or Mmp13 were observed at this early stage of tumorigenesis, while Mmp9 expression was increased. Three to five independent sets of pooled angiogenic islets per genotype. (D) mRNA expression level of CtsZ was determined by qPCR analysis of bone marrow-derived macrophages (BMDMs) prepared from tumor-bearing wild-type RT2 (n = 3) and CtsB−/−S−/− RT2 (n = 4) animals, which revealed a significant increase in CtsZ expression in CtsB−/−S−/− RT2 BMDMs. (E) Tumors from wild-type RT2 or CtsB−/−S−/− RT2 mice were sorted into a mixed population of live cells (DAPI), cancer cells (CD45 CD31 F4/80) or TAMs (CD45+ CD31 F4/80+). Expression of CtsZ mRNA was determined by qPCR, and the level is depicted relative to the live-cell fraction. Up-regulation of CtsZ expression was found specifically in the TAM compartment and not in cancer cells. mRNA expression determined by qPCR was normalized to Ubiquitin C for each sample in A and C–E. Graphs show mean ± SEM. Statistical significance was calculated by unpaired two-tailed Student's t-test. (n.s.) Nonsignificant; (*) P < 0.05; (**) P < 0.01; (***) P < 0.001.
Figure 3.
Figure 3.
Analysis of TFMs in the CtsZ promoter reveals a unique NFκB motif and elevated nuclear p65 levels in CtsB−/−S−/− RT2 macrophages. (A) Venn diagram demonstrating the overlap of predicted TFMs present in the CtsZ promoter compared with the CtsB, CtsC, CtsH, CtsL, and CtsS promoters. There are nine TFMs present in the CtsZ promoter that were not identified in any of these other cathepsin family members. Meanwhile, 83 TFMs were present in at least one of the other cathepsins but absent in the CtsZ promoter (see Supplemental Table 1 for a full list of TFMs). (B) The CtsZ promoter is shown with exons and the 5′ untranslated region (UTR) on the top bar and nine TFMs listed below. An NFκB consensus site is highlighted in red upstream of the 5′ UTR. (C) Wild-type RT2 or CtsB−/−S−/− RT2 BMDMs were subjected to subcellular fractionation, and lysates of the nuclear fraction (top two panels) or cytoplasmic fraction (bottom two panels) were isolated for immunoblotting of the NFκB subunit p65 and lamin A/C or p65 and actin. Results are representative of n = 3 independent biological replicates. (D) Quantification of p65—normalized to lamin A/C or actin for the nuclear and cytoplasmic fractions, respectively, using ImageJ software—showed a significant increase in p65 expression in the nucleus of CtsB−/−S−/− RT2 BMDMs. n = 3 replicate experiments. Statistical significance was calculated by unpaired two-tailed Student's t-test. (*) P < 0.05; (**) P < 0.01.
Figure 4.
Figure 4.
Macrophages expressing high levels of CtsZ infiltrate CtsB−/−S−/− tumors. (A) CtsZ is highly expressed in CtsB−/−S−/− RT2 tumors, and these tumors also show elevated macrophage numbers. Antibodies against CtsZ (red) and Iba1, a macrophage-specific marker (green), were used to identify cells expressing CtsZ and the presence of TAMs in wild-type RT2 and CtsB−/−S−/− RT2 tumors. CtsZ+ macrophages are particularly concentrated in the invasive edge of CtsB−/−S−/− RT2 tumors (evident in the lower images in the bottom panels). (B) Quantification of CtsZ+ cells in wild-type RT2 (n = 62) and CtsB−/−S−/− RT2 (n = 33) tumors relative to the total number of DAPI+ cells showed a significant increase in CtsB−/−S−/− RT2 tumors. (C) Quantification of Iba+ TAMs in wild-type RT2 (n = 108) and CtsB−/−S−/− RT2 (n = 28) tumors relative to the total number of DAPI+ cells showed a significant increase in TAMs in CtsB−/−S−/− RT2 tumors. (D) mRNA expression of the macrophage marker Cd68 was determined by qPCR analysis of wild-type RT2 (n = 4) and CtsB−/−S−/− RT2 (n = 6) whole tumors and revealed a significant increase in expression in CtsB−/−S−/− RT2 mice, consistent with the results in C. (E) Graph showing the macrophage content within and at the margin of individual tumors from wild-type RT2 and CtsB−/−S−/− RT2 mice, as determined by Iba1+ staining and according to each tumor invasive grade: encapsulated, IC1, or IC2 (as specified in Fig. 1E). (F) Low-magnification images of wild-type RT2 and CtsB−/−S−/− RT2 tumors stained with the macrophage-specific marker Iba1 (green) or hematoxylin and eosin (H&E), identifying the accumulation of TAMs at the margin of invasive CtsB−/−S−/− tumors compared with wild-type invasive tumors. (G,H) mRNA expression of the chemoattractants Csf-1 (G) and Ccl5 (H) was determined by qPCR analysis of wild-type RT2 (n = 4–5) and CtsB−/−S−/− RT2 (n = 5) whole tumors, which revealed a significant increase in expression of both genes in CtsB−/−S−/− RT2 mice. mRNA expression determined by qPCR was normalized to Ubiquitin C for each sample in D, G, and H. The graphs show mean ± SEM. Statistical significance was calculated by unpaired two-tailed Student's t-test. (*) P < 0.05; (**) P < 0.01; (***) P < 0.001. Bars: A, 50 µm; F, 200 µm.
Figure 5.
Figure 5.
Deletion of CtsZ in CtsB−/−S−/− RT2 animals reduces macrophage infiltration and tumor invasion. (A) Graph depicting the cumulative tumor burden, represented as the sum of the volumes of all tumors per mouse, in wild-type RT2 and CtsB−/−S−/−Z−/− RT2 animals at the 13.5-wk endpoint. Numbers of mice per group were as follows: wild-type RT2, n = 57; CtsB−/−S−/−Z−/− RT2, n = 14. (B) Graph depicting the average number of tumors per mouse in wild-type RT2 and CtsB−/−S−/−Z−/− RT2 animals at 13.5 wk. The following numbers of animals were analyzed per group: wild-type RT2, n = 58; CtsB−/−S−/−Z−/− RT2, n = 18. (C) Graph showing the proportions of encapsulated, microinvasive, and invasive carcinomas in CtsB−/−S−/− RT2 and CtsB−/−S−/−Z−/− RT2 mice at 13.5 wk. The following number of mice were analyzed: CtsB−/−S−/− RT2, 14 mice, 68 tumors; CtsB−/−S−/−Z−/− RT2, 13 mice, 32 tumors. (D) Quantitation of cleaved caspase-3 (CC3) staining in wild-type RT2 and CtsB−/−S−/−Z−/− RT2 tumors relative to the total number of DAPI+ cells revealed a significant 3.6-fold increase in apoptosis in tumors deficient for CtsB, CtsS, and CtsZ. Tumors from 11 wild-type RT2 and seven CtsB−/−S−/−Z−/− RT2 mice were analyzed. (E) Quantitation of Ki67 staining in wild-type RT2 (n = 5) and CtsB−/−S−/−Z−/− RT2 (n = 7) tumors relative to the total number of DAPI+ cells. This revealed a 53% decrease in cell proliferation in tumors simultaneously deficient for CtsB, CtsS, and CtsZ. (F) Quantification of CD31+ endothelial cells in wild-type RT2 (n = 4) and CtsB−/−S−/−Z−/− RT2 (n = 10) tumors relative to the total number of DAPI+ cells, as determined by immunostaining of tissue sections. This analysis revealed a significant decrease in tumor vascularization in CtsB−/−S−/−Z−/− RT2 mice. (G) Quantification of Iba+ macrophages in wild-type RT2 (n = 108), CtsB−/−S−/− RT2 (n = 28), and CtsB−/−S−/−Z−/− RT2 (n = 14) tumors relative to the total number of DAPI+ cells. This analysis revealed that the increase in TAM numbers observed in CtsB−/−S−/− RT2 tumors is reversed when CtsZ is deleted in these tumors.

References

    1. Affara NI, Andreu P, Coussens LM. 2009. Delineating protease functions during cancer development. Methods Mol Biol 539: 1–32. - PubMed
    1. Akkari L, Gocheva V, Kester JC, Hunter KE, Quick ML, Sevenich L, Wang HW, Peters C, Tang LH, Klimstra DS, et al. 2014. Distinct functions of macrophage-derived and cancer cell-derived cathepsin Z combine to promote tumor malignancy via interactions with the extracellular matrix. Genes Dev 28: 2134–2150. - PMC - PubMed
    1. auf dem Keller U, Doucet A, Overall CM. 2007. Protease research in the era of systems biology. Biol Chem 388: 1159–1162. - PubMed
    1. Ben-Baruch A. 2006. The multifaceted roles of chemokines in malignancy. Cancer Metastasis Rev 25: 357–371. - PubMed
    1. Benavides F, Perez C, Blando J, Contreras O, Shen J, Coussens LM, Fischer SM, Kusewitt DF, DiGiovanni J, Conti CJ. 2012. Protective role of cathepsin L in mouse skin carcinogenesis. Mol Carcinog 51: 352–361. - PMC - PubMed

Publication types

MeSH terms

LinkOut - more resources