

Integration of multi-omics data of a genome-reduced bacterium: Prevalence of post-transcriptional regulation and its correlation with protein abundances
- PMID: 26773059
- PMCID: PMC4756857
- DOI: 10.1093/nar/gkw004
Integration of multi-omics data of a genome-reduced bacterium: Prevalence of post-transcriptional regulation and its correlation with protein abundances
Abstract
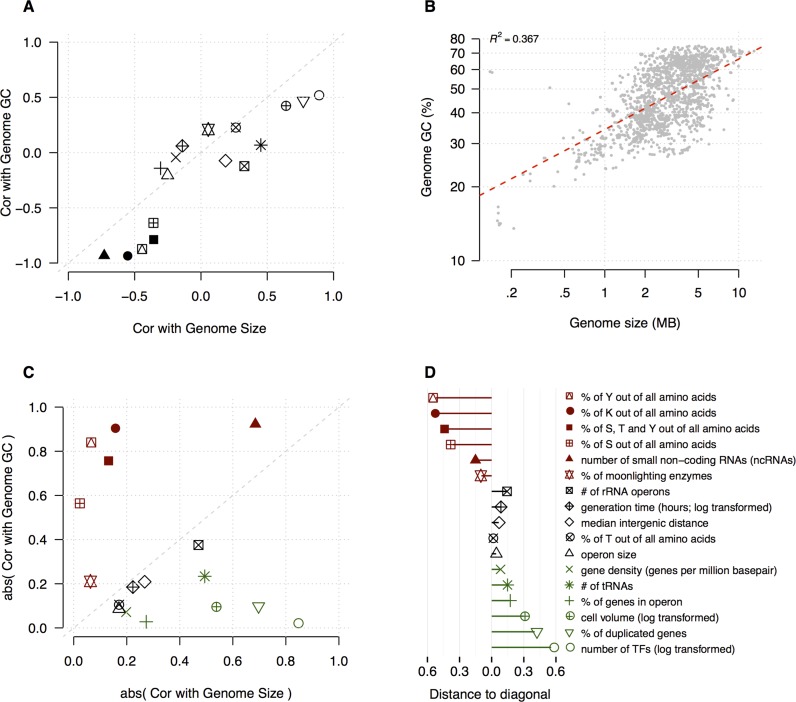
We developed a comprehensive resource for the genome-reduced bacterium Mycoplasma pneumoniae comprising 1748 consistently generated '-omics' data sets, and used it to quantify the power of antisense non-coding RNAs (ncRNAs), lysine acetylation, and protein phosphorylation in predicting protein abundance (11%, 24% and 8%, respectively). These factors taken together are four times more predictive of the proteome abundance than of mRNA abundance. In bacteria, post-translational modifications (PTMs) and ncRNA transcription were both found to increase with decreasing genomic GC-content and genome size. Thus, the evolutionary forces constraining genome size and GC-content modify the relative contributions of the different regulatory layers to proteome homeostasis, and impact more genomic and genetic features than previously appreciated. Indeed, these scaling principles will enable us to develop more informed approaches when engineering minimal synthetic genomes.
© The Author(s) 2016. Published by Oxford University Press on behalf of Nucleic Acids Research.
Figures


Similar articles
-
Quantification of mRNA and protein and integration with protein turnover in a bacterium.Mol Syst Biol. 2011 Jul 19;7:511. doi: 10.1038/msb.2011.38. Mol Syst Biol. 2011. PMID: 21772259 Free PMC article.
-
Transcriptome complexity in a genome-reduced bacterium.Science. 2009 Nov 27;326(5957):1268-71. doi: 10.1126/science.1176951. Science. 2009. PMID: 19965477
-
MyMpn: a database for the systems biology model organism Mycoplasma pneumoniae.Nucleic Acids Res. 2015 Jan;43(Database issue):D618-23. doi: 10.1093/nar/gku1105. Epub 2014 Nov 6. Nucleic Acids Res. 2015. PMID: 25378328 Free PMC article.
-
Proteome of Mycoplasma pneumoniae.Methods Biochem Anal. 2006;49:39-56. Methods Biochem Anal. 2006. PMID: 16929672 Review. No abstract available.
-
The proteome of Mycoplasma pneumoniae, a supposedly "simple" cell.Proteomics. 2011 Sep;11(18):3614-32. doi: 10.1002/pmic.201100076. Epub 2011 Aug 9. Proteomics. 2011. PMID: 21751371 Review.
Cited by
-
Proteomics and integrative omic approaches for understanding host-pathogen interactions and infectious diseases.Mol Syst Biol. 2017 Mar 27;13(3):922. doi: 10.15252/msb.20167062. Mol Syst Biol. 2017. PMID: 28348067 Free PMC article. Review.
-
RNA search engines empower the bacterial intranet.Biochem Soc Trans. 2017 Aug 15;45(4):987-997. doi: 10.1042/BST20160373. Epub 2017 Jul 14. Biochem Soc Trans. 2017. PMID: 28710287 Free PMC article. Review.
-
A comprehensive benchmark of RNA-RNA interaction prediction tools for all domains of life.Bioinformatics. 2017 Apr 1;33(7):988-996. doi: 10.1093/bioinformatics/btw728. Bioinformatics. 2017. PMID: 27993777 Free PMC article.
-
Quantitative essentiality in a reduced genome: a functional, regulatory and structural fitness map.Mol Syst Biol. 2025 Aug 13. doi: 10.1038/s44320-025-00133-1. Online ahead of print. Mol Syst Biol. 2025. PMID: 40804181
-
Repurposing antimycotic ciclopirox olamine as a promising anti-ischemic stroke agent.Acta Pharm Sin B. 2020 Mar;10(3):434-446. doi: 10.1016/j.apsb.2019.08.002. Epub 2019 Aug 14. Acta Pharm Sin B. 2020. PMID: 32140390 Free PMC article.
References
-
- Guell M., van Noort V., Yus E., Chen W.H., Leigh-Bell J., Michalodimitrakis K., Yamada T., Arumugam M., Doerks T., Kuhner S., et al. Transcriptome complexity in a genome-reduced bacterium. Science. 2009;326:1268–1271. - PubMed
-
- Crick F. Central dogma of molecular biology. Nature. 1970;227:561–563. - PubMed
Publication types
MeSH terms
Substances
Grants and funding
LinkOut - more resources
Full Text Sources
Other Literature Sources
Molecular Biology Databases
Miscellaneous
