

Methodological Guidelines for Accurate Detection of Viruses in Wild Plant Species
- PMID: 26773088
- PMCID: PMC4784055
- DOI: 10.1128/AEM.03538-15
Methodological Guidelines for Accurate Detection of Viruses in Wild Plant Species
Abstract
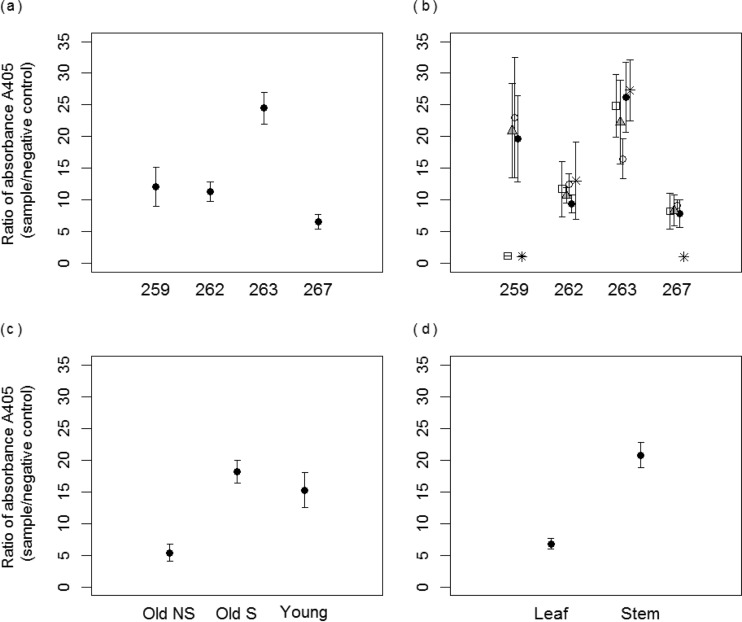
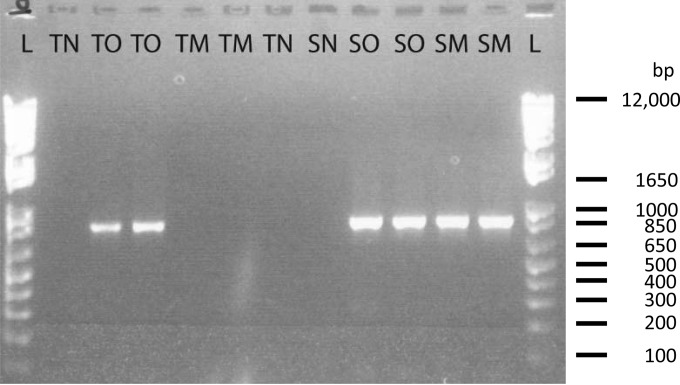
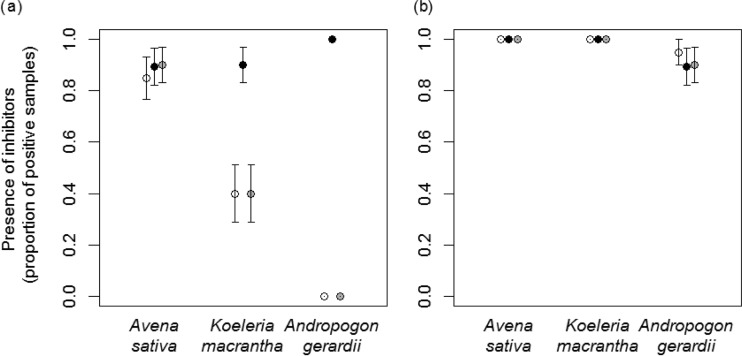
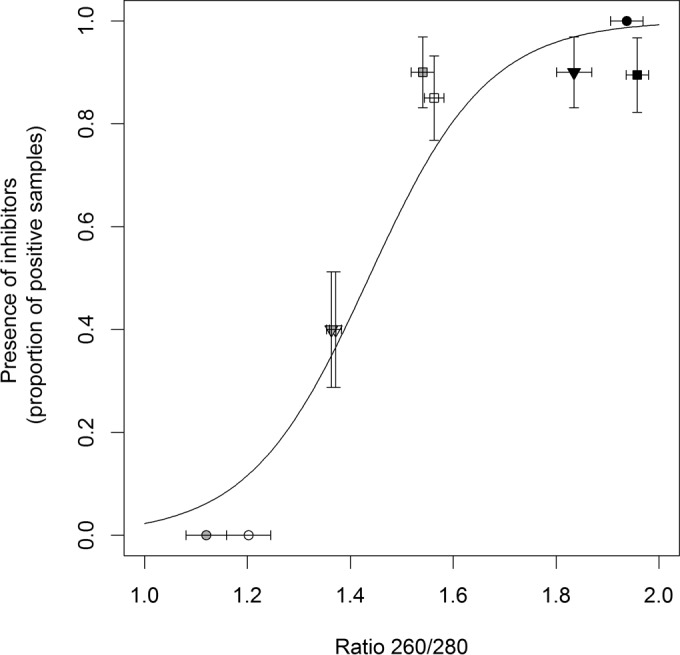
Ecological understanding of disease risk, emergence, and dynamics and of the efficacy of control strategies relies heavily on efficient tools for microorganism identification and characterization. Misdetection, such as the misclassification of infected hosts as healthy, can strongly bias estimates of disease prevalence and lead to inaccurate conclusions. In natural plant ecosystems, interest in assessing microbial dynamics is increasing exponentially, but guidelines for detection of microorganisms in wild plants remain limited, particularly so for plant viruses. To address this gap, we explored issues and solutions associated with virus detection by serological and molecular methods in noncrop plant species as applied to the globally important Barley yellow dwarf virus PAV (Luteoviridae), which infects wild native plants as well as crops. With enzyme-linked immunosorbent assays (ELISA), we demonstrate how virus detection in a perennial wild plant species may be much greater in stems than in leaves, although leaves are most commonly sampled, and may also vary among tillers within an individual, thereby highlighting the importance of designing effective sampling strategies. With reverse transcription-PCR (RT-PCR), we demonstrate how inhibitors in tissues of perennial wild hosts can suppress virus detection but can be overcome with methods and products that improve isolation and amplification of nucleic acids. These examples demonstrate the paramount importance of testing and validating survey designs and virus detection methods for noncrop plant communities to ensure accurate ecological surveys and reliable assumptions about virus dynamics in wild hosts.
Copyright © 2016, American Society for Microbiology. All Rights Reserved.
Figures
Similar articles
-
Occurrence of Viruses and Associated Grain Yields of Paired Symptomatic and Nonsymptomatic Tillers in Kansas Winter Wheat Fields.Phytopathology. 2016 Feb;106(2):202-10. doi: 10.1094/PHYTO-04-15-0089-R. Epub 2016 Jan 22. Phytopathology. 2016. PMID: 26799958
-
Detection of potato mop-top virus in soils and potato tubers using bait-plant bioassay, ELISA and RT-PCR.J Virol Methods. 2014 Jan;195:221-7. doi: 10.1016/j.jviromet.2013.10.022. Epub 2013 Oct 24. J Virol Methods. 2014. PMID: 24161813
-
Epidemiology and integrated management of persistently transmitted aphid-borne viruses of legume and cereal crops in West Asia and North Africa.Virus Res. 2009 May;141(2):209-18. doi: 10.1016/j.virusres.2008.12.007. Epub 2009 Jan 17. Virus Res. 2009. PMID: 19152820 Review.
-
A highly effective and versatile technology for the isolation of RNAs from grapevines and other woody perennials for use in virus diagnostics.Virol J. 2015 Oct 20;12:171. doi: 10.1186/s12985-015-0376-3. Virol J. 2015. PMID: 26482551 Free PMC article.
-
Ecosystem simplification, biodiversity loss and plant virus emergence.Curr Opin Virol. 2015 Feb;10:56-62. doi: 10.1016/j.coviro.2015.01.005. Epub 2015 Jan 29. Curr Opin Virol. 2015. PMID: 25638504 Free PMC article. Review.
Cited by
-
High-Throughput Sequencing Application in the Diagnosis and Discovery of Plant-Infecting Viruses in Africa, A Decade Later.Plants (Basel). 2020 Oct 16;9(10):1376. doi: 10.3390/plants9101376. Plants (Basel). 2020. PMID: 33081084 Free PMC article. Review.
-
Global genetic diversity and evolutionary patterns among Potato leafroll virus populations.Front Microbiol. 2022 Sep 26;13:1022016. doi: 10.3389/fmicb.2022.1022016. eCollection 2022. Front Microbiol. 2022. PMID: 36590416 Free PMC article.
-
Pixel-Based Machine Learning and Image Reconstitution for Dot-ELISA Pathogen Diagnosis in Biological Samples.Front Microbiol. 2021 Mar 3;12:562199. doi: 10.3389/fmicb.2021.562199. eCollection 2021. Front Microbiol. 2021. PMID: 33767673 Free PMC article.
-
Illuminating an Ecological Blackbox: Using High Throughput Sequencing to Characterize the Plant Virome Across Scales.Front Microbiol. 2020 Oct 16;11:578064. doi: 10.3389/fmicb.2020.578064. eCollection 2020. Front Microbiol. 2020. PMID: 33178159 Free PMC article. Review.
-
Discrepancies in Serology-Based and Nucleic Acid-Based Detection and Quantitation of Tomato Spotted Wilt Orthotospovirus in Leaf and Root Tissues from Symptomatic and Asymptomatic Peanut Plants.Pathogens. 2021 Nov 12;10(11):1476. doi: 10.3390/pathogens10111476. Pathogens. 2021. PMID: 34832630 Free PMC article.
References
-
- Stewart JR, Gast RJ, Fujioka RS, Solo-Gabriele HM, Meschke JS, Amaral-Zettler LA, del Castillo E, Polz MF, Collier TK, Strom MS, Sinigalliano CD, Moeller PDR, Holland AF. 2008. The coastal environment and human health: microbial indicators, pathogens, sentinels and reservoirs. Environ Health 7(Suppl 2):S3. doi:10.1186/1476-069X-7-S2-S3. - DOI - PMC - PubMed
-
- Martinelli F, Scalenghe R, Davino S, Panno S, Scuderi G, Ruisi P, Villa P, Stroppiana D, Boschetti M, Goulart LR, Davis CE, Dandekar AM. 2015. Advanced methods of plant disease detection. A review. Agron Sustain Dev 35:1–25. doi:10.1007/s13593-015-0314-1. - DOI
-
- Lopez MM, Llop P, Olmos A, Marco-Noales E, Cambra M, Bertolini E. 2009. Are molecular tools solving the challenges posed by detection of plant pathogenic bacteria and viruses? Curr Issues Mol Biol 11:13–45. - PubMed
Publication types
MeSH terms
LinkOut - more resources
Full Text Sources
Other Literature Sources
Miscellaneous
