

FINEMAP: efficient variable selection using summary data from genome-wide association studies
- PMID: 26773131
- PMCID: PMC4866522
- DOI: 10.1093/bioinformatics/btw018
FINEMAP: efficient variable selection using summary data from genome-wide association studies
Abstract
Motivation: The goal of fine-mapping in genomic regions associated with complex diseases and traits is to identify causal variants that point to molecular mechanisms behind the associations. Recent fine-mapping methods using summary data from genome-wide association studies rely on exhaustive search through all possible causal configurations, which is computationally expensive.
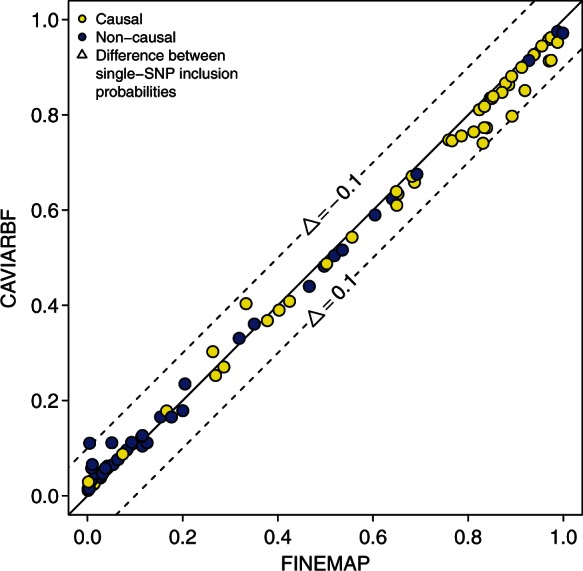
Results: We introduce FINEMAP, a software package to efficiently explore a set of the most important causal configurations of the region via a shotgun stochastic search algorithm. We show that FINEMAP produces accurate results in a fraction of processing time of existing approaches and is therefore a promising tool for analyzing growing amounts of data produced in genome-wide association studies and emerging sequencing projects.
Availability and implementation: FINEMAP v1.0 is freely available for Mac OS X and Linux at http://www.christianbenner.com
Contact: : christian.benner@helsinki.fi or matti.pirinen@helsinki.fi.
© The Author 2016. Published by Oxford University Press.
Figures
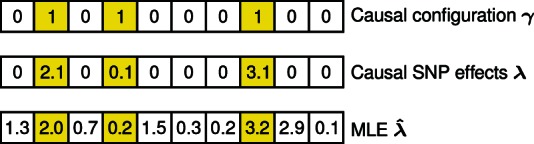
 ). The corresponding causal (linear) model for a quantitative trait assumes only few SNPs with a causal effect. The Maximum Likelihood Estimate (MLE) of the causal SNP effects can be computed by using only the SNP correlation matrix and single-SNP z-scores. However, the MLE is not ideal because it does not account for the sparsity assumption
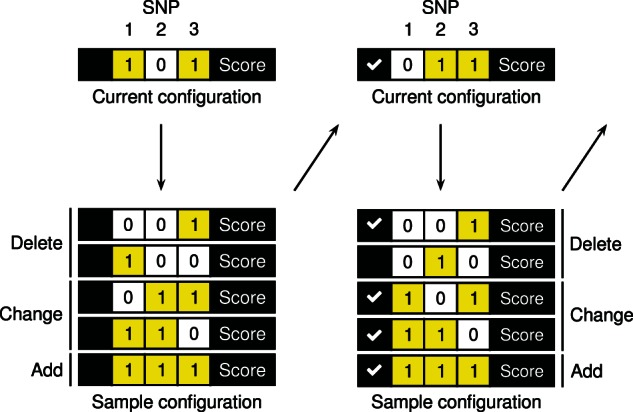 ) from the current configuration. The next iteration starts by sampling a new causal configuration from the neighborhood based on the scores normalized within the neighborhood. The unnormalized posterior probabilities remain fixed throughout the algorithm and can thus be memorized (
 ) to avoid recomputation when already-evaluated configurations appear in another neighborhood
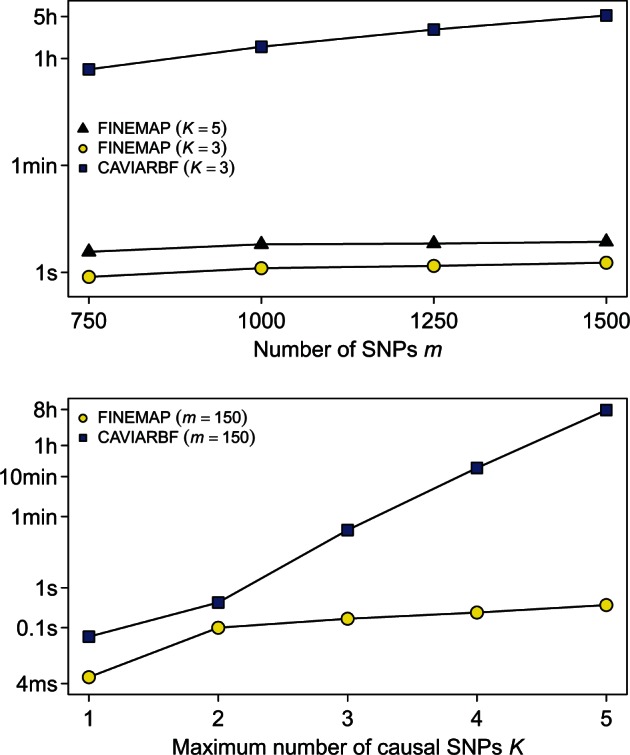
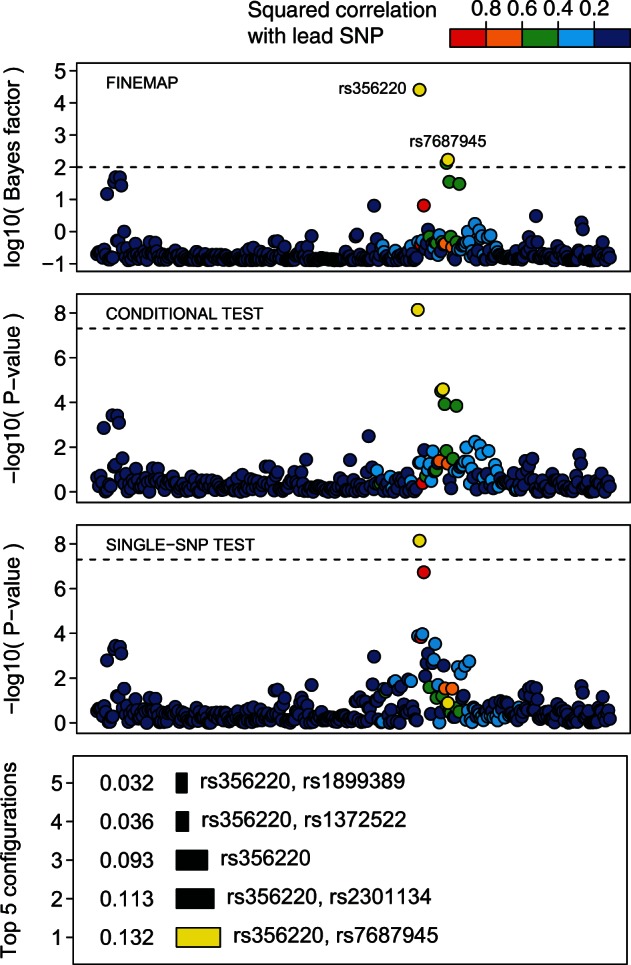
 and their configuration by
  . Dashed lines correspond respectively to a single-SNP Bayes factor of 100 and P-value of . Squared correlations are shown with respect to rs356220
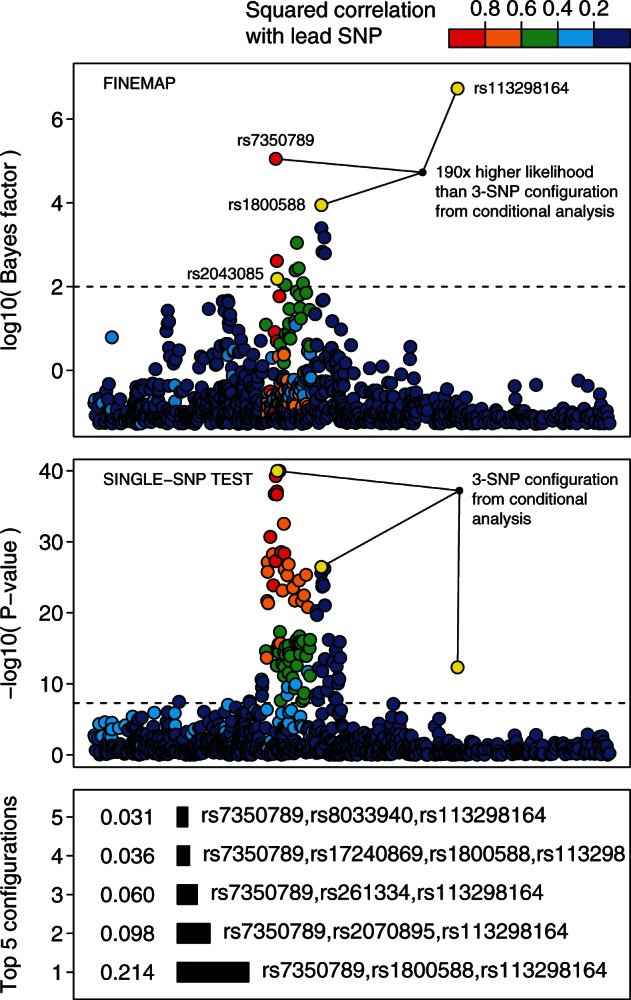 . Dashed lines correspond respectively to a single-SNP Bayes factor of 100 and P-value of . Squared correlations are shown with respect to rs2043085
References
-
- Andrieu C. et al. (2003) An introduction to MCMC for machine learning. Mach. Learn., 50, 5–43.
-
- Bottolo L., Richardson S. (2010) Evolutionary stochastic search for Bayesian model exploration. Bayesian Anal., 3, 583–618.
-
- Borodulin K. et al. (2015) Forty-year trends in cardiovascular risk factors in Finland. Eur. J. Public Health, 25, 539–546. - PubMed
-
- Carbonetto P., Stephens M. (2012) Scalable variational inference for Bayesian variable selection in regression, and its accuracy in genetic association studies. Bayesian Anal., 1, 73–108.
MeSH terms
Grants and funding
LinkOut - more resources
Full Text Sources
Other Literature Sources
