. 2016 Feb 12;55(7):2350-5.
doi: 10.1002/anie.201508404. Epub 2016 Jan 15.

A Bifunctional Electrocatalyst for Oxygen Evolution and Oxygen Reduction Reactions in Water

Affiliations

A Bifunctional Electrocatalyst for Oxygen Evolution and Oxygen Reduction Reactions in Water

Wolfgang Schöfberger et al. Angew Chem Int Ed Engl. .

Abstract

Oxygen reduction and water oxidation are two key processes in fuel cell applications. The oxidation of water to dioxygen is a 4 H(+)/4 e(-) process, while oxygen can be fully reduced to water by a 4 e(-)/4 H(+) process or partially reduced by fewer electrons to reactive oxygen species such as H2O2 and O2(-). We demonstrate that a novel manganese corrole complex behaves as a bifunctional catalyst for both the electrocatalytic generation of dioxygen as well as the reduction of dioxygen in aqueous media. Furthermore, our combined kinetic, spectroscopic, and electrochemical study of manganese corroles adsorbed on different electrode materials (down to a submolecular level) reveals mechanistic details of the oxygen evolution and reduction processes.

Keywords: corroles; electrochemistry; manganese; oxygen evolution; oxygen reduction.


Figures

Figure 1
Figure 1
Water‐soluble bifunctional manganese corrole catalyst 1 (obtained as a mixture of regioisomers, see the Supporting Information) and reference compounds 2 and 3 for the study of the adsorption mode and the electronic properties of single molecules on solid surfaces.
Figure 2
Figure 2
Cyclic voltammogram of catalyst 1 dissolved in acetonitrile on varying the scan rate (ν) from 10 mV s−1 to 1 V s−1 using glassy carbon as the working electrode. The inset shows the plot of the maximum catalytic current (i p) versus the scan rate (ν 1/2); linear fit (y=129.26 x, R 2=0.964).
Figure 3
Figure 3
A) Cyclic voltammogram of catalyst 1 (in acetonitrile) showing homogeneously increasing catalytic oxygen evolution with increasing base concentration from 1 mm NaOH to 25 mm NaOH at a scan rate of 50 mV s−1. A glassy carbon electrode was used as the working electrode. B) Plot of (i c/i p)2 versus conc. of NaOH (in mm) in a homogeneous OER in acetonitrile at a scan rate of 100 mV s−1; linear fit (y=22.227 x, R 2=0.966)
Figure 4
Figure 4
A) STM image of a self‐assembled monolayer of manganese corroles 2 at a solid–liquid interface on highly ordered pyrolytic graphite (HOPG) and 1‐phenyloctane. B–E) Low‐temperature STM images of ordered MnTpFPC (3) molecules on Ag(111) at 5 K. F) Nomogram comparing the cyclic voltammogram of 1 with the dI/dV spectrum of 3 observed by tunneling over the manganese corrole center (red spectrum) and the corrole macrocycle (black spectrum); insert: simulation of a STM image at a bias voltage of −0.3 V using the Tersoff–Hamann model (see also Figure S5).26
Figure 5
Figure 5
Anaerobic cyclic voltammogram of 1 immobilized on an edge plane pyrolytic graphite (EPG) electrode on varying the pH value from pH 7.0 to pH 11.0, which indicates the bifunctional nature of the catalyst. The inset shows the zoomed portion of the ORR where produced oxygen during the OER gets reduced.
Figure 6
Figure 6
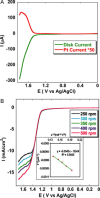
A) RRDE data of 1 physisorbed on an EPG electrode in pH 11.0 buffer at a constant rotation of 300 rpm and scan rate of 10 mV s−1, with platinum held at a constant potential of 0.3 V where it reduced the oxygen generated during the OER (Figure S8). B) Linear sweep voltammograms of immobilized catalyst on an EPG electrode at a scan rate of 50 mV s−1 on varying the rotation rate from 250 to 500 rpm. The inset shows the Koutecky–Levich plot (I −1 versus ν −1/2) from which k cat. was calculated; linear fit (y=−0.0045 x, R 2=0.993).
Figure 7
Figure 7
A) Cyclic voltammogram (anaerobic) of the catalyst 1 in pH 7.0 buffer on an edge plane graphite electrode. B) Linear sweep voltammogram of 1 physiadsorbed on an EPG electrode in pH 7.0 buffer at a scan rate of 50 mV s−1 with different rotation rates. The inset shows the Koutecky–Levich plot of the catalyst showing the ORR. The dotted and dashed lines are used to denote the theoretical plots for 2 e and 4 e, respectively.

References

    1. None
    1. Galstyan A., Robertazzi A., Knapp E. W., J. Am. Chem. Soc. 2012, 134, 7442–7449; - PubMed
    1. Dismukes G. C., Klimov V. V., Baranov S. V., Kozlov Y. N., DasGupta J., Tyryshkin A., Proc. Natl. Acad. Sci. USA 2001, 98, 2170–2175; - PMC - PubMed
    1. Dasgupta J., van Willigen R. T., Dismukes G. C., Phys. Chem. Chem. Phys. 2004, 6, 4793–4802;
    1. Dismukes G. Charles, van Willigen R. T. in Encyclopedia of Inorganic Chemistry, Wiley, Hoboken, 2006;

Publication types