Review
. 2017 Mar;30(3):10.1002/nbm.3458.
doi: 10.1002/nbm.3458. Epub 2016 Jan 15.

Diffusion MRI in early cancer therapeutic response assessment

Affiliations
Review

Diffusion MRI in early cancer therapeutic response assessment

C J Galbán et al. NMR Biomed. 2017 Mar.

Abstract

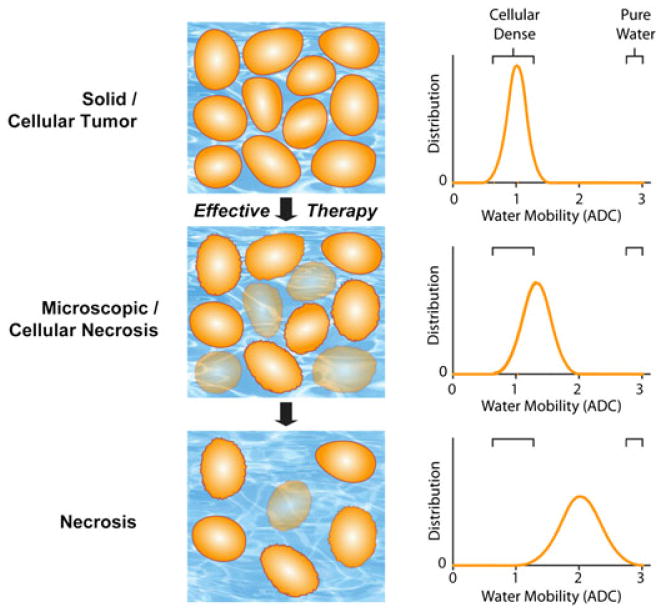
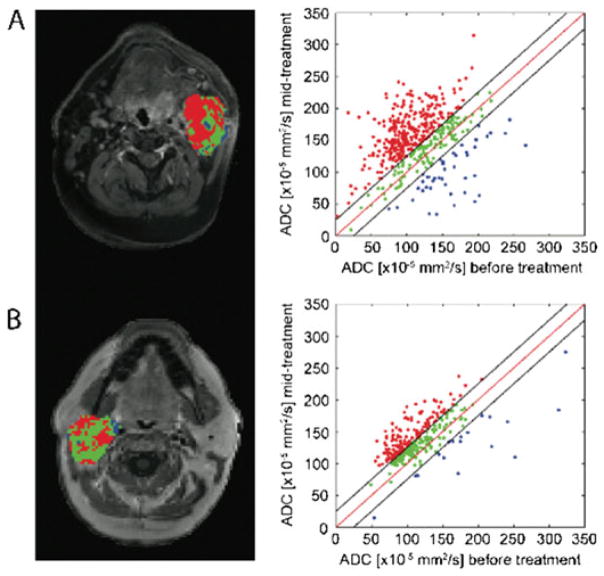
Imaging biomarkers for the predictive assessment of treatment response in patients with cancer earlier than standard tumor volumetric metrics would provide new opportunities to individualize therapy. Diffusion-weighted MRI (DW-MRI), highly sensitive to microenvironmental alterations at the cellular level, has been evaluated extensively as a technique for the generation of quantitative and early imaging biomarkers of therapeutic response and clinical outcome. First demonstrated in a rodent tumor model, subsequent studies have shown that DW-MRI can be applied to many different solid tumors for the detection of changes in cellularity as measured indirectly by an increase in the apparent diffusion coefficient (ADC) of water molecules within the lesion. The introduction of quantitative DW-MRI into the treatment management of patients with cancer may aid physicians to individualize therapy, thereby minimizing unnecessary systemic toxicity associated with ineffective therapies, saving valuable time, reducing patient care costs and ultimately improving clinical outcome. This review covers the theoretical basis behind the application of DW-MRI to monitor therapeutic response in cancer, the analytical techniques used and the results obtained from various clinical studies that have demonstrated the efficacy of DW-MRI for the prediction of cancer treatment response. Copyright © 2016 John Wiley & Sons, Ltd.

Keywords: cancer treatment response; diffusion-weighted MRI; functional diffusion map; imaging biomarker; review article.


Figures

Figure 1
Figure 1
Schematic diagram of changes in water diffusivity in a tumor following an effective therapeutic agent. Changes in cellularity (left) occur with increasing molecular water mobility, measured as the apparent diffusion coefficient (ADC; right), as a tumor responds to treatment (top to bottom). As a tumor responds to therapy, an increase in extracellular space and membrane permeability occurs, which allows for increased water mobility, and is detected by diffusion-weighted MRI (DW-MRI) as an increase in ADC values. [Courtesy of ref. (18).]
Figure 2
Figure 2
(A) Apparent diffusion coefficient (ADC) maps superimposed on the post-contrast dynamic contrast-enhanced MR (DCE-MR) images at three time points [pre-treatment, after one cycle and after all cycles of neoadjuvant chemotherapy (NAC)] for a patient achieving pathological complete response (pCR). The numbers for each panel represent the mean ADC values for each time point in the parametric map. (B) The difference image between pre-contrast and post-contrast DCE-MRI at each time point. (C) ADC maps superimposed on the post-contrast DCE-MR images at three time points (pre-treatment, after one cycle and after all cycles of NAC) for a non-pCR patient. The numbers for each panel represent the mean ADC values for each time point in the parametric map. (D) The difference image between pre-contrast and post-contrast DCE-MRI at each time point. [Courtesy of and adapted from ref. (73).]
Figure 3
Figure 3
Whole-body diffusion-weighted MRI (wbDW-MRI) is presented as an early indicator of response to systemic therapy in patients with lymphoma. (A) Image of a 48-year-old man diagnosed with diffuse large B-cell lymphoma obtained at baseline shows the ubiquitous involvement of lymph nodes (e.g. cervical and retroperitoneal, small arrows) and axillary regions (large arrows) with marked restriction of water diffusivity. A larger pelvic node (arrowhead) is also seen left of the midline. (B) At day 7 following the institution of chemotherapy with rituximab (anti-CD20 antibodies) + CHOP (cyclophosphamide, hydroxydaunorubicin, vincristine, prednisolone), wbDW-MRI shows evident reduction in signal intensity in the cervical and retroperitoneal node regions (small arrows) and axillary region (large arrows) (from ADC = 0.90/0.33/0.67/0.61 to ADC = 1.66/0.73/1.36/1.22), with a corresponding increase in ADC (not shown), but a less marked response, in the pelvic node (arrowhead) (from ADC = 0.83/0.51 to ADC = 1.12/0.67) At the interim, the patient achieved complete remission. [Courtesy of ref. (59).]
Figure 4
Figure 4
Simulated comparison of whole-tumor histogram analysis (top row; blue line, pre-treatment tumor data; red line, post-treatment tumor data) versus the corresponding voxel-based analysis using a joint density histogram (bottom row). Histograms from tumors with no major change (A), significant uniform shift to higher apparent diffusion coefficient (ADC) values with a 34% net mean change (B) and heterogeneous ADC changes (increased and decreased ADC values) resulting in no net detectable histogram shift (C). Parametric response maps from the corresponding histograms are also shown, where, in (D), the confidence interval for the detection of change was set to 95%, and thus no significant change in red voxels (increased values) or blue voxels (decreased values) was detected. (E) An increase in the number of red voxels was detected at 29% of the total tumor voxels. (F) Both an increase and a decrease in tumor voxels of approximately 15% were detected, whereas no major shift was detected using a histogram analysis of the same data (C). [Courtesy of Ref. (85).]
Figure 5
Figure 5
Functional diffusion mapping (fDM) applied to clinical data acquired from patients with head and neck squamous cell carcinoma (HNSCC) diagnosed as pCR (pathological complete response) (A) and PR (partial response) (B). Results from the fDM analysis are presented as color-coded maps superimposed on contrast-enhanced T1-weighted images and scatter plots with axes pre-treatment ADC (x-axis) and post-treatment ADC (y-axis). Color-coding is as follows: red, increased ADC values; blue, decreased ADC values; green, unchanged ADC values. [Courtesy of ref. (65).]
Figure 6
Figure 6
Number of annual publications on the application of diffusion-weighted MRI (DW-MRI) for therapeutic response assessment. Yearly evaluation showed a growing increase in the number of studies demonstrating the efficacy of DW-MRI for cancer response to treatment. The search was performed on Pubmed using the following criteria [((diffusion OR ADC OR “apparent diffusion coefficient”) AND MRI AND response) NOT (stroke OR review)]. Individual references were manually evaluated.

References

    1. Gehan EA, et al. Historical and methodological developments in clinical trials at the National Cancer Institute. Stat Med. 1990;9(8):871–80. discussion 903–906. - PubMed
    1. Eisenhauer EA, et al. New response evaluation criteria in solid tumours: revised RECIST guideline (version 1.1) Eur J Cancer. 2009;45(2):228–47. - PubMed
    1. Wen PY, et al. Updated response assessment criteria for high-grade gliomas: response assessment in neuro-oncology working group. J Clin Oncol. 2010;28(11):1963–72. - PubMed
    1. World Health Organization (WHO) WHO Handbook for Reporting Results of Cancer Treatment. Geneva: WHO; 1979.
    1. Jaffe CC. Measures of response: RECIST, WHO, and new alternatives. J Clin Oncol. 2006;24(20):3245–51. - PubMed

MeSH terms