. 2016 Jan 20;89(2):285-99.
doi: 10.1016/j.neuron.2015.11.037. Epub 2016 Jan 7.

Simultaneous Denoising, Deconvolution, and Demixing of Calcium Imaging Data

Affiliations

Simultaneous Denoising, Deconvolution, and Demixing of Calcium Imaging Data

Eftychios A Pnevmatikakis et al. Neuron. .

Abstract

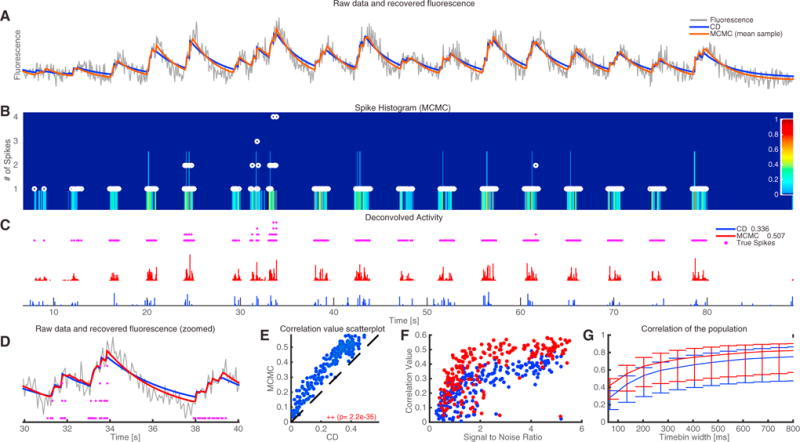
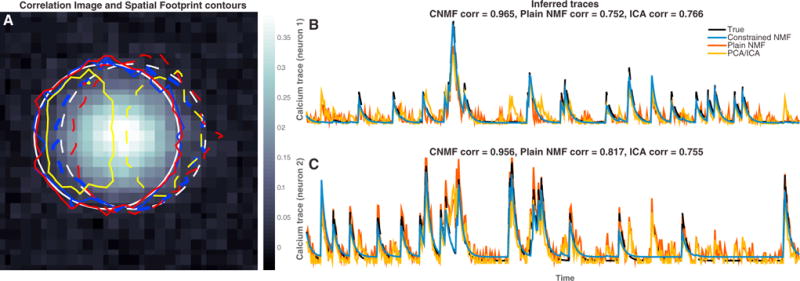
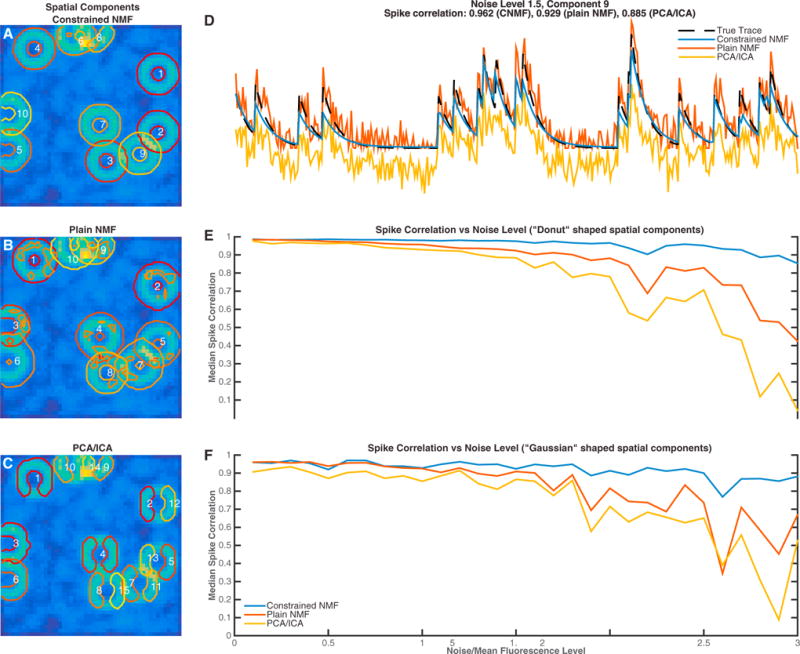
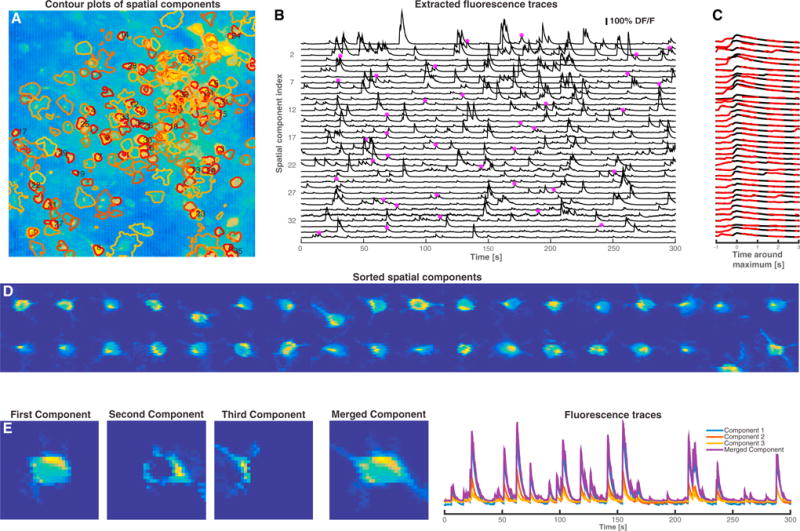
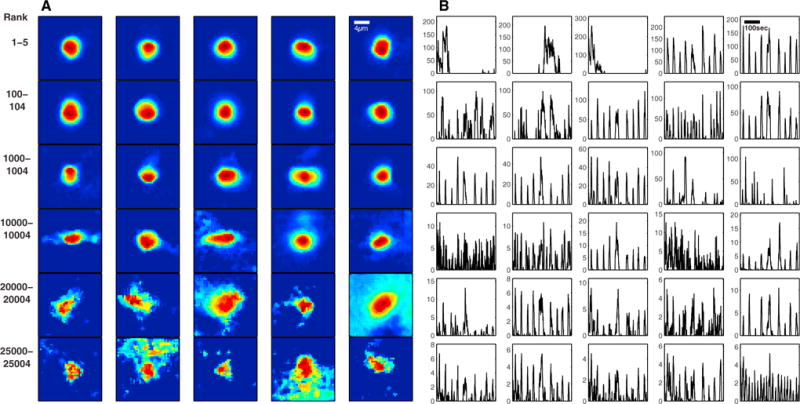
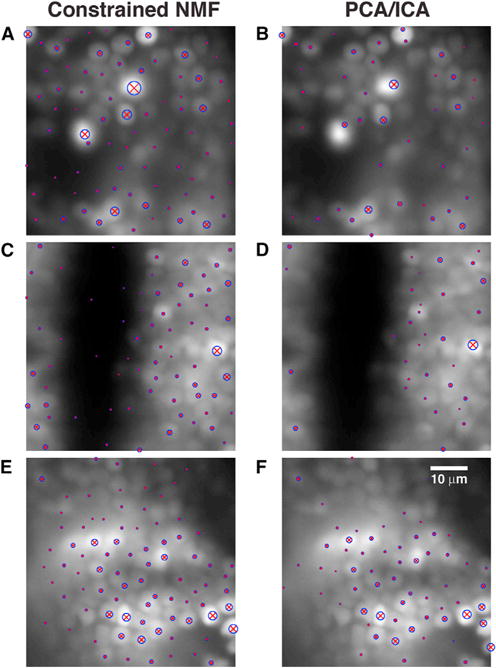
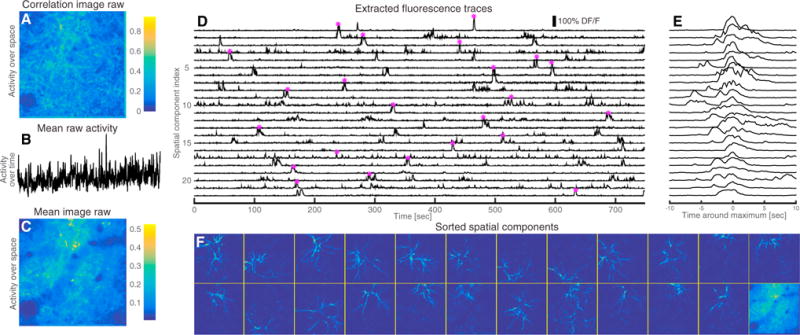
We present a modular approach for analyzing calcium imaging recordings of large neuronal ensembles. Our goal is to simultaneously identify the locations of the neurons, demix spatially overlapping components, and denoise and deconvolve the spiking activity from the slow dynamics of the calcium indicator. Our approach relies on a constrained nonnegative matrix factorization that expresses the spatiotemporal fluorescence activity as the product of a spatial matrix that encodes the spatial footprint of each neuron in the optical field and a temporal matrix that characterizes the calcium concentration of each neuron over time. This framework is combined with a novel constrained deconvolution approach that extracts estimates of neural activity from fluorescence traces, to create a spatiotemporal processing algorithm that requires minimal parameter tuning. We demonstrate the general applicability of our method by applying it to in vitro and in vivo multi-neuronal imaging data, whole-brain light-sheet imaging data, and dendritic imaging data.


Figures

Figure 1
Figure 1. Application of the CD Method to Antidromically Driven In Vitro Spinal Cord Data
(A) Raw fluorescence data from an example neuron (gray) and reconstructed fluorescence trace with the proposed CD method (blue) and the mean sample obtained by the fully Bayesian MCMC method of Pnevmatikakis et al. (2013), with time constant updating (red). The CD method effectively denoises the observed fluorescence trace but overestimates the time constants slightly, while the more expensive MCMC method fine-tunes the time constants to match better the observed data. (B) Color-coded depiction of the empirical posterior marginal histogram obtained with the MCMC method and true number of antidromic spikes during each timebin (white dots). The colormap displays the probability of a certain number of spikes within a given timebin. The MCMC method can quantify uncertainty and identify multiple spikes within a single timebin. (C) Estimated neural activity (normalized) from the CD method (blue) and mean of the posterior marginal per timebin with the MCMC method (red). The legend also shows the spike correlation for each method at the imaged resolution. All methods detect accurately the bursting intervals of the neurons. The more expensive MCMC method gives a significant improvement in the spike deconvolution according to the spike correlation metric. (D) Zoomed-in version of (A). (E) MCMC outperforms CD for this dataset (Wilcoxon signed ranked test). Each circle corresponds to a single cell. (F) Correlation values at the imaged resolution for all n = 207 cells as a function of the signal-to-noise ratio for the two methods. Performance increases with the SNR for all methods. Again, each circle corresponds to a single cell. (G) Median correlation values for all n = 207 cells at various timebin widths. Error bars indicate the 0.25 and 0.75 quantiles, respectively.
Figure 2
Figure 2. Resolving Overlapping Spatial Footprints in Simulated Data
Simulated fluorescence traces were generated from two significantly overlapping neuron spatial footprints in low SNR conditions. (Both spatial and temporal units in this example are arbitrary.) (A) Correlation image generated from the raw data and superimposed contour plots (solid for neuron 1 and dashed for neuron 2) for the true spatial footprints (white) and the inferred spatial footprints with our proposed CNMF method (blue), the plain NMF method of Maruyama et al., (2014) (red), and the PCA/ICA method of Mukamel et al., (2009) (yellow). The correlation image cannot distinguish between the two different neurons. The spatial footprints inferred by PCA/ICA are significantly smaller than the true spatial footprints. NMF methods capture the full spatial extent of the spatial footprints. (B and C) Inferred calcium traces with all the methods. PCA/ICA and plain NMF cannot satisfactorily demix the traces and attributes single neuron activity to both neurons. On the contrary, our CNMF approach eliminates most of the “cross-talk” between the overlapping neurons. Correlation values are computed on the estimated deconvolved neural activity.
Figure 3
Figure 3. Performance of Proposed Spatiotemporal Method in Simulated Data
Simulated fluorescence traces were generated from a population of ten neurons placed randomly in the field of view, allowing significant spatial overlap. Two different neuronal shapes were considered across thirty different noise levels. (A–C) Inferred spatial components with the proposed CNMF method (A), plain NMF as proposed in Maruyama et al. (2014) (B), and the PCA/ICA method of Mukamel et al. (2009) (C). Contour plots of the inferred spatial components are super-imposed on the image of mean activity. In this example, the noise level for every pixel was 1.5× the mean activity. The numbers in white are placed on the center of mass of each component. The proposed method identifies spatial components very accurately, compared to plain NMF that can group different components together. PCA/ICA tends to infer smaller non-overlapping components and can also split components into multiple parts in low SNR conditions. (D) Inferred temporal traces for component 9 (as indicated in A). The proposed method infers a trace (blue) that matches the true trace (dashed black) much better than the plain NMF method (red) and PCA/ICA (yellow). (E) Median spike correlation of the three methods over 30 different noise levels, with five iterations for each level, for donut-shaped neurons. (F) Same, but for “Gaussian” shaped neurons. The proposed method is significantly more robust compared to other popular methods, especially for low-SNR conditions.
Figure 4
Figure 4. Application to Mouse In Vivo GCaMP6s Data
(A) Contour plots of inferred spatial components superimposed on the correlation image of the raw data. The components are sorted in decreasing order based on the maximum temporal value and their size. Contour plots of the first 200 identified components are shown, and the first 36 components are numbered. (B) Extracted DF/F fluorescence traces for the first 36 components. (C) Zoomed-in depiction of the fluorescence traces around a point of local maximum activity indicated by the star marker in (B), (black) super-imposed with the raw spatial component filtered data after removal of all the other components (red dashed). (D) Spatial footprints of the first 36 components. The algorithm can in many cases pull out morphological details of the imaged processes. (E) Depiction of the merging procedure: the first three panels in the left show three overlapping components with highly correlated temporal activity. These components are merged into a single component that is further refined in the algorithm. The temporal traces of the three initial components and the merged component are shown in the right panel (see also Movie S1).
Figure 5
Figure 5. Components Detected in a Whole Zebrafish Brain
A sample of detected components (A, inferred neuronal shapes; B, inferred DF/F activity traces), ordered according to their rank. High-ranking components match expected nuclear-localized neuronal shapes and activity visible in the raw video data; low-ranking components tend to be more “noisy” in both shapes and activity. In all, the first 26,000 components largely correspond to reasonable neuronal signals (as determined by visual inspection of the video data; Movies S2, S3, and S4).
Figure 6
Figure 6. The CNMF Method Outperforms the PCA/ICA Method in Detecting Weak Neurons, on Patches of Zebrafish Data
The patches are covered with the shape centers detected in that patch (blue circles around red “×” markers, with larger symbols indicating higher-ranked components), superimposed on the mean image for each patch. (A, C, and E) Centers detected for the CNMF method, on patches containing the 1st, 1,000th, and 26,000th ranked neurons, respectively. (B, D, and F) Centers detected for the PCA/ICA method on the same patches. Calcium video and detected components in these patches can be viewed in Movies S2, S3, S4, S5, S6, and S7. The detected components for the PCA/ICA method are shown in Figure S2. Movie S8 shows the components detected throughout the brain, using CNMF.
Figure 7
Figure 7. Application to In Vivo Dendritic Imaging Data from Rodent Barrel Cortex
(A) Correlation image of the raw data. Due to the high degree of overlap, the correlation image cannot be used to segment the video. (B) Spatially averaged activity over time of the raw data. (C) Mean activity over time. (D) DF/F temporal traces of the top 23 components extracted from our algorithm. (E) Close up and centering around the point of maximum activation for each trace (indicated by the star marker in D). (F) Sorted spatial footprints and background (lower right corner). The proposed method can segment the dense dendritic imaging data and reveal a rich underlying sparse structure (see also Movie S9).

References

    1. Ahrens MB, Orger MB, Robson DN, Li JM, Keller PJ. Whole-brain functional imaging at cellular resolution using light-sheet microscopy. Nat Methods. 2013;10:413–420. - PubMed
    1. Chen TW, Wardill TJ, Sun Y, Pulver SR, Renninger SL, Baohan A, Schreiter ER, Kerr RA, Orger MB, Jayaraman V, et al. Ultrasensitive fluorescent proteins for imaging neuronal activity. Nature. 2013;499:295–300. - PMC - PubMed
    1. Cotton RJ, Froudarakis E, Storer P, Saggau P, Tolias AS. Three-dimensional mapping of microcircuit correlation structure. Front Neural Circuits. 2013;7:151. - PMC - PubMed
    1. Diego-Andilla F, Hamprecht FA. Learning multi-level sparse representations. In: Burges CJC, Bottou L, Welling M, Ghahramani Z, Weinberger KQ, editors. Advances in Neural Information Processing Systems 26 (NIPS 2013) Curran Associates; 2013. pp. 818–826.
    1. Diego-Andilla F, Hamprecht FA. Sparse space-time deconvolution for calcium image analysis. In: Ghahramani Z, Welling M, Cortes C, Lawrence ND, Weinberger KQ, editors. Advances in Neural Information Processing Systems 27 (NIPS 2014) Curran Associates; 2014. pp. 64–72.

Publication types