

Assessment of k-mer spectrum applicability for metagenomic dissimilarity analysis
- PMID: 26774270
- PMCID: PMC4715287
- DOI: 10.1186/s12859-015-0875-7
Assessment of k-mer spectrum applicability for metagenomic dissimilarity analysis
Abstract
Background: A rapidly increasing flow of genomic data requires the development of efficient methods for obtaining its compact representation. Feature extraction facilitates classification, clustering and model analysis for testing and refining biological hypotheses. "Shotgun" metagenome is an analytically challenging type of genomic data - containing sequences of all genes from the totality of a complex microbial community. Recently, researchers started to analyze metagenomes using reference-free methods based on the analysis of oligonucleotides (k-mers) frequency spectrum previously applied to isolated genomes. However, little is known about their correlation with the existing approaches for metagenomic feature extraction, as well as the limits of applicability. Here we evaluated a metagenomic pairwise dissimilarity measure based on short k-mer spectrum using the example of human gut microbiota, a biomedically significant object of study.
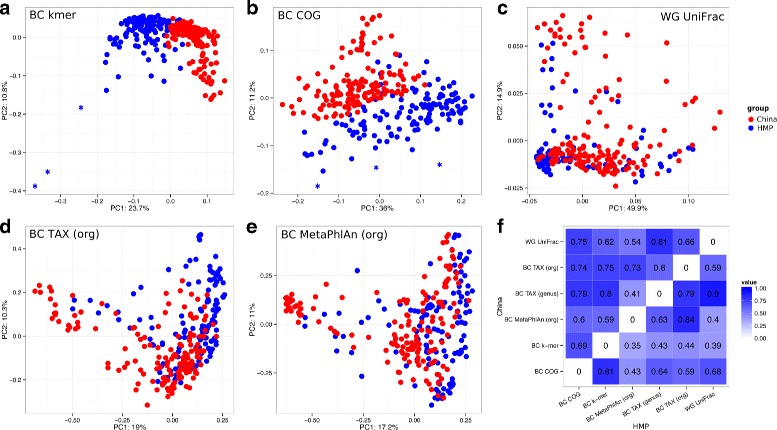
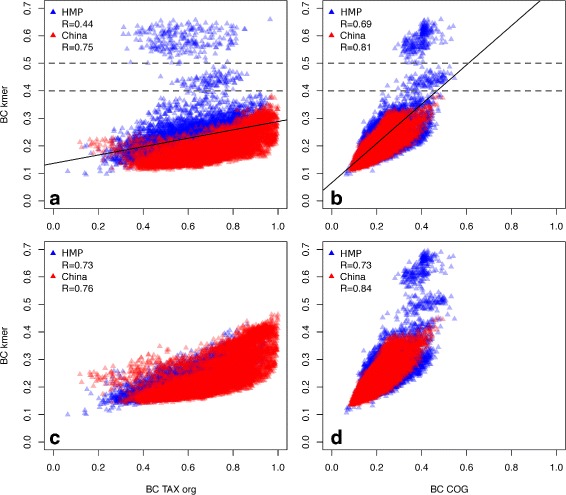
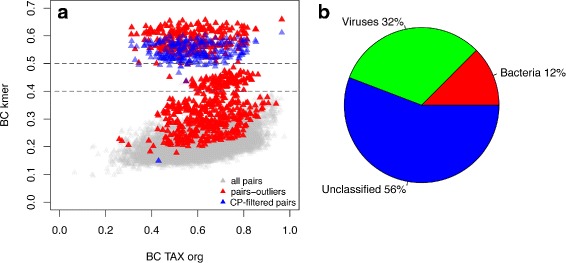
Results: We developed a method for calculating pairwise dissimilarity (beta-diversity) of "shotgun" metagenomes based on short k-mer spectra (5 ≤ k ≤ 11). The method was validated on simulated metagenomes and further applied to a large collection of human gut metagenomes from the populations of the world (n=281). The k-mer spectrum-based measure was found to behave similarly to one based on mapping to a reference gene catalog, but different from one using a genome catalog. This difference turned out to be associated with a significant presence of viral reads in a number of metagenomes. Simulations showed limited impact of bacterial genetic variability as well as sequencing errors on k-mer spectra. Specific differences between the datasets from individual populations were identified.
Conclusions: Our approach allows rapid estimation of pairwise dissimilarity between metagenomes. Though we applied this technique to gut microbiota, it should be useful for arbitrary metagenomes, even metagenomes with novel microbiota. Dissimilarity measure based on k-mer spectrum provides a wider perspective in comparison with the ones based on the alignment against reference sequence sets. It helps not to miss possible outstanding features of metagenomic composition, particularly related to the presence of an unknown bacteria, virus or eukaryote, as well as to technical artifacts (sample contamination, reads of non-biological origin, etc.) at the early stages of bioinformatic analysis. Our method is complementary to reference-based approaches and can be easily integrated into metagenomic analysis pipelines.
Figures
References
Publication types
MeSH terms
LinkOut - more resources
Full Text Sources
Other Literature Sources
Molecular Biology Databases
Miscellaneous
