. 2016 Jan 26;14(3):479-492.
doi: 10.1016/j.celrep.2015.12.043. Epub 2016 Jan 7.

Deposition of 5-Methylcytosine on Enhancer RNAs Enables the Coactivator Function of PGC-1α

Affiliations

Deposition of 5-Methylcytosine on Enhancer RNAs Enables the Coactivator Function of PGC-1α

Francesca Aguilo et al. Cell Rep. .

Abstract

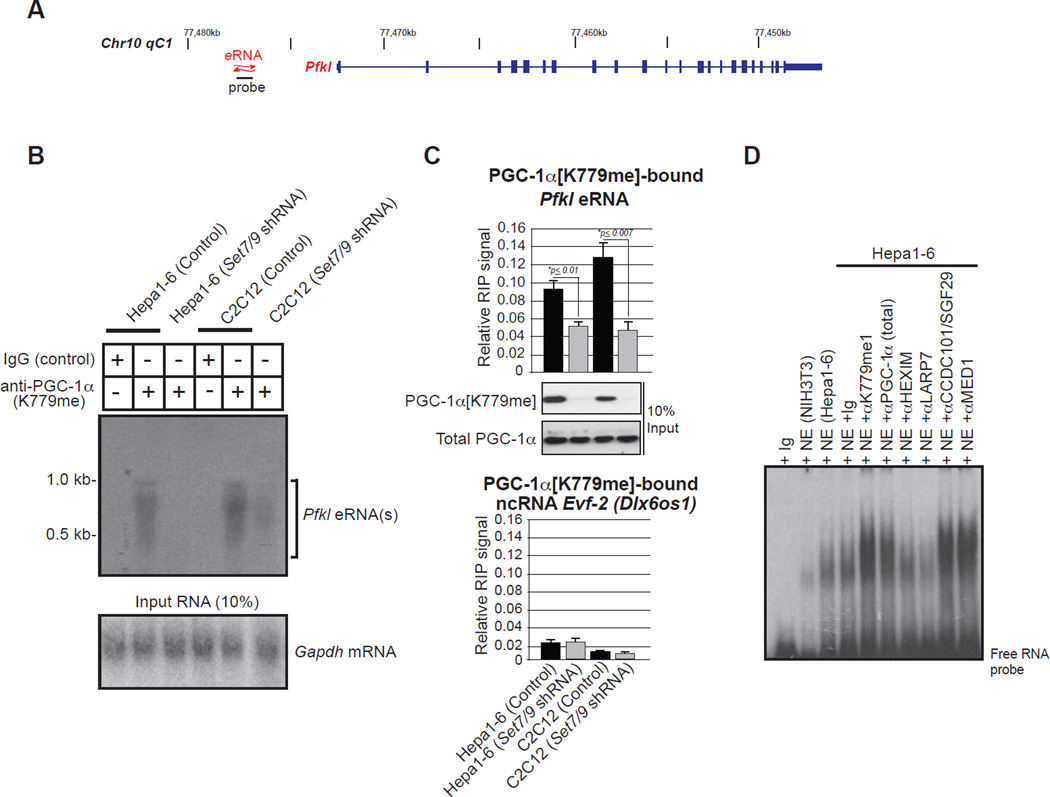
The Peroxisome proliferator-activated receptor-gamma coactivator 1 alpha (PGC-1α) is a transcriptional co-activator that plays a central role in adapted metabolic responses. PGC-1α is dynamically methylated and unmethylated at the residue K779 by the methyltransferase SET7/9 and the Lysine Specific Demethylase 1A (LSD1), respectively. Interactions of methylated PGC-1α[K779me] with the Spt-Ada-Gcn5-acetyltransferase (SAGA) complex, the Mediator members MED1 and MED17, and the NOP2/Sun RNA methytransferase 7 (NSUN7) reinforce transcription, and are concomitant with the m(5)C mark on enhancer RNAs (eRNAs). Consistently, loss of Set7/9 and NSun7 in liver cell model systems resulted in depletion of the PGC-1α target genes Pfkl, Sirt5, Idh3b, and Hmox2, which was accompanied by a decrease in the eRNAs levels associated with these loci. Enrichment of m(5)C within eRNA species coincides with metabolic stress of fasting in vivo. Collectively, these findings illustrate the complex epigenetic circuitry imposed by PGC-1α at the eRNA level to fine-tune energy metabolism.


Figures

Figure 1
Figure 1. PGC-1α is a direct substrate for LSD1 and SET7/9 and the methylation state is associated with enhanced transcription activation
A) LSD1 and PGC-1α western blot of nuclear extracts from Hepa 1–6 infected with control or Lsd1 shRNA (upper panel). These nuclear extracts were used for SILAC assays (below). The mass spectra revealed PGC-1α as a significant substrate for LSD1. B) Autoradiography for in vitro methylation assays performed with the recombinant C-terminal domain of the human PGC-1α protein and the recombinant methyltransferases indicated in the figure. For the demethylation assay, recombinant C-terminal domain of the human PGC-1α was incubated with a constant amount of SET7/9 and increased amounts of LSD1. Coomassie staining was used as a loading control (lower panel) C) Steady-state kinetic analysis of wild-type PGC-1α[K779] and mutant PGC-1α[K779R] peptides for in vitro reactions with recombinant SET7/9 enzyme. D) Direct interaction studies of [His]6-tagged C-terminal domain (C-term), RNA recognition motif (RRM), or amino acids 697 to 798 (697–798) of human PGC-1α (as shown in scheme) with GST-tagged human SET7/9 (left panel) or GST-tagged SWIRM domain of human LSD1 (right panel). E) MS of the in vitro methylation assay of PGC-1α[K779] synthetic peptide with the wild-type or the catalytically inactive SET7/9 enzyme. F) HEK-293 cells were transfected with triple FLAG-tagged human PGC-1α and cultured with L-[methyl-3H]methionine, in the presence or absence of adenosine dialdehyde (AdOx), cycloheximide (CHX) and chloramphenicol (CA). Inhibition of translation was monitored by labeling cells with [35S] methionine. After metabolic labeling, 3XFLAG/hPGC-1α was immunoprecipitated with anti-FLAG M2 beads and visualized by fluorography. G) Schematic diagram illustrating the luciferase-coding gene under the control of Gal4 upstream activating sequences (UAS, pG5luc). The pG5luc reporter construct was transfected with the expression vector encoding wild-type PGC-1α, the C-terminal deletion of PGC-1α (ΔC-term) or the mutant PGC-1α (K779R), fused to the Gal4 DNA binding domain (left panel). Luciferase activity was measured 48 h after transfection. ChIP for pan-acetyl H3 and GAL4 was performed in parallel from transfected cultures using primers overlapping the GAL4 UAS (right panel).
Figure 2
Figure 2. Identification of the nuclear methylated PGC-1α[K779me1] complex
A) Biotinylated PGC-1α[K779] and PGC-1α[K779me1] synthetic peptides were immobilized on avidin beads and incubated with nuclear extracts of Hepa1–6 cells labeled with [35S] methionine. Parallel PAGE was performed and visualized by fluorography or gel bands excised for peptide identification by tandem MS analysis. B) Peptide pull-down of PGC-1α[K779] or methylated PGC-1α[K779me] peptides with nuclear extracts from Hepa1–6 cells. Immunoblot with specific antibodies are shown. Avidin beads were used as control. C) Peptide pull-down of PGC-1α[K779], PGC-1α[K779me1], PGC-1α[K779me2], H3K4me0 or H3K4me2 with the GST-tagged tandem tudor domain of the SAGA complex component CCDC101/SGF29 (residues 143–293). Immunoblot with GST antibody (upper panel) and coomassie blue staining of the input used (lower panel). D) Coomassie blue staining of proteins eluted by anti-PGC-1α[K779me] immunoaffinity columns. The lanes were sectioned, digested with trypsin, and the extracted peptides were sequenced by mass spectrometry. The positions of molecular mass markers are indicated on the left. Naïve rabbit Ig was used as a control shown in the center lane. E) Immunoprecipitation with anti-PGC-1α[K779me] or with naïve Ig serum was performed from Hep1–6 hepatoma cell nuclear extracts and immunoblotted for the indicated interacting partners. Immunoblot of PGC-1α[K779me] of the 10% of input used in this assay (lower panel). F) UV crosslinked RNA was immunoprecipitated with methylated PGC-1α[K779me] and total PGC-1α antibodies. The enriched RNA was reverse -transcribed using either oligo-dT (o-dT) or random hexamers primers (hex) and labeled with CTP, [α-32P]. Input level of methylated PGC-1α[K779me] and total PGC-1α is shown below.
Figure 3
Figure 3. PGC-1α[K779me] is associated with enhancers and core promoters of metabolic genes
A) Venn diagram representing the overlap of PGC-1α[K779me] and total PGC-1α bound genes. B) Peak distribution of enriched ChIP reads along the annotated transcriptional start sites (TSS) for PGC-1α[K779me] and the total pool of PGC-1α. C) Density alignment of ChIP peaks relative to the TSS for PGC-1α[K779me] and unmethylated PGC-1α. D) Genome distribution of the overlapped peaks. E) Gene ontology analysis of the PGC-1α[K779me] ChIP peaks. F) Motif discovery from summit regions from PGC-1α[K779me] ChIP-seq. MEME analysis significantly identified specific transcription factor (TF) motifs (left) with their corresponding p values (top right of motif); TRANSFAC analysis indicates the proportion of TF motifs found among the overall peak distribution (center). Custom IGV tracks of genes represented as sequences enriched for specific TFs derived from the MEME enrichment analysis (right).
Figure 4
Figure 4. Loss of Set7/9 contributes to eRNAs depletion
A) Schematic diagram illustrating the transdifferentiation protocol of wild-type and Set7/9 null (Set7/9 −/−) MEFs into induced hepatocytes (iHeps). B) Immunocytochemistry analysis of wild-type and Set7/9 null iHep, using PGC-1α[K779me] and PGC-1α antibodies and Rhodamine-labeled anti-rabbit IgG (right panel). DAPI was used for DNA staining (left). C) Western blot of total PGC-1α and PGC-1α[K779me] in wild-type and Set7/9 −/− iHep and MEFs, respectively. GAPDH was used as a loading control. D) qPCR assays of the Pfkl, Sirt5, Idh3b, and Hmox2 mRNA transcripts (left panel) and the associated eRNAs upstream the TSS (right panel) in wild type and Set7/9 −/− iHep and MEFs.
Figure 5
Figure 5. Binding to eRNAs corresponds with the SET7/9-mediated methylated state of PGC- 1α
A) Schematic diagram of the murine Pfkl locus. The position of the eRNA probe used in different assays is shown. B) Binding of PGC-1α[K779me] to Pfkl-associated eRNA was analyzed by RIP Northern blot analysis upon knockdown of Set7/9 in both Hepa 1–6 and C2C12 cells. Detection of Gapdh mRNA was used as a control (lower panel). C) qPCR of the Pfkl -associated eRNA and the Dlx2 enhancer-associated Evf-2 (Dlx6os1) transcript used as a negative control, after RIP with PGC-1α[K779me] antibody upon Set7/9 depletion in both Hepa 1–6 and C2C12 cells. Shown, are the relative abundance for 10% of total input of PGC-1α as a total and methylated K779 fractions. D) RNA EMSA using Hepa 1–6 nuclear extracts and the radiolabeled RNA probe corresponding to the Pfkl-associated eRNA described in A. The indicated antibodies were added to detect supershifted bands.
Figure 6
Figure 6. The NSUN7 RNA methyltransferase influences PGC-1α target gene expression
A) ChIP-qPCR of NSUN7 performed on three discrete regions of the Pfkl and Idh3b loci as shown in the diagram. B) Knockdown of NSun7 results in downregulation of Pfkl, Sirt5, Idh3b, and Hmox2 mRNA and the associated eRNAs. C) qPCR of eRNAs captured by Aza-IP with NSUN7 or IgG control in wild-type and NSun7 shRNA Hepa1–6 cells. D) Bisulfite conversion identified specific unconverted N5-methylcytosine in the Pfkl and Sirt5 eRNAs dependent on the presence of NSUN7 and mediated through PGC-1α. Hepa1–6 were depleted of Pgc1α and NSun7 by shRNA and the total RNA was subjected to bisulfite treatment. Two individual biological replicates as total RNA were analyzed (n=2).
Figure 7
Figure 7. Physiological function of Sirt5 eRNA
A) Northern blot analysis of Sirt5 eRNAs in control and following eRNA depletion with antisense LNA RNAs (LNA-Sirt5) in mouse primary hepatocytes (left panel). Total RNA was visualized with ethidium bromide under UV transillumination (right panel). B) Sirt5 eRNA (left panel) and mRNA (right panel) qPCR analysis in control and Sirt5 eRNA-depleted Hepa1–6 hepatoma cells and primary mouse hepatocytes. C) Western blot of SIRT5 in control and following depletion of the corresponding eRNAs in primary mouse hepatocytes. Tubulin was used as a loading control (lower panel). D) Schematics illustrating Tet-On inducible promoter in TRE3G™ (Clontech) to drive transcription of Evf-2 and Sirt5 eRNAs, respectively (left panel). Graph showing the normalized luciferase activity of the Sirt5 reporter co-transfected with TRE3G-Evf-2 or TRE3G-Sirt5 eRNA in the presence or absence of doxicicline as indicated. End-point PCR is shown for the Tet On abundance of Sirt5 and Evf-2 eRNAs, respectively. E) Immunoblots for total CPS1 (upper panel) and glutaryl-lysine CPS1 (lower panel) in control and Sirt5 eRNA-depleted primary mouse hepatocytes. F) CPS1 enzyme activity was measure and normalized against the LNA control for luciferase. G) Immunohistochemical staining of NSUN7 from paraffin embedded liver sections from mice fed and fasted for 18 hours. qPCR analysis of NSun7 and Sirt1 mRNA of livers (large lobe) in control or fasted DBA mice (n=8). Enrichment of m5C-RNA was quantified by colorimetric analysis of m5C nuclear RNA following the same 18 hour fast. H) In our proposed model, upon PGC-1α methylation by SET7/9, the interaction with SAGA and Mediator is reinforced. NSUN7 methylation of eRNAs associated with PGC-1α target genes reinforces the stability of the eRNA-bound protein complex.

References

    1. Aubert B, Karyotakis Y, Lees JP, Poireau V, Prencipe E, Prudent X, Tisserand V, Garra Tico J, Grauges E, Martinelli M, et al. Search for dimuon decays of a light scalar boson in radiative transitions Upsilon-->gammaA0. Phys Rev Lett. 2009;103:081803. - PubMed
    1. Babitzke P. Regulation of transcription attenuation and translation initiation by allosteric control of an RNA-binding protein: the Bacillus subtilis TRAP protein. Curr Opin Microbiol. 2004;7:132–139. - PubMed
    1. Berger SL. Histone modifications in transcriptional regulation. Curr Opin Genet Dev. 2002;12:142–148. - PubMed
    1. Berger SL. The complex language of chromatin regulation during transcription. Nature. 2007;447:407–412. - PubMed
    1. Berghoff EG, Clark MF, Chen S, Cajigas I, Leib DE, Kohtz JD. Evf2 (Dlx6as) lncRNA regulates ultraconserved enhancer methylation and the differential transcriptional control of adjacent genes. Development. 2013;140:4407–4416. - PMC - PubMed

Publication types

MeSH terms