. 2016 Mar 15:424:34-41.
doi: 10.1016/j.mce.2016.01.011. Epub 2016 Jan 14.

1,25-Dihydroxyvitamin D induces the glutamate transporter SLC1A1 and alters glutamate handling in non-transformed mammary cells

Affiliations

1,25-Dihydroxyvitamin D induces the glutamate transporter SLC1A1 and alters glutamate handling in non-transformed mammary cells

Sarah Beaudin et al. Mol Cell Endocrinol. .

Abstract

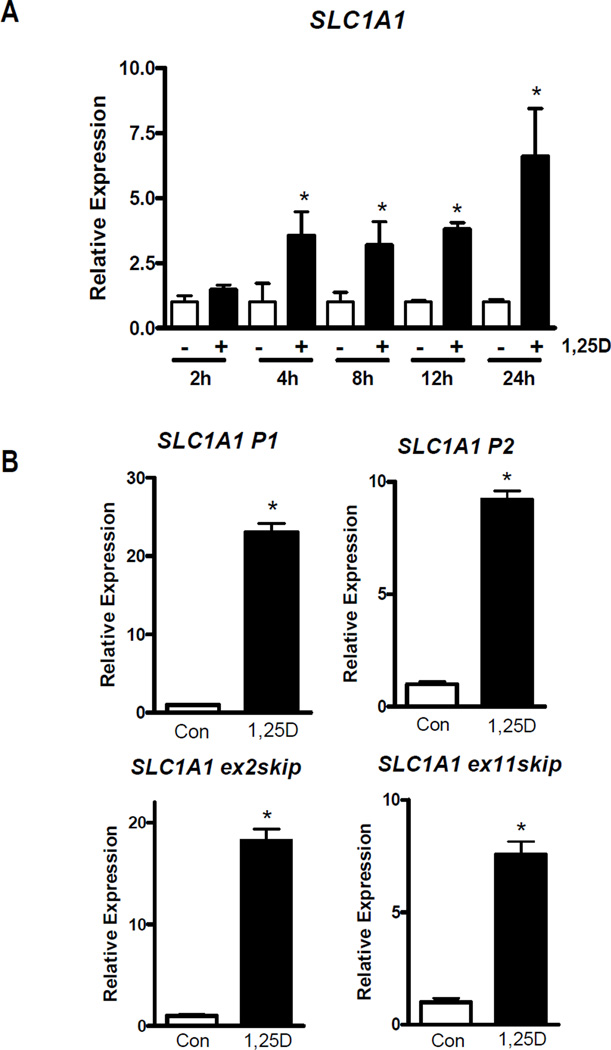
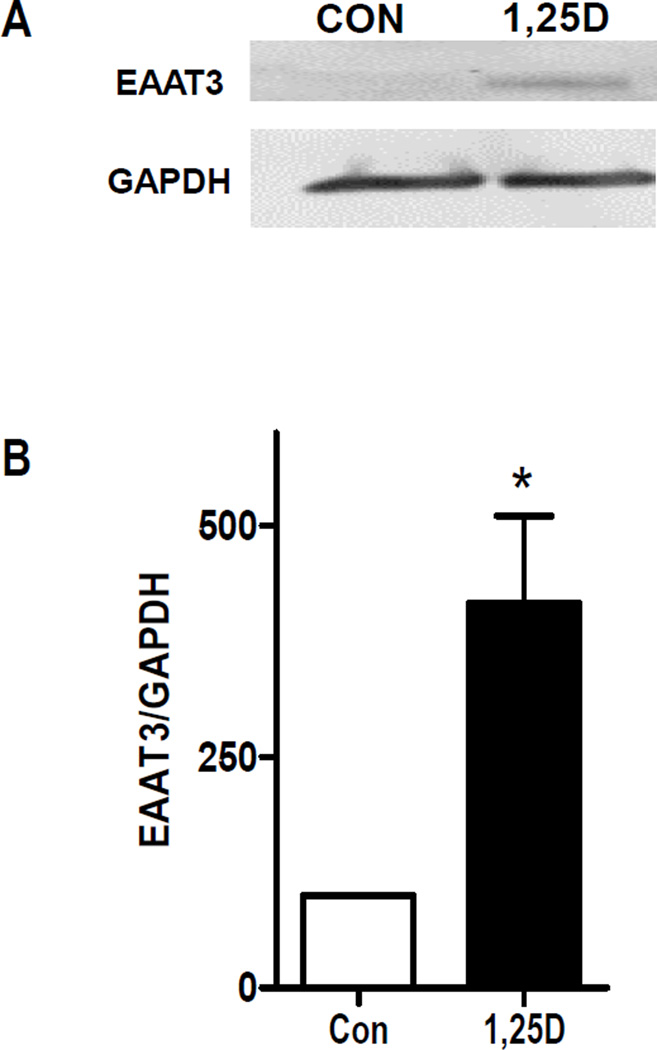
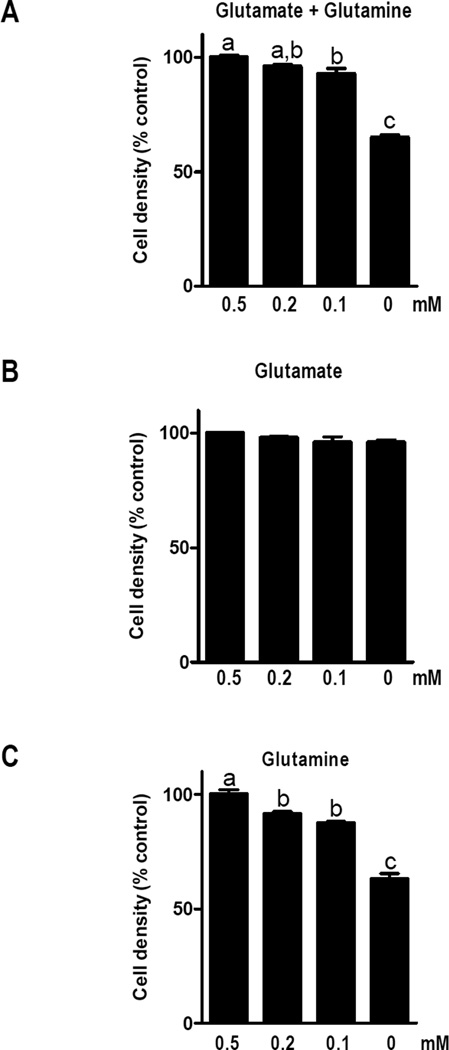
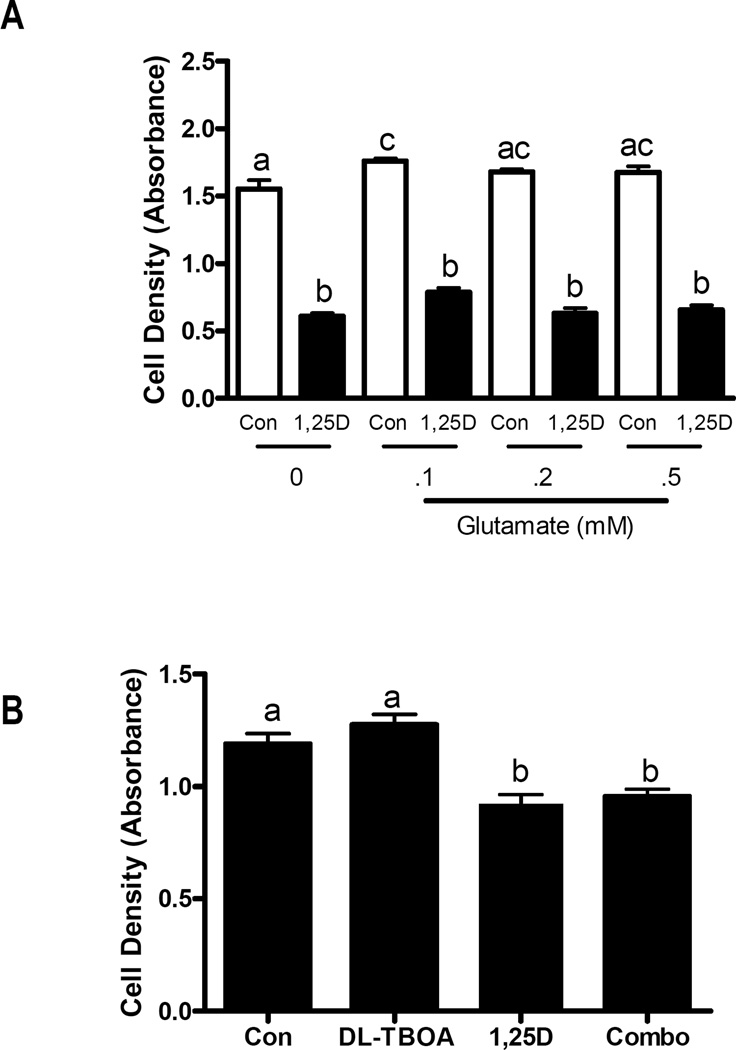
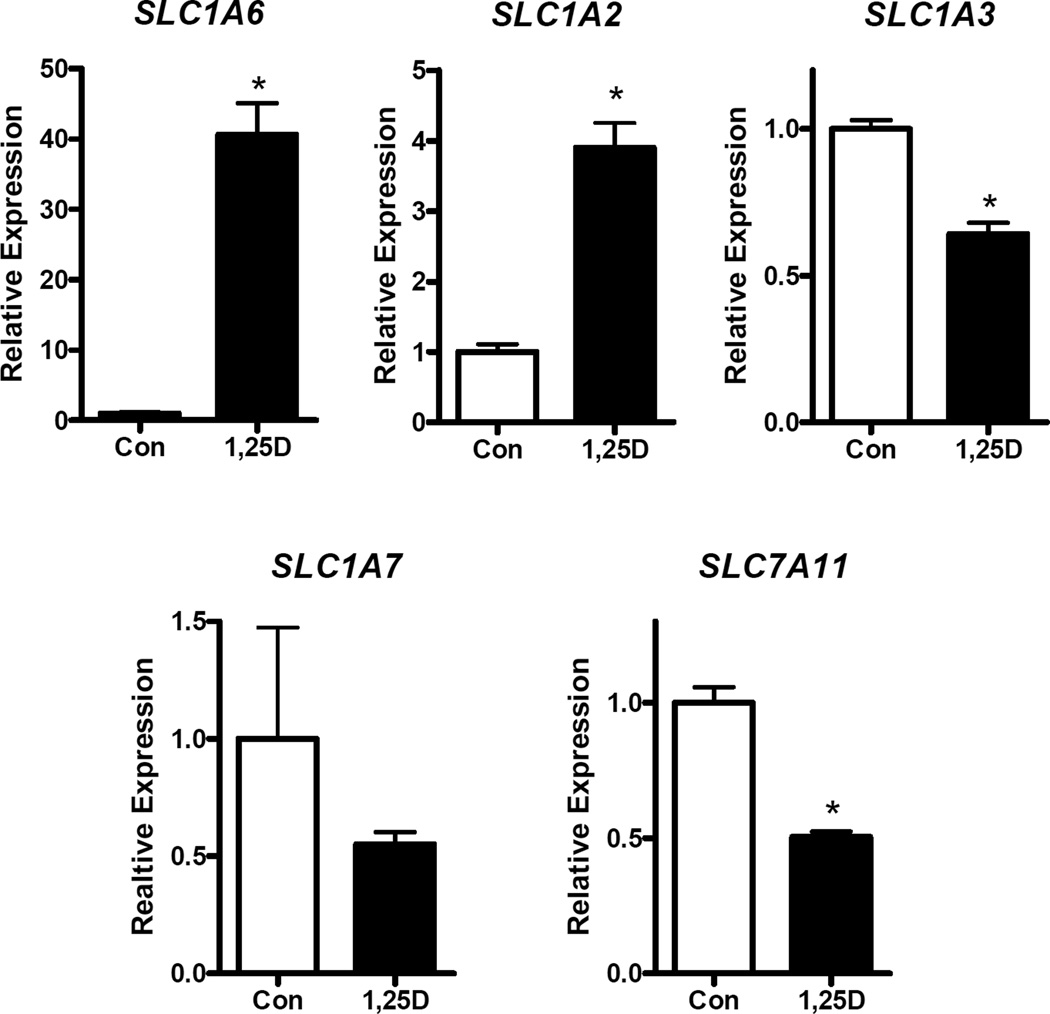
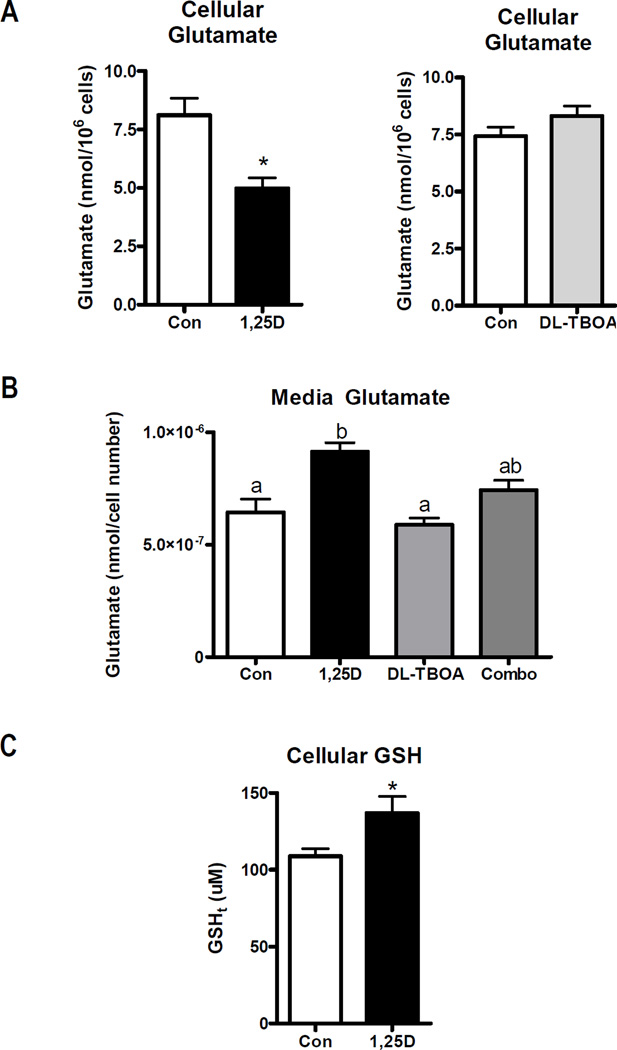
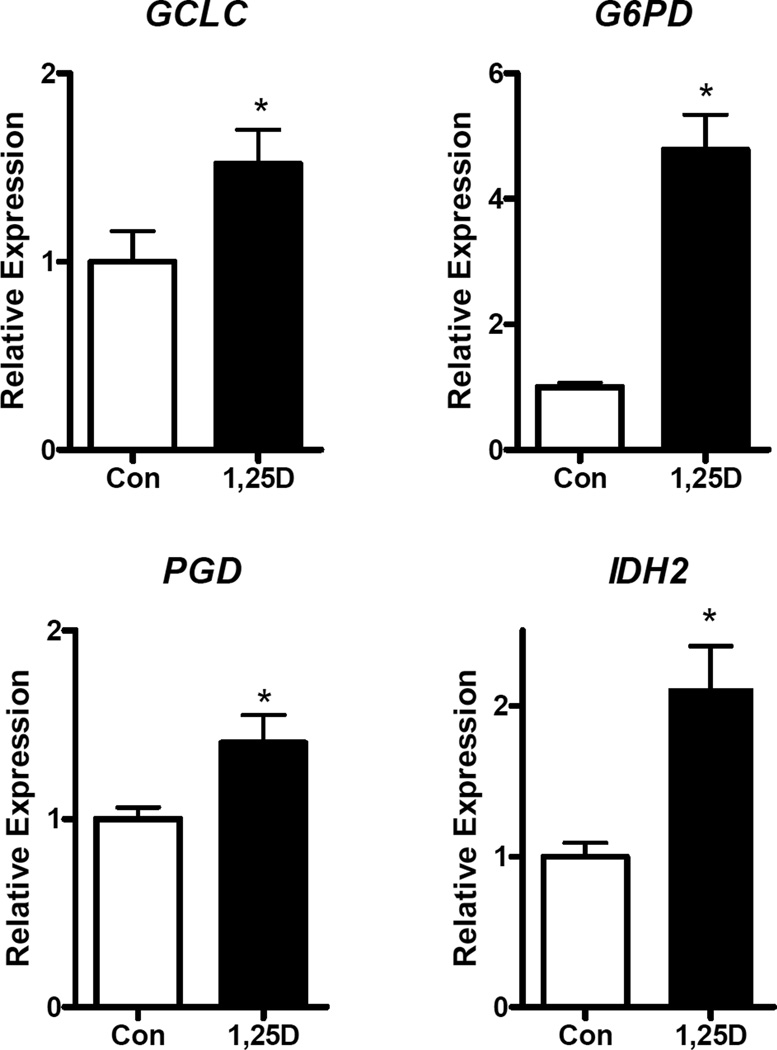
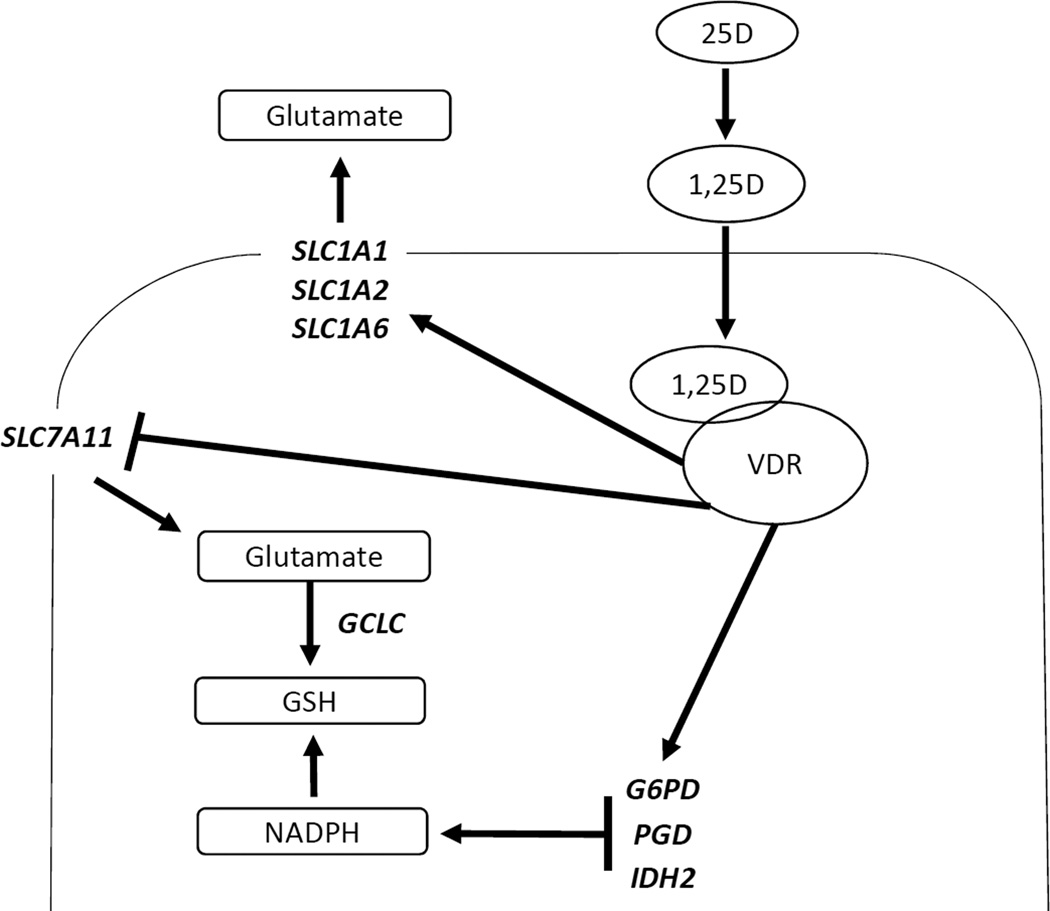
Genomic profiling of immortalized human mammary epithelial (hTERT-HME1) cells identified several metabolic genes, including the membrane glutamate transporter, SLC1A1, as 1,25-dihydroxyvitamin D3 (1,25D) regulated. In these studies we have surveyed the effects of 1,25D on known glutamate transporters and evaluated its impact on cellular glutamate handling. We confirm that expression of SLC1A1 and all of its known transcript variants are significantly upregulated in hTERT-HME1 cells following 1,25D treatment. Expression of the full-length cognate protein, EAAT3, is correspondingly increased in 1,25D treated hTERT-HME1 cells. Under the same conditions, the expression of two other glutamate transporters--SLC1A6 (EAAT4) and SLC1A2 (EAAT2 or GLT-1)--is enhanced by 1,25D while that of SLC1A3 (EAAT1 or GLAST) and SLC7A11 (xCT) is decreased. Glutamate is not essential for growth of hTERT-HME1 cells, and supplemental glutamate (up to 0.5 mM) does not abrogate the growth inhibitory effects of 1,25D. These data suggest that extracellular glutamate is not a major contributor to cellular energy metabolism in hTERT-HME1 cells under basal conditions and that the growth inhibitory effects of 1,25D are not secondary to its effects on glutamate handling. Instead, the effects of 1,25D on glutamate transporters translated to a decrease in cellular glutamate concentration and an increase in media glutamate concentration, suggesting that one or more of these transporters functions to export glutamate in response to 1,25D exposure. The reduced cellular glutamate concentration may also reflect its incorporation into the cellular glutathione (GSH) pool, which is increased upon 1,25D treatment. In support of this concept, the expression of GCLC (which codes for the rate-limiting enzyme in GSH synthesis) and genes which generate reducing equivalents in the form of NADPH (ie, G6PD, PGD, IDH2) are elevated in 1,25D-treated cells. Taken together, these data identify 1,25D as a physiological regulator of multiple membrane glutamate transporters that impacts on overall cellular glutamate handling.

Keywords: Glutamate; Glutamine; Glutathione; Mammary cells; Vitamin D.


Figures

Figure 1
Figure 1. Effect of 1,25D on SLC1A1 gene expression in hTERT-HME1 cells
A, hTERT-HME1 cells were treated with 100 nM 1,25D or ethanol vehicle for 2, 4, 8, 12 or 24 h after which RNA was isolated and analyzed by qPCR with primers that detect all SLC1A1 transcript variants. B, RNA isolated from cells treated with vehicle (Con) or 100 nM 1,25D for 24 h was analyzed with primers specific for transcripts arising from promoter 1 (P1), promoter 2 (P2) or those lacking exon 2 (ex2skip) or exon 11 (ex11skip). PCR data were normalized to 18S and expressed relative to control values at each time point which were set to 1. Each bar represents mean ± SD of three independent replicates analyzed in duplicate. *p < 0.05 as measured by one-tailed, unpaired student t-test.
Figure 2
Figure 2. Expression of EAAT3 in 1,25D-treated hTERT-HME1 cells
A, hTERT-HME1 cells were treated with 100 nM 1,25D or ethanol vehicle (Con) for 48 h. Whole cell lysates were analyzed by Western blotting with antibodies directed against EAAT3 or GAPDH. Blot represents one of three biological replicates. B, Quantitation of western blot data. Each bar represents mean ± SD of triplicates. *p <0.05 as measured by one-tailed, unpaired student t-test.
Figure 3
Figure 3. Effects of glutamate and glutamine on hTERT-HME1 cell density
Cells grown in complete media M171 for 24 h were switched to custom media containing indicated concentrations of glutamate and/or glutamate. Cell density was measured by crystal violet assay 96 h after media switch. Bars represent the mean ± SD of triplicates. Significance is indicated by letters above the bars: those bars annotated with different letters are significantly different (p<0.05) as assessed by one-way ANOVA and Tukey post-test.
Figure 4
Figure 4. Effects of 1,25D and DL-TBOA on hTERT-HME1 cell density
A, Cells grown in complete media M171 for 24 h were switched to custom media containing indicated concentrations of glutamate (0, 0.1, 0.2, or 0.5 mM) plus 100nM 1,25D or ethanol vehicle (Con). Cell density was measured after 96 h by crystal violet staining. Data is expressed as absorbance at 590nm which is proportional to cell density. B, Attached cells grown in complete media 171 for 24 h were treated with ethanol vehicle (Con), 100 nM 1,25D, 200 uM DL-TBOA, or the combination of 1,25D and DL-TBOA. After 96 h treatment, culture density was measured after 96 h by crystal violet staining. Data is expressed as absorbance at 590nm which is proportional to cell density. For both A and B, bars represent mean ± SD of triplicates. Significance is indicated by letters above the bars: those bars annotated with different letters are significantly different (p<0.05) as assessed by one-way ANOVA and Tukey post-test.
Figure 5
Figure 5. Effect of 1,25D on expression of additional glutamate transporters in hTERT-HME1 cells
RNA isolated from cells treated with vehicle (Con) or 100 nM 1,25D for 24 h was analyzed with primers specific for SLC1A6, SLC1A2, SLC1A3, SLC1A7 and SLC7A11. Data were normalized to 18S and expressed relative to control values which were set to 1. Each bar represents mean ± SD of three independent biological replicates analyzed in duplicate. *p <0.05 as measured by one-tailed, unpaired student t-test.
Figure 6
Figure 6. Effect of 1,25D on glutamate and GSH content
A, Cellular glutamate was measured in lysates from hTERT-HME1 cells treated with vehicle, 100 nM 1,25D or 200 uM DL-TBOA for 48 h. Cell numbers were significantly altered after 48 h of 1,25D treatment (Con, 6.1±0.4 × 10⁶ cells; 1,25D, 4.9±0.5 × 10⁶ cells; p<0.05), therefore data was normalized to 106 cells. B, Media collected from cells treated with 100 nM 1,25D ± 200 uM DL-TBOA for 48 h was analyzed for glutamate content which was expressed relative to culture density evaluated by crystal violet staining of the adherent cells. For both A and B, glutamate was determined with a kinetic colorimetric assay kit as described in methods. C, GSH content was measured in hTERT-HME1 cells treated with 100 nM 1,25D or ethanol vehicle (Con) for 48 h. 106 cells were deproteinated and analyzed with the Bioxytech GSH/GSSG-412 nm assay. For all graphs, bars represent the mean ± SD of triplicates. In A and C, significance was evaluated by one-tailed, unpaired student t-test; * p<0.05. In B, significance was evaluated by one-way ANOVA and Tukey post-test and is indicated by letters above the bars: those bars annotated with different letters are significantly different (p<0.05).
Figure 7
Figure 7. Effect of 1,25D on expression of GSH-related genes in hTERT-HME1 cells
RNA isolated from cells treated with vehicle (Con) or 100 nM 1,25D for 24 h was analyzed with primers specific for GCLC, G6PD, PGD and IDH2. Data were normalized to 18S and expressed relative to control values which were set to 1. Each bar represents mean ± SD of three independent biological replicates analyzed in duplicate. *p <0.05 as measured by one-tailed, unpaired student t-test.
Figure 8
Figure 8. Model depicting effects of 1,25D on glutamate metabolism in hTERT-HME1 cells
Circulating 25D is internalized and converted to 1,25D which binds VDR to trigger up-regulation of multiple plasma membrane glutamate transporters (SLC1A1, SLC1A2 and SLC1A6) and GSH and NADPH-producing metabolic enzymes (GCLC, G6PD, PGD, IDH2). Concomitantly, other glutamate exchangers (SLC7A11, SLC1A3) are down-regulated. The net result of these transcriptional changes is reduction of intracellular glutamate content, accumulation of glutamate in media and increased total glutathione (GSH) pool.

Similar articles

Cited by

References

    1. Chakrabarty K, Bhattacharyya S, Christopher R, Khanna S. Glutamatergic dysfunction in OCD. Neuropsychopharmacology. 2005 Sep;30(9):1735–1740. - PubMed
    1. Hynd MR, Scott HL, Dodd PR. Glutamate-mediated excitotoxicity and neurodegeneration in Alzheimer's disease. Neurochem Int. 2004 Oct;45(5):583–595. - PubMed
    1. Rzeski W, Turski L, Ikonomidou C. Glutamate antagonists limit tumor growth. Proc Natl Acad Sci U S A. 2001 May 22;98(11):6372–6377. - PMC - PubMed
    1. Cassago A, Ferreira AP, Ferreira IM, Fornezari C, Gomes ER, Greene KS, et al. Mitochondrial localization and structure-based phosphate activation mechanism of Glutaminase C with implications for cancer metabolism. Proc Natl Acad Sci U S A. 2012 Jan 24;109(4):1092–1097. - PMC - PubMed
    1. Budczies J, Pfitzner BM, Gyorffy B, Winzer KJ, Radke C, Dietel M, et al. Glutamate enrichment as new diagnostic opportunity in breast cancer. Int J Cancer. 2015 Apr 1;136(7):1619–1628. - PubMed

Publication types

MeSH terms