Review
. 2016 Mar;24(3):224-237.
doi: 10.1016/j.tim.2015.12.003. Epub 2016 Jan 13.

Network-Thinking: Graphs to Analyze Microbial Complexity and Evolution

Affiliations
Review

Network-Thinking: Graphs to Analyze Microbial Complexity and Evolution

Eduardo Corel et al. Trends Microbiol. 2016 Mar.

Abstract

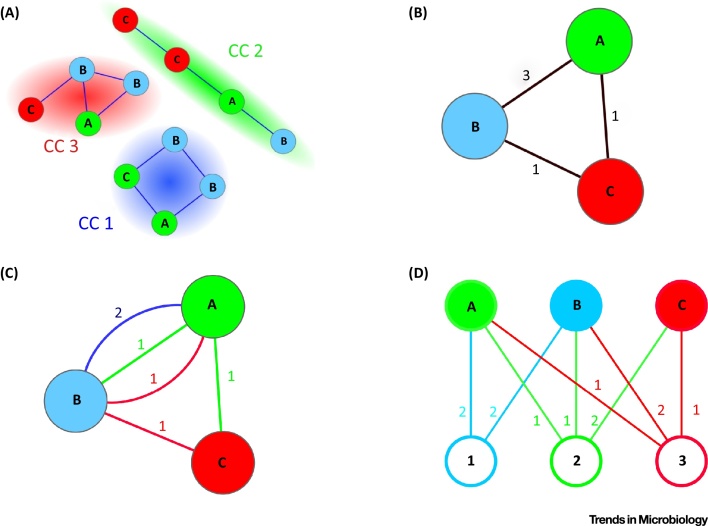
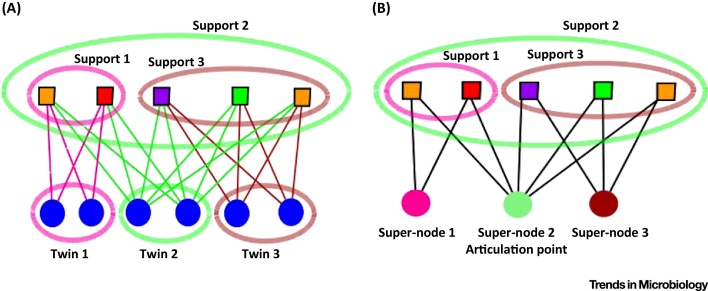
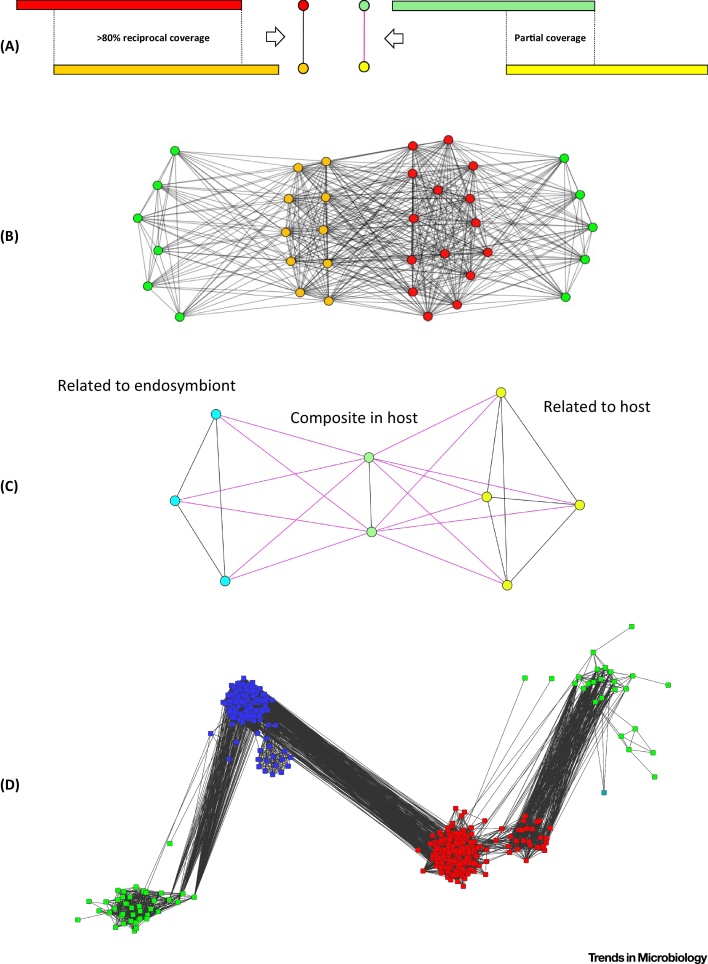
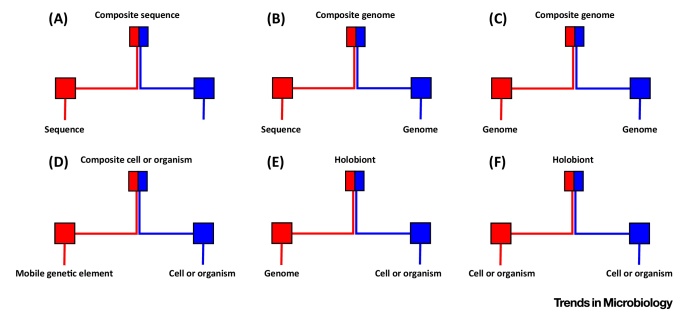
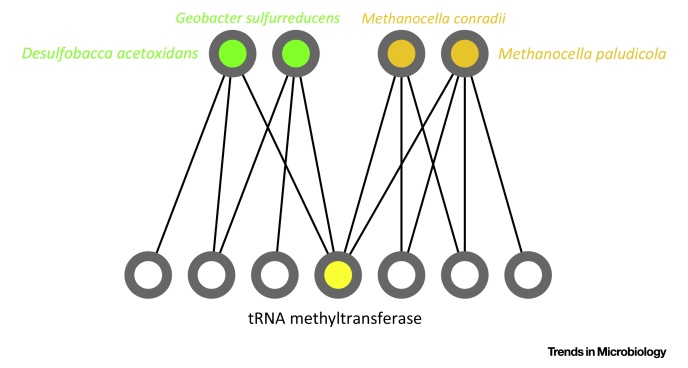
The tree model and tree-based methods have played a major, fruitful role in evolutionary studies. However, with the increasing realization of the quantitative and qualitative importance of reticulate evolutionary processes, affecting all levels of biological organization, complementary network-based models and methods are now flourishing, inviting evolutionary biology to experience a network-thinking era. We show how relatively recent comers in this field of study, that is, sequence-similarity networks, genome networks, and gene families-genomes bipartite graphs, already allow for a significantly enhanced usage of molecular datasets in comparative studies. Analyses of these networks provide tools for tackling a multitude of complex phenomena, including the evolution of gene transfer, composite genes and genomes, evolutionary transitions, and holobionts.

Keywords: bipartite graph; evolution; gene transfer; graph theory; introgression; symbiosis.


Figures

Figure 1
Figure 1
Key Figure: Different Graph Representations of the Same Gene Sharing among Genomes (A) Sequence-similarity network (SSN): each node (circle) represents a protein-coding gene sequence; the color and the label of the node represent the genome where the gene is found. Two nodes are connected by an edge (a line linking two nodes) if the pair of sequences fulfills given similarity criteria such as a minimum percentage identity and coverage (i.e., the ratio between the length of the matching parts and the total length of any two sequences). Sequence-similarity networks are analyzed as a partition into connected components (CCs, highlighted as color halos). This partition defines groups of putative gene families, when reciprocal sequence coverage and identity percentage are high : for instance, we can interpret CC1 as a gene family for which two copies are present both in genomes A and B. (B) Genome networks (GNs) can be obtained from SSNs: nodes are genomes (described by color and label); edges connect genomes that share at least one gene family; GNs can be weighted: weights count the number of gene families shared by the two genomes. In the example, A and B share three gene families, but the graph does not specify which ones. (C) Multiplexed networks (MNs) can be, in turn, obtained from GNs by labelling edges in order to identify what gene families are shared: nodes represent genomes; multi-edges represent distinct shared gene families (same color code as the CCs in the SSN); weights count the number of shared genes in each family: the blue edge between A and B corresponds to CC1 in (A) and has therefore weight 2. (D) Bipartite graphs can also be obtained from SSNs; top nodes are genomes; bottom nodes are gene families; edges connect a genome to a gene family if that genome contains at least one representative of the corresponding gene family; weights count the number of genes of that family present in that genome: in the example, node 1 corresponds to CC1 in (A), and has therefore edges incident to genomes A and B, each of weight 2.
Figure 2
Figure 2
Twins and Articulation Points in a Bipartite Graph. (A) Top nodes in this bipartite graph are genomes and bottom nodes gene families. Nodes in each colored ellipse at the bottom form a twin class, since their sets of neighbors (supports encircled by similarly colored ellipses on the top level) are identical (as highlighted by the coloring of their incident edges). (B) Collapsing twin nodes into super-nodes yields a reduced graph, without further bottom twin nodes. The supported groups of host genomes are unchanged, and are now defined as the neighbors of a single super-node. Due to the graph reduction, the green super-node is now an articulation point, since its removal disconnects the nodes in the pink and brown supports.
Figure 3
Figure 3
Typical Patterns for Candidate Endosymbiotic Gene Transfer (EGT) and Composite Genes in Sequence-Similarity Networks. (A) Sequence-similarity networks can be used for the detection of distant homologues in eukaryotic genomes. Complete (left) and partial (right) sequence similarity, and how they are translated as different types of edges in the sequence-similarity network (SSN). In black, the percentage of reciprocal cover is high; the sequences are homologous over their entire length. In purple, the cover percentage is low; the sequences are only partly similar, that is, they share a homologous domain. (B) Shortest-path analysis in a sequence-similarity graph can be used for detecting possible endosymbiotic gene transfer (EGT). Indeed, EGT results in a characteristic network pattern: an indirect short path along which all edges indicate homology, connecting two nodes corresponding to diverged sequences present in a given host organism. Green nodes represent eukaryotic sequences; red, bacterial sequences; and yellow, archaeal sequences. Black edges denote complete sequence similarity (>80% length). All shortest paths between eukaryotic sequences that pass through the bacterial and archaeal components are likely candidates for EGT, because this indicates that a first type of eukaryotic sequence has affinities to bacterial sequences while a second type has affinities to archaeal ones. (C) Sequence-similarity networks with edges for complete and partial coverage are also useful for the detection of composite genes. The figure shows a pattern associated with the detection of composite genes. Black edges denote complete (>80% cover) and purple edge denote partial (<80% cover) sequence similarity. The green family is a candidate symbiogenetic composite gene, derived from endosymbiotic lateral gene transfer, since it displays one part with similarity to host-related sequences (yellow) and another part with similarity to endosymbiont-related (blue) genes. (D) A concrete example of a possible EGT: archaeal sequences are represented in blue, eubacterial in red, and eukaryotic genes in green (there is also a single plasmidic sequence in blue-green on the right). Eukaryotic sequences clearly form two groups, one closer to archaea, one more related to eubacteria. All the sequences have a generic annotation as RNA-pseudouridine synthase, but while the eubacterial (and related eukaryotic) sequences are exclusively tRNA synthases (thus putatively of mitochondrial origin), on the archaeal side (thus possibly of host origin) we find tRNA- as well as rRNA-pseudouridine synthases. It indeed turns out that this family contains two pseudouridine synthase genes that are both present in Saccharomyces cerevisiae, having a similar function but acting on a different substrate: one on the archaeal side, coding for Cbf5p that acts on large and small rRNA , , and the other on the eubacterial side, coding for Pus4, that acts on mitochondrial and cytoplasmic tRNA-uridine .
Figure I
Figure I
Several Illustrations of Mosaicism through Merging Events. (A) Composite genes result from the fusion of different gene domains. (B) Composite genomes can result from the introgression of a gene into a genome, or (C) from the introgression of a genome into a genome. (D) Composite organisms can arise from the introgression of a mobile genetic element. Holobionts result from the introgression of a genome (E) or of another cell (F) into a cell.
Figure I
Figure I
Excerpt of a Typical Reduced Gene Familes–Genomes Bipartite Graph around an Articulation Point. The top nodes compose the club defined by the sharing of a conserved tRNA methyltransferase (bottom node in yellow). For simplicity, only the direct neighbors of the members of the club have been included in the picture of the graph. The removal of the articulation point (in yellow) isolates the two taxonomically homogeneous groups from each other.

References

    1. Darwin C. John Murray; 1859. On the Origin of Species by Means of Natural Selection.
    1. O’Hara R.J. Population thinking and tree thinking in systematics. Zool. Scr. 1997;26:323–329.
    1. Doolittle W.F., Bapteste E. Pattern pluralism and the Tree of Life hypothesis. Proc. Natl. Acad. Sci. U.S.A. 2007;104:2043–2049. - PMC - PubMed
    1. Bapteste E. Evolutionary analyses of non-genealogical bonds produced by introgressive descent. Proc. Natl. Acad. Sci. U.S.A. 2012;109:18266–18272. - PMC - PubMed
    1. Doolittle W.F. Phylogenetic classification and the universal tree. Science. 1999;284:2124–2129. - PubMed

Publication types

LinkOut - more resources