. 2016 Jan 21;7(1):e2057.
doi: 10.1038/cddis.2015.418.

Interleukin-33 enhances programmed oncosis of ST2L-positive low-metastatic cells in the tumour microenvironment of lung cancer

Affiliations

Interleukin-33 enhances programmed oncosis of ST2L-positive low-metastatic cells in the tumour microenvironment of lung cancer

M Akimoto et al. Cell Death Dis. .

Abstract

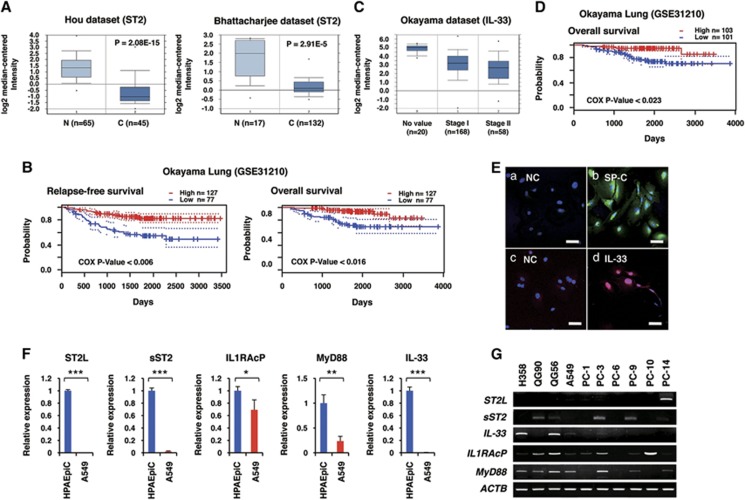
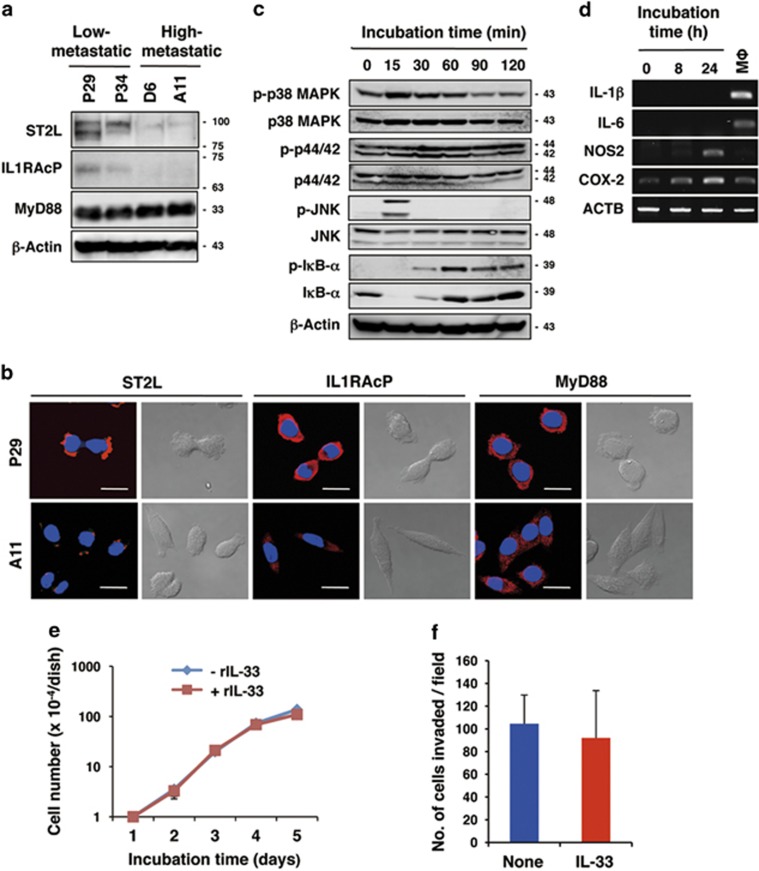
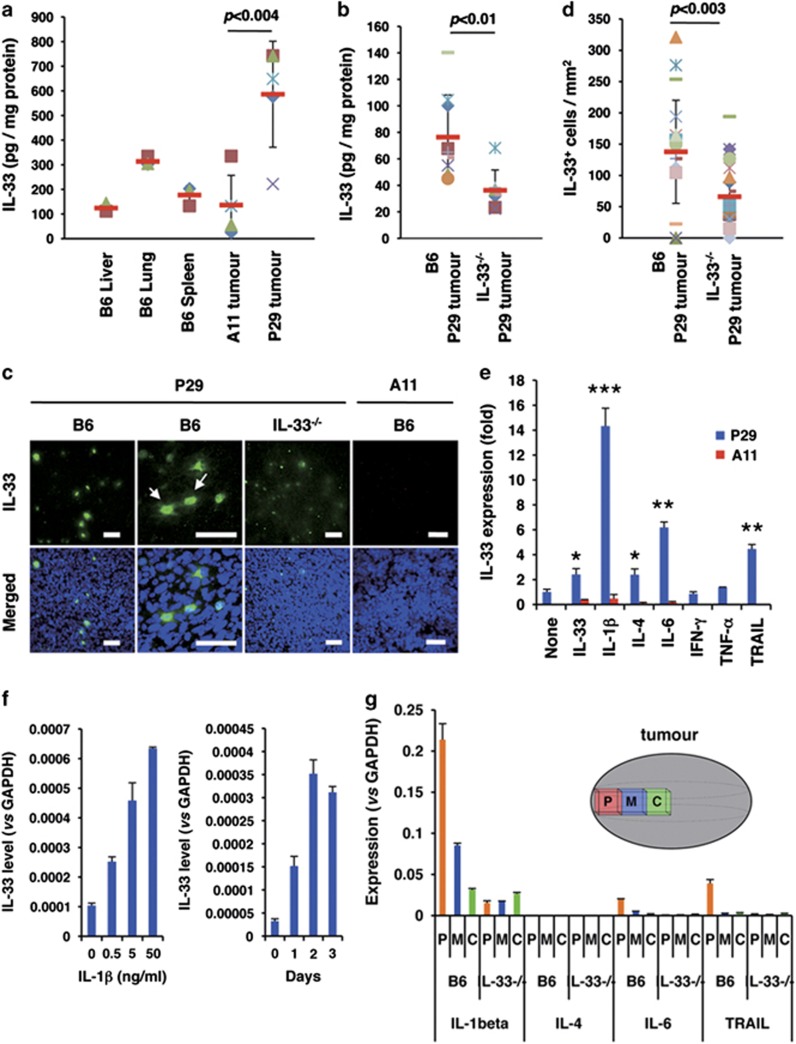
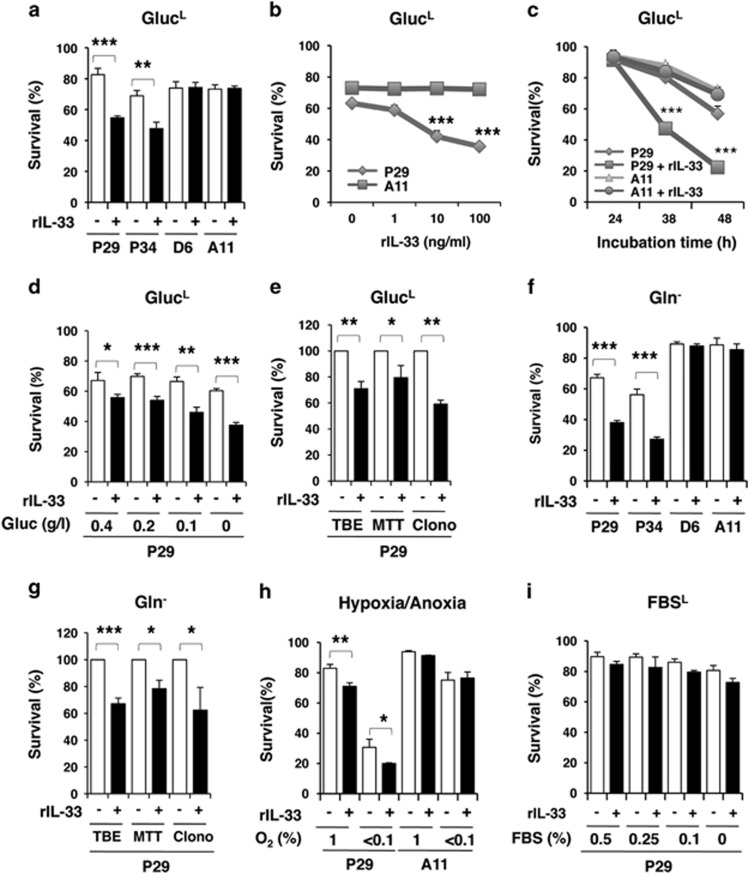
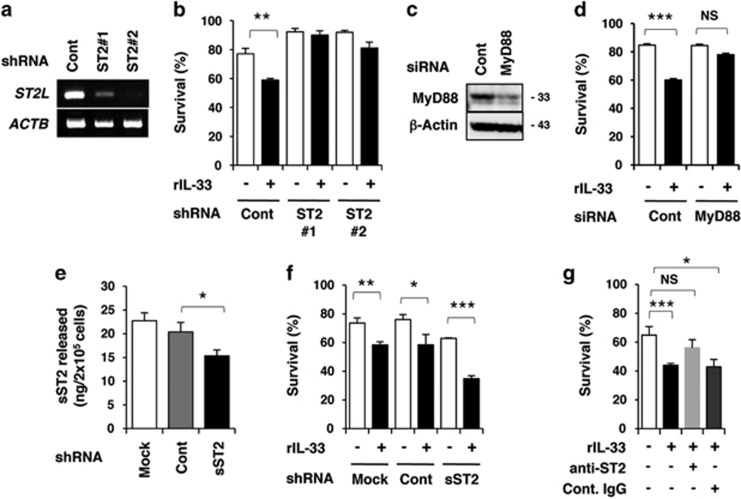
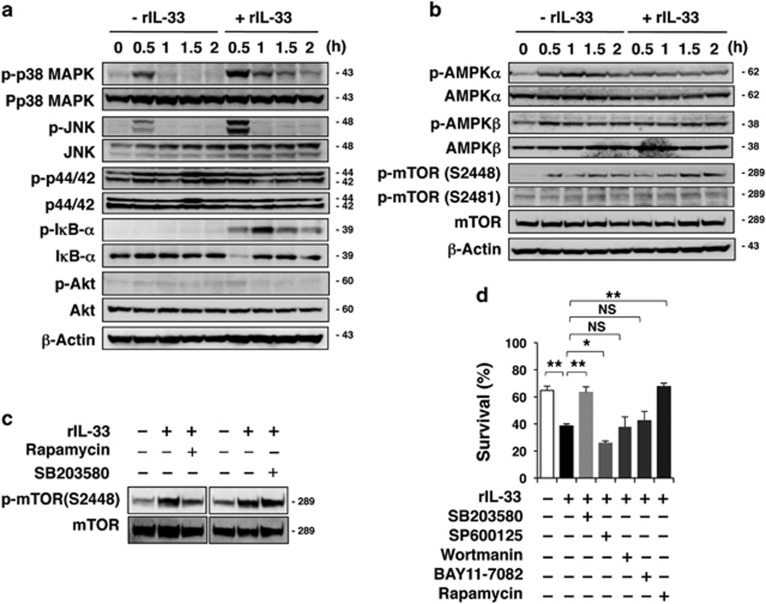
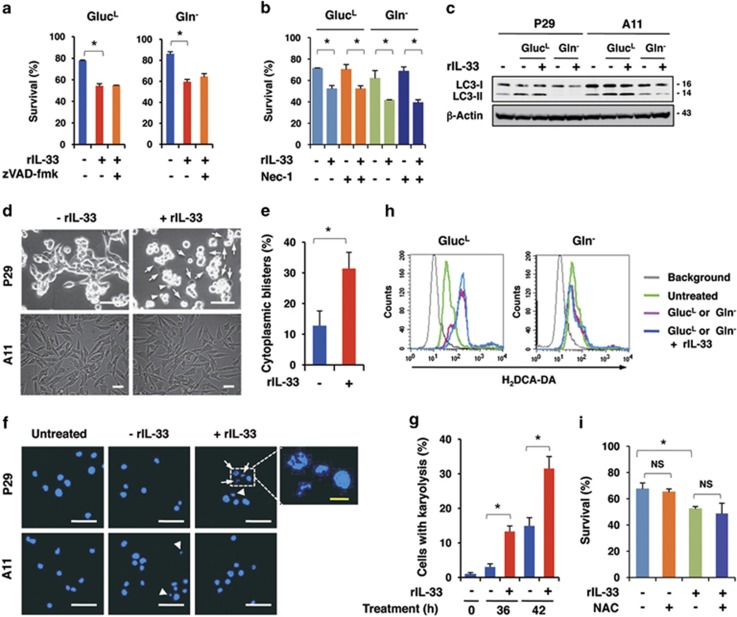
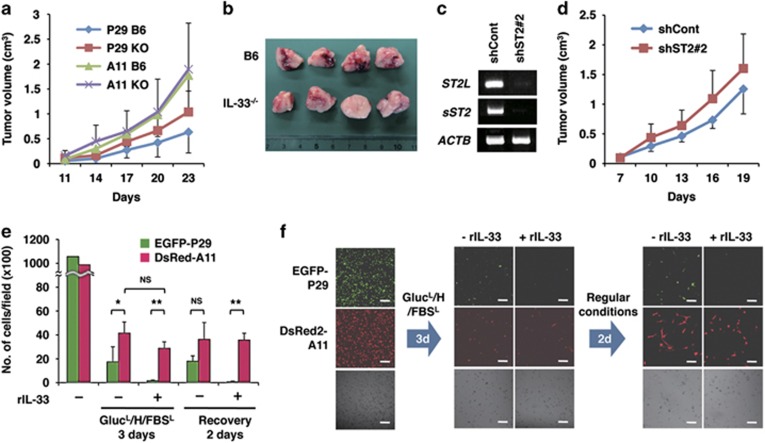
The proinflammatory interleukin-33 (IL-33) binds to its receptor ST2L on the surface of immune cells and stimulates the production of Th2 cytokines; however, the effects of IL-33 on tumour cells are poorly understood. Here we show that ST2 was significantly downregulated in human lung cancer tissues and cells compared with normal lung tissues and cells. IL-33 expression was also inversely correlated with the stages of human lung cancers. In accordance with this finding, low-metastatic cells but not high-metastatic cells derived from Lewis lung carcinoma expressed functional ST2L. IL-33 was abundantly present in the tumours established by the low-metastatic cells compared with those formed by the high-metastatic cells. Although the low-metastatic cells scarcely expressed IL-33 in vitro, these cells did expry 6ess this molecule in vivo, likely due to stimulation by intratumoural IL-1β and IL-33. Importantly, IL-33 enhanced the cell death of ST2L-positive low-metastatic cells, but not of ST2L-negative high-metastatic cells, under glucose-depleted, glutamine-depleted and hypoxic conditions through p38 MAPK and mTOR activation, and in a mitochondria-dependent manner. The cell death was characterised by cytoplasmic blisters and karyolysis, which are unique morphological features of oncosis. Inevitably, the low-metastatic cells, but not of the high-metastatic cells, grew faster in IL-33(-/-) mice than in wild-type mice. Furthermore, IL-33 selected for the ST2L-positive, oncosis-resistant high-metastatic cells under conditions mimicking the tumour microenvironment. These data suggest that IL-33 enhances lung cancer progression by selecting for more malignant cells in the tumour microenvironment.


Figures

Figure 1
Figure 1
Expression of ST2 in human normal lung tissues and lung cancers. (A) ST2 expression in lung adenocarcinomas (C) and in the adjacent normal lung tissues (N) based on the Hou and Bhattacharjee lung data sets in Oncomine database (Compendia Bioscience, Ann Arbor, MI, USA). (B) Correlation between ST2 expression and relapse-free survival, and overall survival in lung cancer patients. The data are based on the Okayama lung data set in PrognoScan database (http://www.prognoscan.org). (C) IL-33 expression in lung adenocarcinomas of different cancer stages based on the Okayama lung data set in Oncomine database. (D) Correlation between IL-33 expression and overall survival in lung cancer patients. The data are based on the Okayama lung data set in PrognoScan database. (E) Immunofluorescence staining of surfactant protein C (SP-C) and IL-33 in HLAEpiC cells. The nuclei were counterstained with DAPI. (a) Negative control (NC) for (b). Second antibody only; (b) SP-C. (c) NC for (d). (d) IL-33. Scale bars, 50 μm. (F) qRT-PCR analysis of the expression of ST2L-related molecules in HLAEpiC cells and in human adenocarcinoma A549 cells. *P<0.05; **P<0.002; ***P<0.0001. (G) RT-PCR analysis of the expression of IL-33/ST2L-related genes in human lung cancer cell lines. Adenocarcinomas: A549, PC-9 and PC-14 cells; squamous carcinoma: QG56, PC-1 and PC-10 cells; small-cell lung carcinoma: QG90 and PC-6 cells; bronchoalveolar cancer: H358 cells
Figure 2
Figure 2
Expression of functional ST2L in the low-metastatic, but not in the high-metastatic, 3LL cells. (a) Western blot analysis of ST2L, IL-1RAcP and MyD88 protein expression. β-Actin served as the loading control. (b) Immunofluorescent staining of ST2L, IL-1RAcP and MyD88. Scale bars, 50 μm. The nuclei were counterstained with DAPI. (c) Activation of IL-33/ST2L signalling molecules in IL-33-treated P29 cells. P29 cells were treated with 100 ng/ml rIL-33 for the indicated times. β-Actin served as the loading control. *Note that rapid and transient IkB-α reduction was repeatedly observed after the rIL-33 treatment; the reason for this is unknown. See also Figure 6a and Supplementary Figure S4. (d) RT-PCR analysis of the mRNA expression of NF-κB target genes in IL-33-treated P29 cells. P29 cells were treated with 100 ng/ml rIL-33 for the indicated times. Thioglycollate-elicited mouse peritoneal macrophages (Mφ) were used as the control. (e) In vitro growth of P29 cells cultured in the presence or absence of rIL-33 (100 ng/ml) in the regular medium. (f) Invasive ability of P29 cells treated with rIL-33 (100 ng/ml) for 2 days. The number of invaded cells per field is shown (n=6). Bars, S.D. Western blot images (a and c) have been cropped for presentation. Uncropped images are provided in Supplementary Figure 16
Figure 3
Figure 3
IL-33 content and IL-33-positive cells in P29 subcutaneous tumours. (a) IL-33 content in the lysates of normal tissues (liver, lung and spleen; n=3), A11 tumour tissues (n=5) and P29 tumour tissues (n=5). Bars, S.D. (b) IL-33 content in P29 tumour tissues established in B6-wild-type and in IL-33−/− mice. (c) IL-33-positive cells in P29 tumours. Cryosections of P29 and A11 tumours were stained with the goat anti-IL-33 antibody followed by Alexa Fluor 488-conjugated chicken anti-goat IgG. The nuclei were counterstained with DAPI. The arrows show the cells with cytoplasmic and nuclear IL-33 staining. Scale bars, 50 μm. (d) The number of IL-33-positive cells per field (1 mm2) in P29 tumour tissues established in B6-wild-type and in IL-33−/− mice. n=20. (e) The effect of various cytokines on IL-33 expression in P29 and A11 cells. The cells were treated with vehicle alone, rIL-33 (10 ng/ml), rIL-1β (10 ng/ml), rIL-4 (10 ng/ml), rIL-6 (10 ng/ml), rIFN-γ (10 ng/ml), rTNF-α (10 ng/ml) and rTRAIL (10 ng/ml) for 2 days. Total RNA was isolated and subjected to qRT-PCR. Bars: SD; *P<0.002; **P<0.0002; ***P<0.0001. (f) Effect of rIL-1β on IL-33 mRNA expression in P29 cells. P29 cells were treated with rIL-1β at various concentrations for 2 days (left) or at 10 ng/ml for up to 3 days (right). Total RNA was isolated and subjected to qRT-PCR analysis. (g) Expression of the cytokines in P29 tumours. The peripheral (P), middle (M) and central (C) regions of P29 tumours established in B6-wild-type and in IL-33−/− mice were resected, and the total RNA isolated from each region was subjected to qRT-PCR. Bars, S.D.
Figure 4
Figure 4
Enhancement of the cell death of the low-metastatic cells, but not the high-metastatic cells, after treatment with rIL-33 in nutrients-depleted medium and under hypoxic conditions. Cell viability was evaluated using the trypan blue exclusion (TBE) test unless otherwise indicated. (a) The low-metastatic (P29 and P34) and the high-metastatic (D6 and A11) cells were treated with rIL-33 (100 ng/ml) for 42 h in glucose-depleted (0.1 g/l; GlucL) medium. (b) P29 and A11 cells were treated with various concentrations of rIL-33 for 42 h in GlucL medium. (c) P29 and A11 cells were treated with rIL-33 (100 ng/ml) for various periods in GlucL medium. (d) P29 cells were treated with rIL-33 (100 ng/ml) for 42 h in medium containing various concentrations of glucose (0–0.4 g/l). (e) P29 cells were treated with rIL-33 (100 ng/ml) for 42 h in GlucL medium. Cell viability was assessed by TBE test, MTT assay and clonogenic assay (Clono). (f) P29, P34, D6 and A11 cells were treated with rIL-33 (100 ng/ml) for 28 h in Gln medium. (g) P29 cells were treated with rIL-33 (100 ng/ml) for 28 h in Gln medium. Cell viability was assessed as described in (e). (h) P29 and A11 cells were treated with rIL-33 (100 ng/ml) for 42 h under hypoxic (1% O2) or anoxic (<0.1% O2) conditions. (i) P29 cells were treated with rIL-33 (100 ng/ml) for 42 h under FBS-depleted (0–0.5% FBSL) conditions. Bars, S.D.; *P<0.05; **P<0.003; ***P<0.001
Figure 5
Figure 5
Involvement of ST2L in the IL-33-enhanced cell death of P29 cells. The cells were cultured for 38 h in the presence or absence of rIL-33 (100 ng/ml) in glucose-depleted (0.1 g/l; GlucL) medium. Cell viability was evaluated using the trypan blue exclusion test. (a) RT-PCR analysis of ST2L mRNA expression in P29 cells stably expressing control shRNA (shCont) and ST2L shRNA (shST2L #1 and #2). β-Actin (ACTB) served as the control. (b) Sensitivity of shCont, shST2L #1 and shST2L #2 cells to rIL-33 (100 ng/ml). (c) Western blot analysis of the expression of MyD88 protein in P29 cells transiently transfected with control siRNA (siCont) or with MyD88 siRNA (siMyD88). Western blot images have been cropped for presentation. Uncropped images are provided in Supplementary Figure 16. (d) Sensitivity of siCont and siMyD88 cells to rIL-33 (100 ng/ml). (e) Secretion of sST2 by P29 cells stably expressing control shRNA or sST2 shRNA. The indicated cells were cultured for 24 h and the amount of sST2 in the conditioned medium was quantified by ELISA. (f) Sensitivity of shCont and shsST2 cells to rIL-33 (100 ng/ml). (g) Effect of an anti-ST2 antibody on the sensitivity of P29 cells to rIL-33 (100 ng/ml). P29 cells were cultured in the presence of control goat IgG or anti-ST2 antibody (1 μg/ml). Bars, S.D. *P<0.04; **P<0.01; ***P<0.001. NS, not significant
Figure 6
Figure 6
Analysis of IL-33/ST2L signalling pathways involved in IL-33-enhanced P29 cell death. (ac) Western blot analysis of the effect of IL-33 on the phosphorylation of signalling molecules in P29 cells. P29 cells were cultured with rIL-33 (100 ng/ml) in glucose-depleted (0.1 g/l; GlucL) medium for the indicated times (a and b) or for 1 h (c). β-Actin served as the loading control. (d) Effect of various inhibitors on rIL-33-enhanced cell death. P29 cells were cultured with rIL-33 (100 ng/ml) in GlucL medium for 42 h with SB203580 (20 μM), SP600125 (20 μM), wortmannin (10 μM), BAY11-7082 (5 μM) or rapamycin (1 μM). Vehicle (DMSO) was added to the control culture. Cell viability was evaluated using the trypan blue exclusion test. Bars; S.D.; *P<0.005: **P<0.002. NS, not significant. Western blot images (a–c) have been cropped for presentation. Uncropped images are provided in Supplementary Figure 16
Figure 7
Figure 7
Induction of oncosis in IL-33-treated P29 cells under glucose-depleted conditions. (a) Effect of zVAD-fmk on rIL-33-induced cell death. P29 cells were treated with or without zVAD-fmk (10 μM) in the presence or absence of rIL-33 (100 ng/ml) under GlucL or Gln conditions for 42 or 28 h, respectively. Bars, S.D.; *P<0.002. (b) Effect of necrostatin-1 on rIL-33-induced cell death. P29 cells were treated with or without necrostatin-1 (Nec-1; 10 μM) in the presence or absence of rIL-33 (100 ng/ml) in GlucL medium or in Gln medium for 42 or 28 h, respectively. Bars, S.D. *P<0.002. (c) Conversion of LC3-I to LC3-II. P29 and A11 cells were incubated in the presence or absence of rIL-33 (100 ng/ml) under GlucL or Gln conditions for 42 or 28 h, respectively. (d) Appearance of cells with cytoplasmic blisters. P29 and A11 cells were treated with or without rIL-33 (100 ng/ml) for 40 h in glucose-depleted (0.1 g/l; GlucL) medium. Arrows and arrowheads indicate the cells with blisters and those cells with blebs, respectively. Scale bars, 50 μm. (e) Percentage of cells with cytoplasmic blisters. P29 cells were treated with or without rIL-33 (100 ng/ml) for 36 h in GlucL medium. Bars, S.D. *P<0.002. (f) Appearance of the cells with karyolysis. P29 and A11 cells were treated with or without rIL-33 (100 ng/ml) for 42 h in GlucL medium. The nuclei were stained with DAPI. Arrows and arrowheads indicate cells with karyolysis and with apoptotic nuclei, respectively. Scale bars, 100 μm (white); 5 μm (yellow). (g) Percentage of cells with karyolysis. P29 cells were treated with or without rIL-33 (100 ng/ml) for 36 or 42 h in GlucL medium. Bars, S.D. *P<0.002. (h) Effect of rIL-33 on ROS production in P29 cells. P29 cells were cultured with or without rIL-33 (100 ng/ml) in GlucL or Gln medium for 30 or 20 h, respectively. ROS production was measured by flow cytometry after staining the cells with H2DCF-DA. (i) Effect of N-acetylcysteine (NAC) on rIL-33-induced cell death. P29 cells were cultured with rIL-33 (100 ng/ml) in the presence or absence of NAC (10 mM) for 42 h. *P<0.003. NS, not significant
Figure 8
Figure 8
IL-33 suppresses P29 tumour growth and stimulates A11 selection under conditions mimicking the tumour microenvironment. (a) Tumour growth of P29 and A11 cells in B6-wild-type and in IL-33−/− mice. P29 and A11 cells (1 × 10⁵ cells) were subcutaneously injected into B6-wild-type (B6) and IL-33−/− (KO) mice. n=7. Bars, S.D. (b) Gross observation of P29 tumours established by P29 cells in B6-wild-type and IL-33−/− mice. The tumours were divided into two equal portions, and the divided faces are shown. (c) RT-PCR analysis of the expression of ST2L and sST2 in P29 cells stably expressing control shRNA (shCont) and ST2 shRNA (shST2 #2). (d) shCont and shST2 #2 cells (4 × 10⁵ cells) were subcutaneously injected in B6 mice. n=7. Bars, S.D. (e) Effect of rIL-33 on A11 cell selection. A 1 : 1 mixture of EGFP-P29 and DsRed-A11 cells was cultured with or without rIL-33 (100 ng/ml) for 3 days under GlucL/H/FBSL conditions and then for an additional 2 days in regular medium (recovery). Bars, S.D. *P<0.01; **P<0.001. NS, not significant. (f) rIL-33 stimulation of an A11 selection under conditions mimicking the tumour microenvironment. A 1 : 1 mixture of EGFP-P29 and DsRed-A11 cells was cultured as described in (e). The cells were observed under a confocal laser microscope. Bars, 100 μm

References

    1. Schmitz J, Owyang A, Oldham E, Song Y, Murphy E, McClanahan TK et al. IL-33, an interleukin-1-like cytokine that signals via the IL-1 receptor-related protein ST2 and induces T helper type 2-associated cytokines. Immunity 2005; 23: 479–490. - PubMed
    1. Onda. H, Kasuya H, Takakura K, Hori T, Imaizumi T, Takeuchi T et al. Identification of genes differentially expressed in canine vasospastic cerebral arteries after subarachnoid hemorrhage. J Cereb Blood Flow Metab 1999; 19: 1279–1288. - PubMed
    1. Baekkevold ES, Roussigné M, Yamanaka T, Johansen FE, Jahnsen FL, Amalric F et al. Molecular characterization of NF-HEV, a nuclear factor preferentially expressed in human high endothelial venules. Am J Pathol 2003; 163: 69–79. - PMC - PubMed
    1. Moussion C, Ortega N, Girard JP. The IL-1-like cytokine IL-33 is constitutively expressed in the nucleus of endothelial cells and epithelial cells in vivo: a novel ‘alarmin'? PLoS ONE 2008; 3: e3331. - PMC - PubMed
    1. Miller AM, Xu D, Asquith DL, Denby L, Li Y, Sattar N et al. IL-33 reduces the development of atherosclerosis. J Exp Med 2008; 205: 339–346. - PMC - PubMed

Publication types