. 2016 Aug 18;35(33):4345-57.
doi: 10.1038/onc.2015.499. Epub 2016 Jan 18.

Enhanced MAPK signaling drives ETS1-mediated induction of miR-29b leading to downregulation of TET1 and changes in epigenetic modifications in a subset of lung SCC

Affiliations

Enhanced MAPK signaling drives ETS1-mediated induction of miR-29b leading to downregulation of TET1 and changes in epigenetic modifications in a subset of lung SCC

M A Taylor et al. Oncogene. .

Abstract

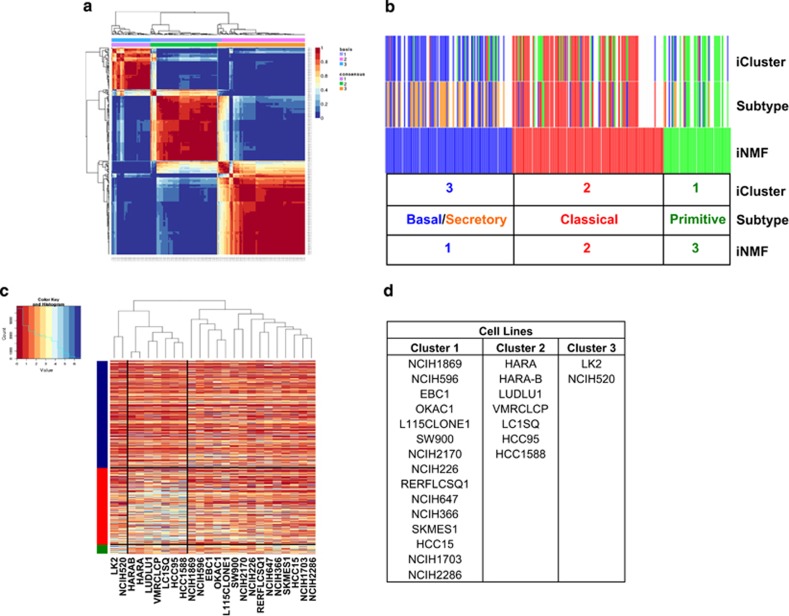
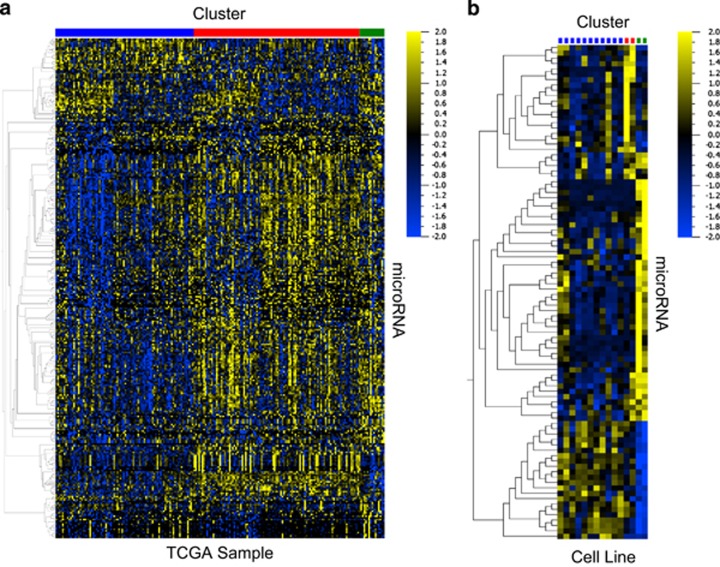
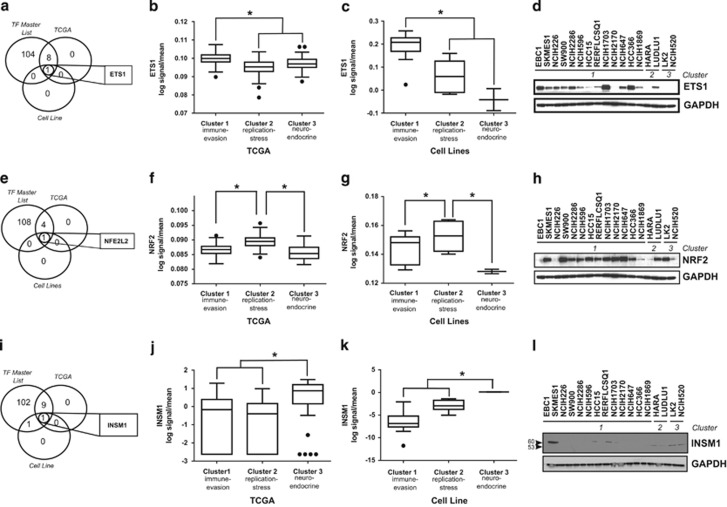
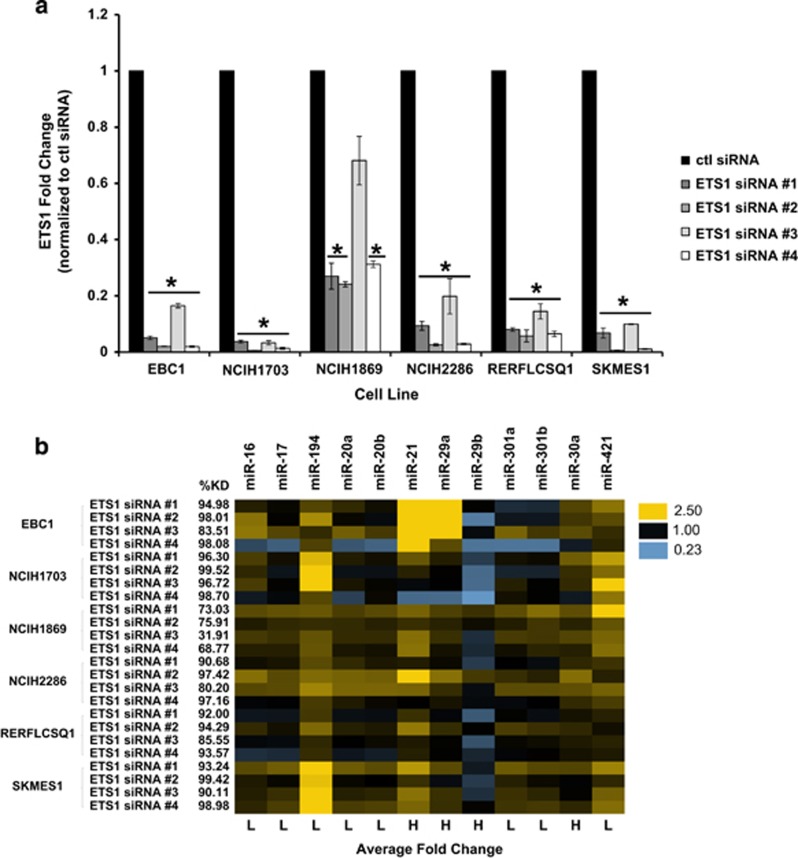
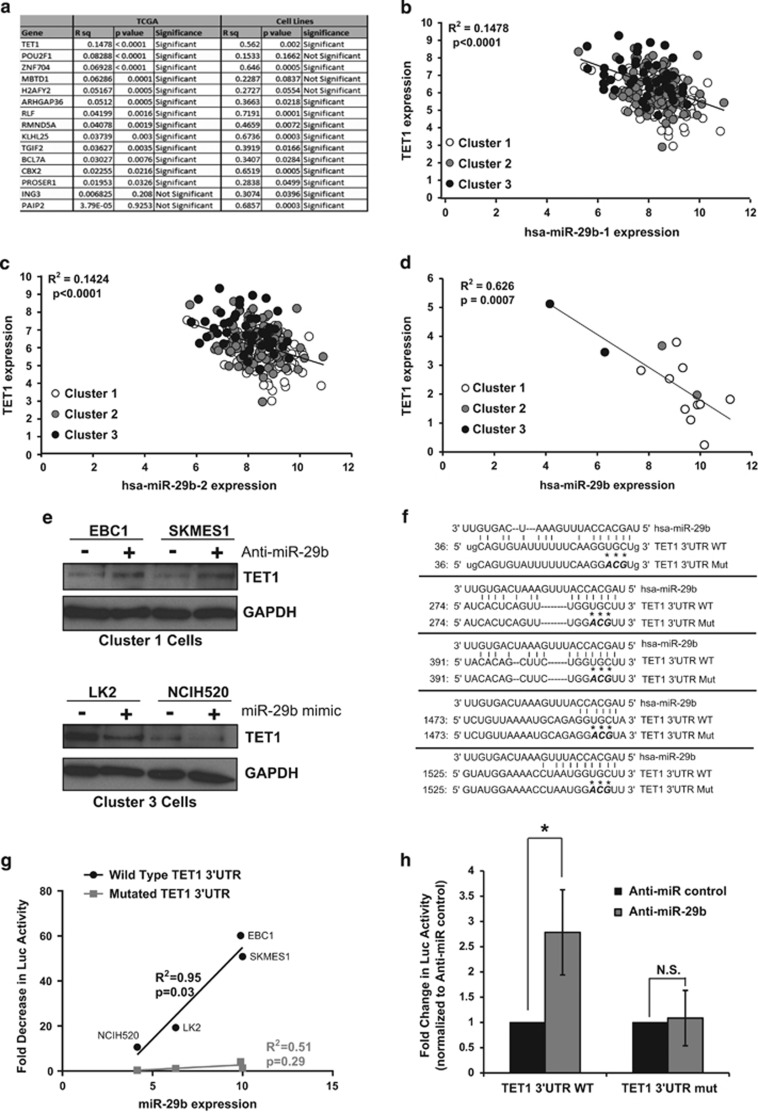
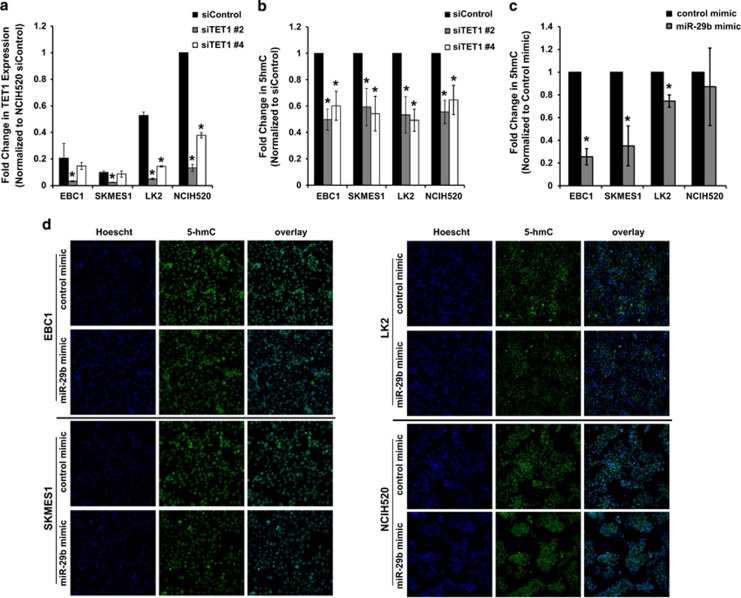
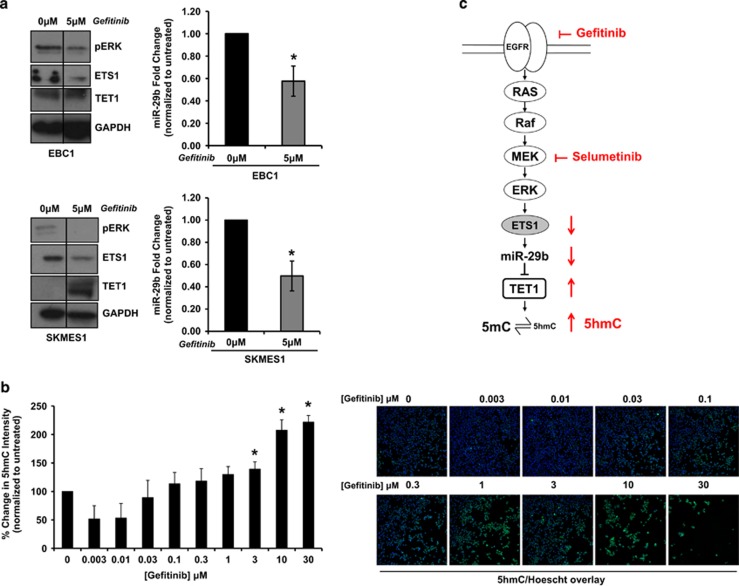
Non-small-cell lung cancer is the leading cause of cancer death worldwide and is comprised of several histological subtypes, the two most common being adenocarcinoma (AC) and squamous cell carcinoma (SCC). Targeted therapies have successfully improved response rates in patients with AC tumors. However, the majority of SCC tumors lack specific targetable mutations, making development of new treatment paradigms for this disease challenging. In the present study, we used iterative non-negative matrix factorization, an unbiased clustering method, on mRNA expression data from the cancer genome atlas (TCGA) and a panel of 24 SCC cell lines to classify three disease segments within SCC. Analysis of gene set enrichment and drug sensitivity identified an immune-evasion subtype that showed increased sensitivity to nuclear factor-κB and mitogen-activated protein kinase (MAPK) inhibition, a replication-stress associated subtype that showed increased sensitivity to ataxia telangiectasia inhibition, and a neuroendocrine-associated subtype that showed increased sensitivity to phosphoinositide 3-kinase and fibroblast growth factor receptor inhibition. Additionally, each of these subtypes exhibited a unique microRNA expression profile. Focusing on the immune-evasion subtype, bioinformatic analysis of microRNA promoters revealed enrichment for binding sites for the MAPK-driven ETS1 transcription factor. Indeed, we found that knockdown of ETS1 led to upregulation of eight microRNAs and downregulation of miR-29b in the immune-evasion subtype. Mechanistically, we found that miR-29b targets the DNA-demethylating enzyme, TET1, for downregulation resulting in decreased 5-hmC epigenetic modifications. Moreover, inhibition of MAPK signaling by gefitinib led to decreased ETS1 and miR-29b expression with a corresponding increase in TET1 expression and increase in 5-hmC. Collectively, our work identifies three subtypes of lung SCC that differ in drug sensitivity and shows a novel mechanism of miR-29b regulation by MAPK-driven ETS1 expression which leads to downstream changes in TET1-mediated epigenetic modifications.


Conflict of interest statement

All authors are employees of AstraZeneca.

Figures

Figure 1
Figure 1
iNMF clustering to identify subtypes of lung SCC. (a) iNMF was used to uncover three core subtypes of gene expression differences within 258 samples of lung SCC obtained from The Cancer Genome Atlas (TCGA). (b) The map showing overlap of individual TCGA samples clustered by iCluster, Subtype and iNMF. Cluster 1 is indicated in blue, cluster 2 in red and cluster 3 in green. (c, d) iNMF clusters were applied to a panel of 24 SCC cell lines.
Figure 2
Figure 2
SCC genomic subtypes have distinct microRNA expression profiles. (a) The most differentially expressed microRNAs between the three iNMF clusters in TCGA (ANOVA, P<0.05). (b) The most differentially expressed microRNAs in the SCC cell lines (ANOVA, P<0.05). Cluster 1 (immune-evasion) is indicated in blue, cluster 2 (replication-stress) is indicated in red and cluster 3 (neuroendocrine) is indicated in green.
Figure 3
Figure 3
Transcription factors predicted to modulate microRNA expression are differentially expressed across the three subtypes. (a) Venn diagram depicting the overlap of transcription factors predicted to bind the promoters of microRNAs differentially regulated between subtypes (TF master list), transcription factors significantly upregulated in cluster 1 TCGA samples and transcription factors significantly upregulated in cluster 1 cell lines compared with the other two clusters. (b) Expression of ETS1 in TCGA samples grouped by subtype. (c) Expression of ETS1 in cell lines grouped by subtype. (d) Immunoblotting of detergent-solubilized whole-cell extracts with ETS1 antibody or GAPDH antibody. (e) Venn diagram depicting the overlap of the TF master list, transcription factors significantly upregulated in cluster 2 TCGA samples, and transcription factors significantly upregulated in cluster 2 cell lines compared with the other two clusters. (f) Expression of NRF2 in TCGA samples grouped by subtype. (g) Expression of NRF2 in cell lines grouped by subtype. (h) Immunoblotting of detergent-solubilized whole-cell extracts with NRF2 antibody or GAPDH antibody. (i) Venn diagram depicting the overlap of the TF master list, transcription factors significantly upregulated in cluster 3 TCGA samples and transcription factors significantly upregulated in cluster 3 cell lines compared with the other two clusters. (j) Expression of INSM1 in TCGA samples grouped by subtype. (k) Expression of INSM1 in cell lines grouped by subtype. (l) Immunoblotting of detergent-solubilized whole-cell extracts with INSM1 antibody or GAPDH antibody. *P<0.05, Student's t-test and all western blots are a representative image from three independent experiments.
Figure 4
Figure 4
ETS1 modulates expression of microRNAs in the immune-evasion subtype. (a) Control (non-targeting) or ETS1 specific (ETS1 siRNA #1, #2, #3 and #4) siRNAs were transfected into indicated cell lines and after 72 h, decreased expression of ETS1 was confirmed by semiquantitative real-time PCR (data are the mean±s.e.m. of n=3, *P<0.05, Student's t-test). (b) Fold change in microRNA expression after ETS1 knockdown compared with control siRNA was measured by fluidigm chip PCR (n=3). microRNAs with low expression in the original signature are indicated with an ‘L', while those with high expression are indicated in an ‘H' under the heatmap. Percent knockdown under each experimental condition is indicated to the left of the heatmap. Only microRNAs that were significantly (P<0.05) changed in at least one cell line are shown (see Supplementary Table S7 for complete statistical results).
Figure 5
Figure 5
miR-29b targets TET1 for downregulation. (a) Regression analysis of 15 mRNA targets of miR-29b identified by Ingenuity Pathway Analysis. R2 and P-values for inverse correlation between miR-29b and each gene are shown for both TCGA samples and cell lines (significant=P<0.05). (b) Regression plot of TET1 mRNA expression compared with hsa-miR-29b-1 expression in TCGA samples indicates significant inverse correlation P<0.0001. (c) Regression plot of TET1 mRNA expression compared with hsa-miR-29-2 expression in TCGA samples indicates significant inverse correlation P<0.0001. (d) Regression plot of TET1 mRNA expression compared with hsa-miR-29b expression in cell line samples indicates a significant degree of inverse correlation P=0.0007. (e) Immunoblotting of detergent-solubilized whole-cell extracts with TET1 antibody 48 h after transfection with either Anti-miR-29b (or non-targeting Anti-miR control) or miR-29b mimic (or control mimic). Differences in protein loading were monitored by reprobing stripped membranes with antibody against GAPDH. Shown is a representative image from three independent experiments. (f) Alignment of has-miR-29b to the wild type and mutant TET1 3′UTR sequences. Asterisks indicate mutated miR-29b seed sequence-binding bases. (g) Cells were transiently transfected with a luciferase reporter construct containing no 3′UTR, wild-type TET1 3′UTR or a mutated TET1 3′UTR sequence. Luciferase signal was normalized to the construct with no 3′UTR and the fold decrease in signal was plotted against the miR-29b expression levels of each cell line indicating a significant (P=0.03) correlation between miR-29b expression and decrease in wild-type TET1 luciferase reporter, but not the mutated reporter (P=0.29) (n=3). (h) EBC1 cells were transiently co-transfected with Anti-miR-29b (or Anti-miR control) and either a wild-type TET1 3′UTR reporter or a mutated TET1 3′UTR reporter (TET1 3′UTR mut) and luciferase signal was normalized to Anti-miR control transfected cells. Data are the mean±s.e.m. of n=3, *P<0.05, Student's t-test.
Figure 6
Figure 6
miR-29b-mediated downregulation of TET1 leads to changes in the epigenetic modification 5-hmC. (a) Cells were transiently transfected with siRNA against TET1 or control siRNA and knockdown was determined by semi-quantitative real-time PCR, where individual signals were normalized to 18S. (b) After transfection with siRNA against TET1 or control siRNA cells were immunostained for 5-hmC and Hoescht and an algorithm measuring nuclear fluorescence intensity of 5-hmC was used to quantitate the percent of cells with 5-hmC in the nucleus and plotted as fold change to siRNA control (c) Cells were transiently transfected with miR-29b mimic or control mimic, after 48 h cells were immunostained for 5-hmC and Hoescht and quantitated as in (b). (d) Representative images of immunostaining after transfections with control mimic or miR-29b mimic. All experiments are the mean±s.e.m. n=3, *P<0.05, Student's t-test.
Figure 7
Figure 7
MAPK signaling regulates miR-29b-mediated downregulation of TET1and leads to changes in 5-hmC levels. (a) Cell lines were treated with 5 μm gefitinib or DMSO for 72 h. Afterwards, miR-29b levels were monitored by semiquantitative real-time PCR (±s.e.m., n=3) and immunoblotting was performed to measure differences in phospho-ERK, ETS1 and TET1. Differences in protein loading were monitored by reprobing stripped membranes with antibody against GAPDH. Shown is a representative image from three independent experiments. (b) Cells were treated with increasing concentrations of gefitinib for 48 h after which point, cells were immunostained for 5-hmC and Hoescht and visualized using a x10 objective on the cellomics Cell Insight. An algorithm measuring the nuclear fluorescence intensity of 5-hmC was used to analyze the cells. Data are the mean±s.e.m. of n=3,*P<0.05, Student's t-test. (c) High levels of EGFR/MAPK signaling in the immune-evasion subtype leads to an upregulation of ETS1 which drives increased expression of miR-29b. miR-29b targets TET1 for downregulation through interacting with its 3′UTR, which leads to decreased 5-hmC levels indicative of increased DNA methylation.

References

    1. Jemal A, Bray F, Center MM, Ferlay J, Ward E, Forman D. Global cancer statistics. CA Cancer J Clin 2011; 61: 69–90. - PubMed
    1. Nana-Sinkam SP, Powell CA. Molecular biology of lung cancer: diagnosis and management of lung cancer, 3rd ed: American College of Chest Physicians evidence-based clinical practice guidelines. Chest 2013; 143(5 Suppl): e30S–e309. - PMC - PubMed
    1. Golub TR, Slonim DK, Tamayo P, Huard C, Gaasenbeek M, Mesirov JP et al. Molecular classification of cancer: class discovery and class prediction by gene expression monitoring. Science 1999; 286: 531–537. - PubMed
    1. Perou CM, Sorlie T, Eisen MB, van de Rijn M, Jeffrey SS, Rees CA et al. Molecular portraits of human breast tumours. Nature 2000; 406: 747–752. - PubMed
    1. Hayes DN, Monti S, Parmigiani G, Gilks CB, Naoki K, Bhattacharjee A et al. Gene expression profiling reveals reproducible human lung adenocarcinoma subtypes in multiple independent patient cohorts. J Clin Oncol 2006; 24: 5079–5090. - PubMed

MeSH terms