INTEGRATING CLINICAL LABORATORY MEASURES AND ICD-9 CODE DIAGNOSES IN PHENOME-WIDE ASSOCIATION STUDIES
- PMID: 26776183
- PMCID: PMC4718547
INTEGRATING CLINICAL LABORATORY MEASURES AND ICD-9 CODE DIAGNOSES IN PHENOME-WIDE ASSOCIATION STUDIES
Abstract
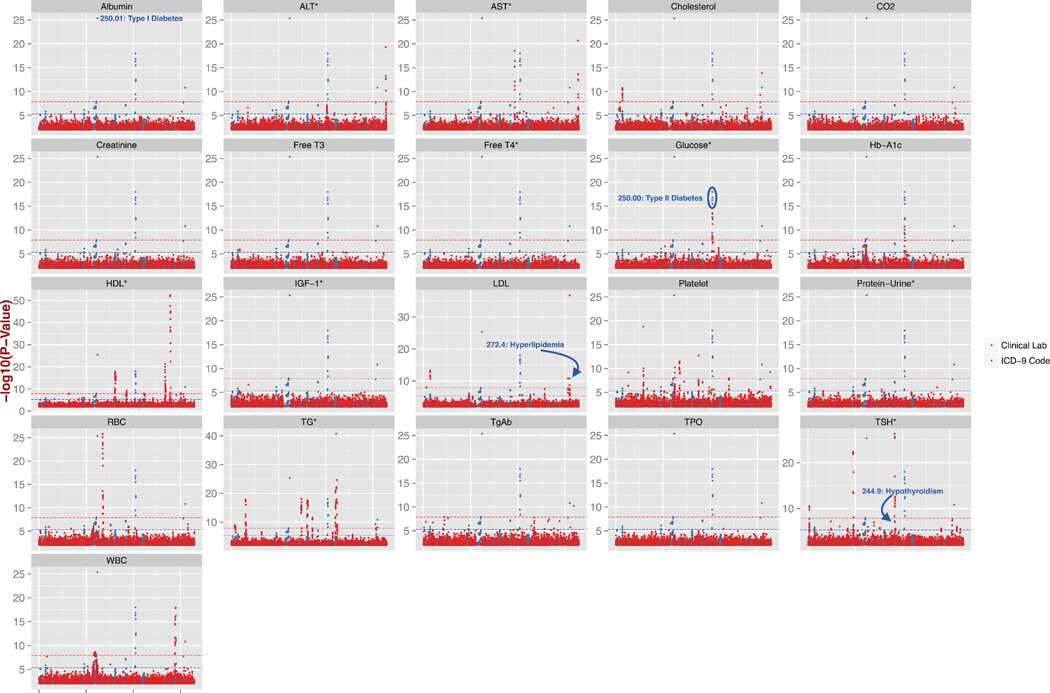
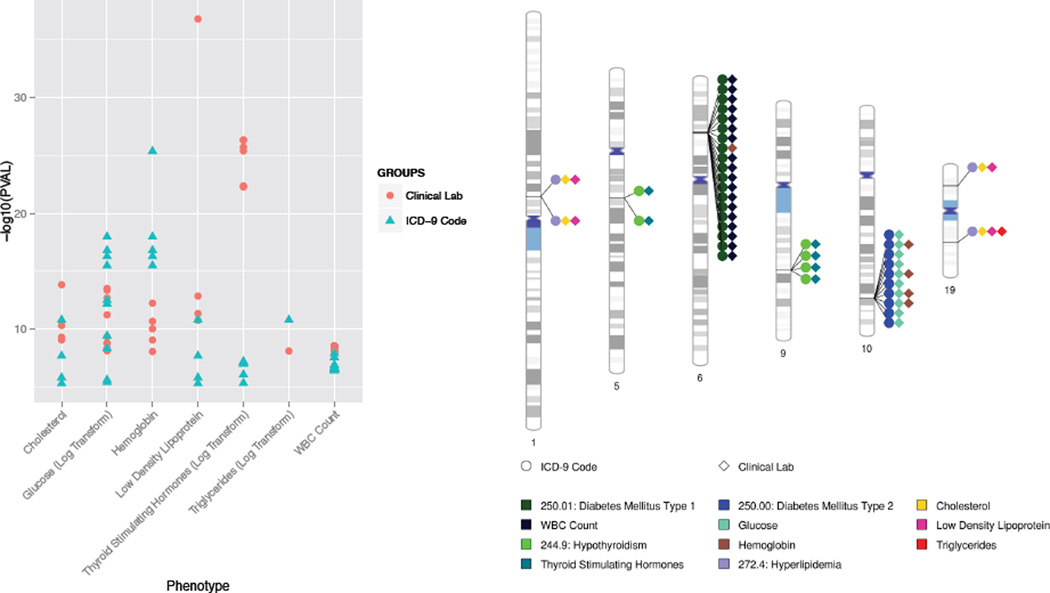
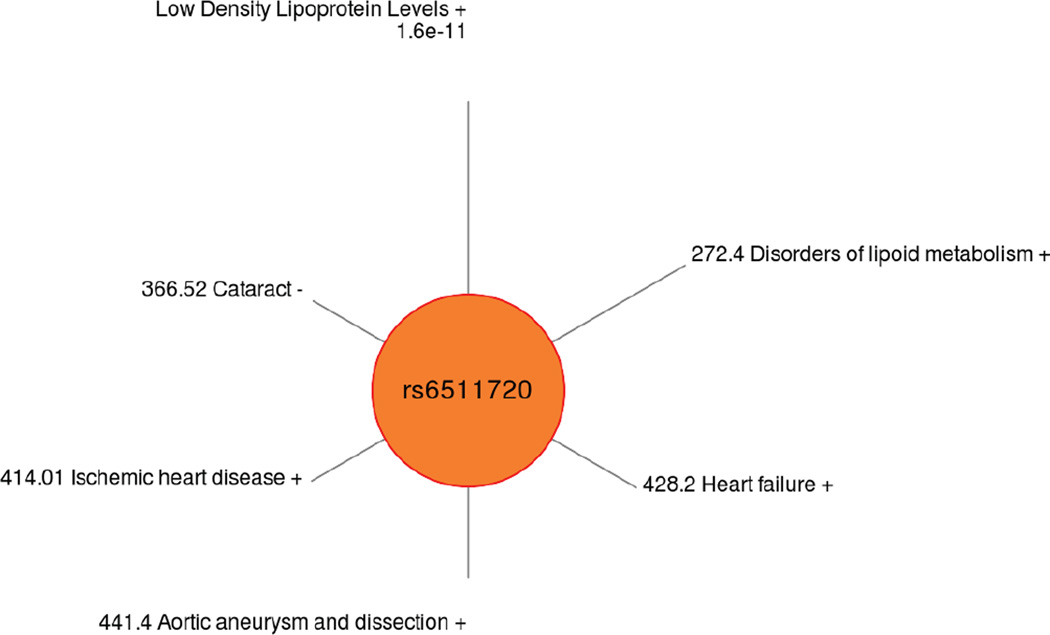
Electronic health records (EHR) provide a comprehensive resource for discovery, allowing unprecedented exploration of the impact of genetic architecture on health and disease. The data of EHRs also allow for exploration of the complex interactions between health measures across health and disease. The discoveries arising from EHR based research provide important information for the identification of genetic variation for clinical decision-making. Due to the breadth of information collected within the EHR, a challenge for discovery using EHR based data is the development of high-throughput tools that expose important areas of further research, from genetic variants to phenotypes. Phenome-Wide Association studies (PheWAS) provide a way to explore the association between genetic variants and comprehensive phenotypic measurements, generating new hypotheses and also exposing the complex relationships between genetic architecture and outcomes, including pleiotropy. EHR based PheWAS have mainly evaluated associations with case/control status from International Classification of Disease, Ninth Edition (ICD-9) codes. While these studies have highlighted discovery through PheWAS, the rich resource of clinical lab measures collected within the EHR can be better utilized for high-throughput PheWAS analyses and discovery. To better use these resources and enrich PheWAS association results we have developed a sound methodology for extracting a wide range of clinical lab measures from EHR data. We have extracted a first set of 21 clinical lab measures from the de-identified EHR of participants of the Geisinger MyCodeTM biorepository, and calculated the median of these lab measures for 12,039 subjects. Next we evaluated the association between these 21 clinical lab median values and 635,525 genetic variants, performing a genome-wide association study (GWAS) for each of 21 clinical lab measures. We then calculated the association between SNPs from these GWAS passing our Bonferroni defined p-value cutoff and 165 ICD-9 codes. Through the GWAS we found a series of results replicating known associations, and also some potentially novel associations with less studied clinical lab measures. We found the majority of the PheWAS ICD-9 diagnoses highly related to the clinical lab measures associated with same SNPs. Moving forward, we will be evaluating further phenotypes and expanding the methodology for successful extraction of clinical lab measurements for research and PheWAS use. These developments are important for expanding the PheWAS approach for improved EHR based discovery.
Figures
References
-
- Pendergrass SA, et al. Phenome-Wide Association Studies: Embracing Complexity for Discovery. Hum. Hered - PubMed
MeSH terms
Grants and funding
LinkOut - more resources
Full Text Sources
Miscellaneous