. 2016 Jan 26;14(3):598-610.
doi: 10.1016/j.celrep.2015.12.063. Epub 2016 Jan 14.

Functional Genomic Screening Reveals Splicing of the EWS-FLI1 Fusion Transcript as a Vulnerability in Ewing Sarcoma

Affiliations

Functional Genomic Screening Reveals Splicing of the EWS-FLI1 Fusion Transcript as a Vulnerability in Ewing Sarcoma

Patrick J Grohar et al. Cell Rep. .

Abstract

Ewing sarcoma cells depend on the EWS-FLI1 fusion transcription factor for cell survival. Using an assay of EWS-FLI1 activity and genome-wide RNAi screening, we have identified proteins required for the processing of the EWS-FLI1 pre-mRNA. We show that Ewing sarcoma cells harboring a genomic breakpoint that retains exon 8 of EWSR1 require the RNA-binding protein HNRNPH1 to express in-frame EWS-FLI1. We also demonstrate the sensitivity of EWS-FLI1 fusion transcripts to the loss of function of the U2 snRNP component, SF3B1. Disrupted splicing of the EWS-FLI1 transcript alters EWS-FLI1 protein expression and EWS-FLI1-driven expression. Our results show that the processing of the EWS-FLI1 fusion RNA is a potentially targetable vulnerability in Ewing sarcoma cells.


Figures

Figure 1
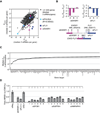
Figure 1. Identification of proteins required for EWS-FLI1 activity by genome-wide RNAi screening
(A) A genome-wide RNAi screen of EWS-FLI1 activity. Data are shown as the median Z-score value for the 3 siRNAs corresponding to each gene (~21,000 genes) except for POL2RA (light blue circles), EWSR1(magenta diamonds) and FLI1 (dark blue squares) for which the Z-score value of each of the 3 siRNAs targeting each gene are shown. (B) The Zdiff (ZNR0B1-ZCMV) for the EWSR1 and FLI1 siRNAs included in the screen and a schematic of the sites in EWSR1, FLI1, and, EWS-FLI1 targeted by these siRNAs. (C) The median Zdiff (ZNR0B1-ZCMV) (3 siRNAs per gene) for the 139 genes, selected for follow up analysis, that exhibited a selective decrease in the TC32-NR0B1-luc reporter when silenced. (D) Ratio of the TC32-NR0B1-luc and TC32-CMV-luc reporter signals, 72 h post siRNA-transfection (mean ± standard deviation (SD), n=5). ** p<0.01; *** p<0.001 compared to siNeg. See also Figure S1 and Table S1.
Figure 2
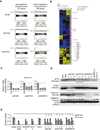
Figure 2. EWS-FLI1 driven expression in TC32 cells is altered by the silencing of SF3B1, SUPT6H, or HNRNPH1
(A) GSEA of the transcriptome of SF3B1, SUPT6H, or HNRNPH1-silenced TC32 cells (48 h) using a set of genes up-regulated (751) or down-regulated (494) in ES. NES = normalized enrichment score, FDR = false discovery rate, FWER = family-wise error rate. (B) Heat-map representation of the fold-change (Log2) in the expression of genes deregulated in ES following silencing of SF3B1, SUPT6H, or HNRNPH1 in TC32 cells (48 h). (C) qPCR assessment of EWS-FLI1 expression in HNRNPH1, SF3B1, or SUPT6H–silenced TC32 cells (48 h). Data are expressed relative to siNeg-transfected cells (mean ± SD, n=3). (D) Immunoblot analysis of whole-cell lysates prepared from ES cells 48 h post transfection of HNRNPH1, SF3B1, or SUPT6H siRNAs using antibodies against the proteins indicated. * p<0.05; ** p<0.01; *** p<0.001compared to siNeg. (E) Relative viability of TC32 cells 48 and 72 h post-siRNA transfection (siNeg median normalized, mean ± SD, n=5). See also Figure S2 and Tables S2 and S3.
Figure 3
Figure 3. HNRNPH1 is required for the splicing of EWS-FLI1 in Ewing sarcoma cell lines with a genomic breakpoint that retains EWSR1 exon 8
(A) Schematic of the organization of the EWSR1 and FLI1 genes and EWS-FLI1 fusion transcripts in ES cell lines. EWSR1 exons are indicated in magenta and FLI1 exons in blue. The EWSR1 and FLI1 exon count are based on NM_05243 and NM_002017 reference sequences. (B) Expression of SF3B1 and EWS-FLI1 (E7/F7 primer pair) in SF3B1-silenced ES cells (48 h). Data are expressed relative to siNeg-transfected cells (mean ± SD, n=3). (C) Expression of HNRNPH1 and EWS-FLI1 (E7/F7 primer pair) in HNRNPH1-silenced ES cells (48 h). Data are expressed relative to siNeg-transfected cells (mean ± SD, n=3). (D) PCR analysis of the splicing of EWS-FLI1 using E6/F6 primer pair and sequence analysis of the amplified products labeled a and b focusing on the junction of EWSR1 exons 7 and 8 and EWSR1 exon 8 and FLI1 exon 7. (E) Immunoblot analysis of whole-cell lysates prepared from TC32 cells 48 h post siRNA-transfection using antibodies against the proteins indicated. ** p<0.01; *** p<0.001compared to siNeg. See also Figure S3.
Figure 4
Figure 4. HNRNPH1 directly binds the EWS-FLI1 pre-mRNA expressed in TC32 cells
(A) Expression of EWS-FLI1 regulated genes in HNRNPH1-silenced SKNMC or TC71 cells. Data are expressed relative to untransfected cells (mean ± SD, n=3). * p<0.05; ** p<0.01; *** p<0.001 compared to siNeg. (B) Immunoblot analysis of whole-cell lysates prepared from ES cells 48 h post siRNA-transfection using antibodies against the proteins indicated. (C) The viability of TC32 and TC71 cells 72 h post siRNA-transfection (siNeg median normalized, mean ± SD, n=10). p-values are compared to siNeg. (D) UV-cross-linked RNA from TC32 cells (nuclear fraction) were subjected to RNA immunoprecipitation using an HNRNPH1 antibody or a control IgG isotype control. The fold-enrichment of co-precipitating RNA (HNRNPH1-bound versus IgG control) was determined by qPCR across regions of the EWS-FLI1 transcript (see Figure S4A). Data are shown as the mean ± standard error of the mean (SEM) of 3 experiments. (E) Sequence of EWSR1 exon 8 indicating putative G-rich HNRNPH1 binding sites. (F) The fold-enrichment for HNRNPH1-bound RNA oligomers determined by comparison of chemiluminiscent signals from the pull-down performed using a HNRNPH1 antibody and an IgG isotype control. Data are shown as the mean ± SEM of 3 experiments. p-values are compared to no oligomer/no antibody controls. See also Figure S4.
Figure 5
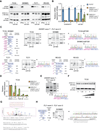
Figure 5. Depletion of SF3B1 results in mis-splicing of EWS-FLI1
(A) Immunoblot analysis of whole cell lysates prepared from ES cells 48 h post siRNA-transfection using antibodies against the proteins indicated. (B)EWS-FLI1 expression (E7/F7 or E7/F9 primer pairs) following silencing of HNRNPH1 or SF3B1 in SKNMC cells. Data are expressed relative to siNeg-transfected cells (mean ± SD, n=3). Expression of RPL27 is shown as a control for assessing non-specific splicing effects. * p<0.05; ** p<0.01; *** p<0.001 compared to siNeg. (C) PCR analysis of the splicing of EWS-FLI1 using primers corresponding to EWSR1 exon 7 and FLI1 exon 8 and representative sequence chromatograms for the PCR products indicated in each gel (a - f). (D) Expression of EWS-FLI1 in TC32 cells treated with increasing concentrations of PlaB (1.25 – 10 nM, 6 h). Data are expressed relative to 0.1% DMSO treated cells (mean ± SD, n=3). * p<0.05; ** p<0.01; *** p<0.001 compared to V. (E) PCR analysis of the splicing of EWS-FLI1 using primers corresponding to EWSR1 exon 7 and FLI1 exon 8 and representative sequence chromatograms for the PCR product indicated *. TC32 cells were treated with 5 nM PlaB for 6 h. (F) Immunoblot analysis of whole-cell lysates prepared from TC32 cells treated with increasing concentrations of PlaB for 24 h using antibodies against the proteins indicated. (G) HCD Fragmentation spectra of peptide ([M+2H]2+-H2O, m/z 657.62) from SKMNC cells treated with 5 nM PlaB for 24 h. The protein band corresponding to EWS-FLI1 was excised and digested with trypsin and the resulting peptides were analyzed on a Thermo Fusion Orbitrap. (H) PCR analysis of the splicing of EWS-FLI1 using a FLI1 exon 6 forward and a FL11 exon 9 reverse primer and representative sequences of the FLI1 exon 6/8 junction for the indicated product *. See also Figure S5.
Figure 6
Figure 6. Inhibition of SF3b function reverses expression of genes activated by EWS-FLI1
(A) The viability of Ewing sarcoma (TC32, SKNMC, TC71, and RD-ES) and prostate cancer (PC3 and LNCaP) cell lines exposed to increasing concentrations of the spliceosome inhibitor Pladienolide B (PlaB) for 48 h, mean ± SEM, n=3 at each PlaB concentration normalized to vehicle (V, 0.1% DMSO); CI = Confidence Interval. (B) GSEA of the transcriptome of PlaB treated ES cells (5 nM, 24 h) using a set of 751 genes up-regulated in ES and a set of ~100 genes activated by EWS-FLI1 (Riggi et al., 2014). (C) Heat-map of the fold-change (Log2) in the expression of EWS-FLI1 regulated genes (Kauer et al., 2009) and genes considered direct targets of EWS-FLI1 (Riggi et al., 2014) following exposure of ES cells to PlaB (5 nM for 24 h). (D) Expression of genes activated by EWS-FLI1 in 5 nM PlaB treated (24 h) TC32 or SKNMC cells. Data are expressed relative to DMSO treated cells (mean ± SD, n=3). * p<0.05; ** p<0.01; *** p<0.001 compared to siNeg or V. (E) Expression of genes activated by EWS-FLI1 in SF3B1-silenced TC32 or SKNMC cells (48 h). Data are expressed relative to siNeg-transfected cells (mean ± SD, n=3). * p<0.05; ** p<0.01; *** p<0.001 compared to siNeg. (F) Immunoblot analysis of whole-cell lysates prepared from ES cells treated with either 0.1% DMSO or 5 nm PlaB (24 h) or siNeg or SF3B1-silenced (48 h) ES cells using antibodies against the proteins indicated. (G) ChIP analysis of DNA from TC32 cells (DMSO 0.1% or 5nM PlaB treated, 24 h) using either a FLI1 antibody or an IgG antibody. Fold-enrichment of co-precipitating DNA (PlaB compared to DMSO) was determined by qPCR for the indicated EWS-FLI1 bound GGAA microsatellites; the regions targeted and the PCR primers used are detailed in Supplemental Experimental Procedures, mean ± SEM, 3 independent experiments (triplicate samples for each treatment in each experiment). See also Figure S6 and Tables S2 and S4
Figure 7
Figure 7. The altered splicing of EWS-FLI1 results in disruption of its activity as an oncogenic transcription factor
Schematic illustrating the splicing of the EWS-FLI1 pre-mRNA by SF3B1 and HNRNPH1.

Similar articles

Cited by

References

    1. Bailly RA, Bosselut R, Zucman J, Cormier F, Delattre O, Roussel M, Thomas G, Ghysdael J. DNA-binding and transcriptional activation properties of the EWS-FLI-1 fusion protein resulting from the t(11;22) translocation in Ewing sarcoma. Mol Cell Biol. 1994;14:3230–3241. - PMC - PubMed
    1. Berger M, Dirksen U, Braeuninger A, Koehler G, Juergens H, Krumbholz M, Metzler M. Genomic EWS-FLI1 fusion sequences in Ewing sarcoma resemble breakpoint characteristics of immature lymphoid malignancies. PLoS One. 2013;8:e56408. - PMC - PubMed
    1. Bilke S, Schwentner R, Yang F, Kauer M, Jug G, Walker RL, Davis S, Zhu YJ, Pineda M, Meltzer PS, et al. Oncogenic ETS fusions deregulate E2F3 target genes in Ewing sarcoma and prostate cancer. Genome Res. 2013;23:1797–1809. - PMC - PubMed
    1. Bonnal S, Vigevani L, Valcarcel J. The spliceosome as a target of novel antitumour drugs. Nat Rev Drug Discov. 2012;11:847–859. - PubMed
    1. Brohl AS, Solomon DA, Chang W, Wang J, Song Y, Sindiri S, Patidar R, Hurd L, Chen L, Shern JF, et al. The genomic landscape of the Ewing Sarcoma family of tumors reveals recurrent STAG2 mutation. PLoS Genet. 2014;10:e1004475. - PMC - PubMed

Publication types

MeSH terms

Substances