. 2016 Feb 2;14(4):695-707.
doi: 10.1016/j.celrep.2015.12.070. Epub 2016 Jan 14.

The Gut Epithelial Receptor LRRC19 Promotes the Recruitment of Immune Cells and Gut Inflammation

Affiliations

The Gut Epithelial Receptor LRRC19 Promotes the Recruitment of Immune Cells and Gut Inflammation

Shuisong Cao et al. Cell Rep. .

Abstract

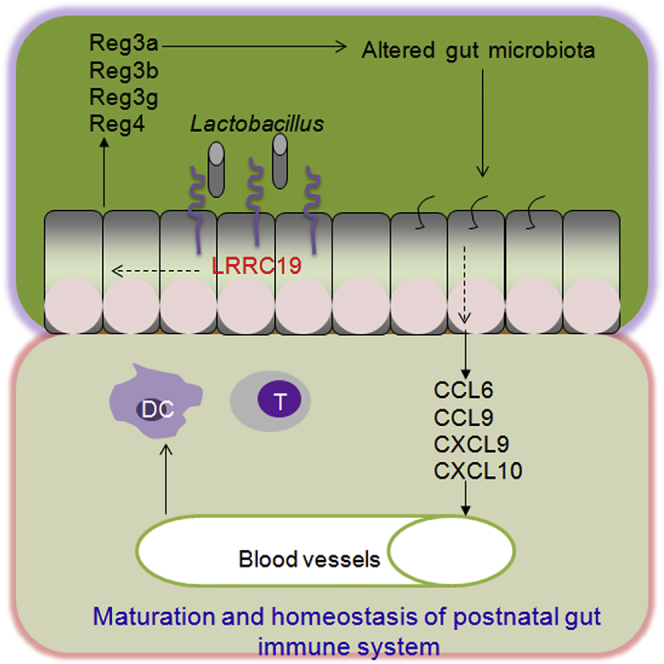
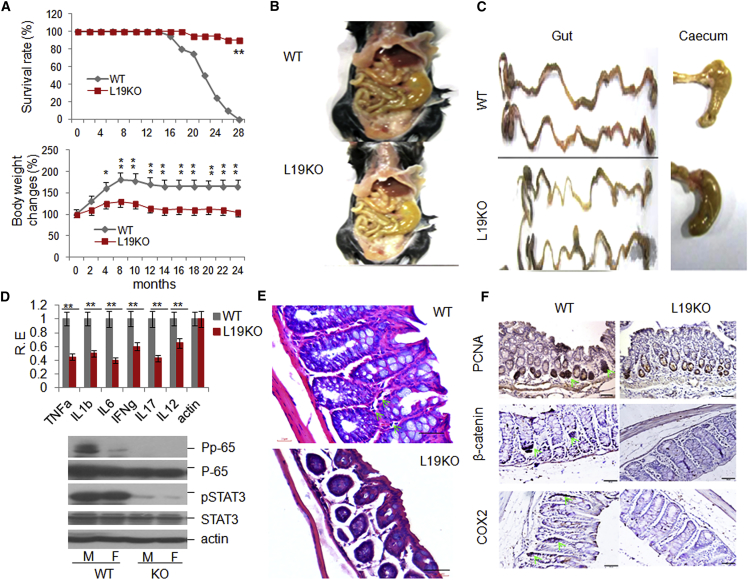
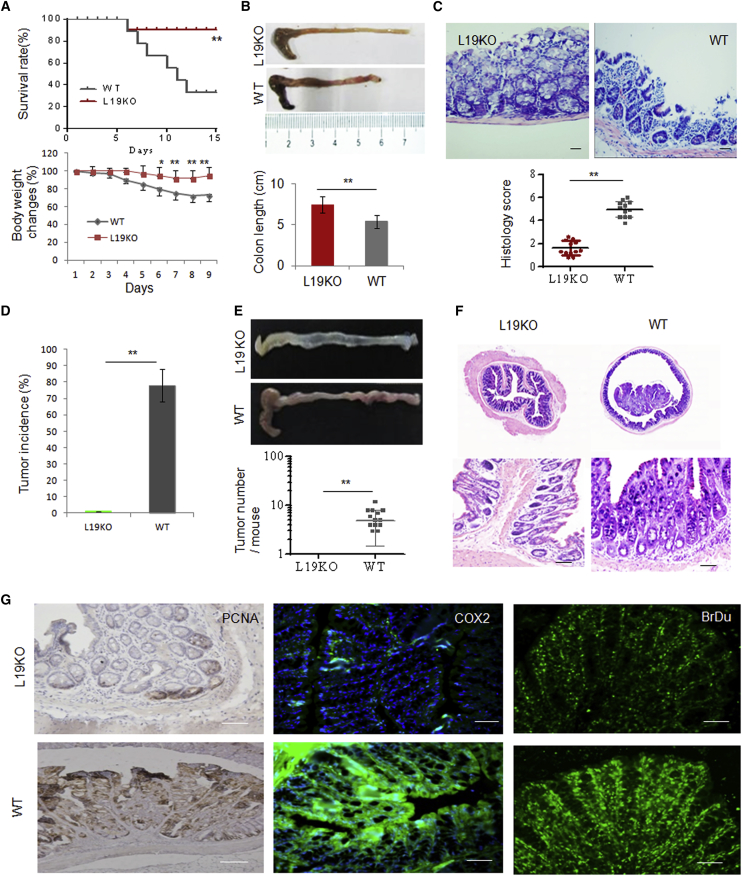
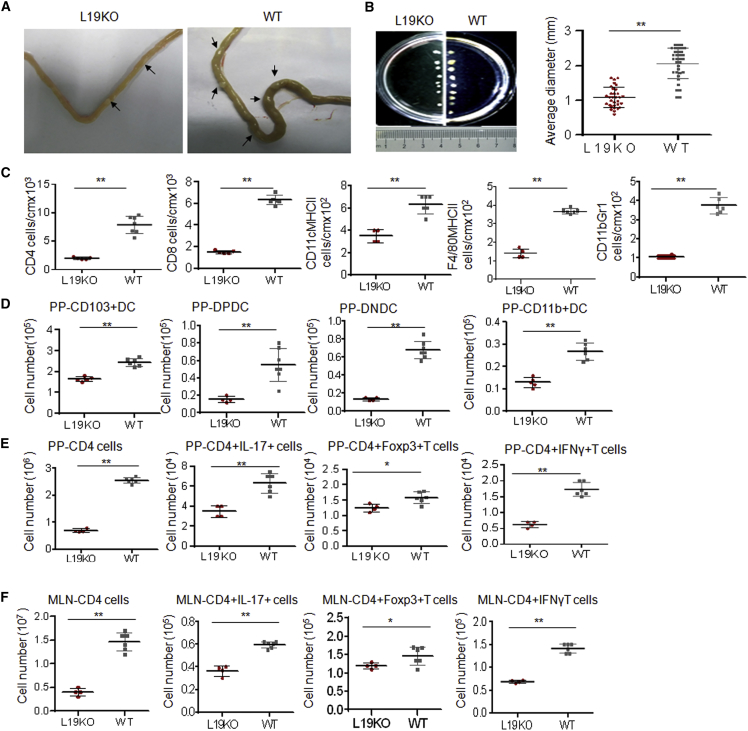
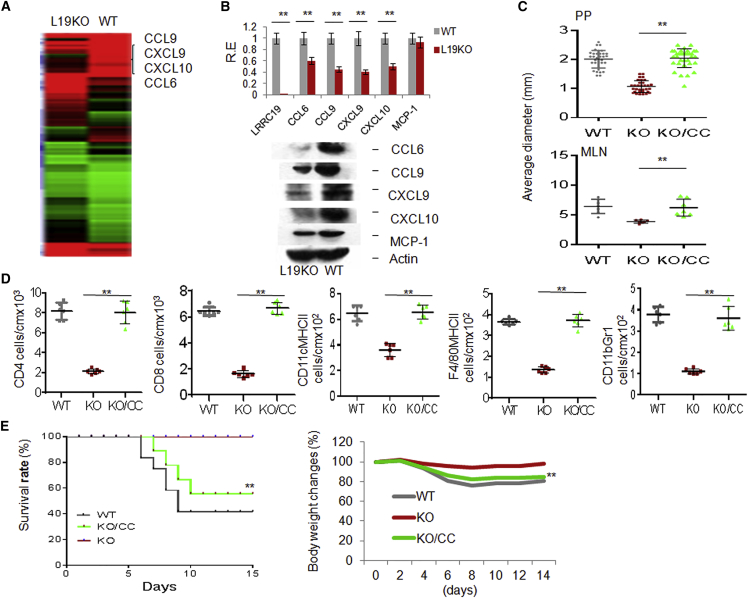
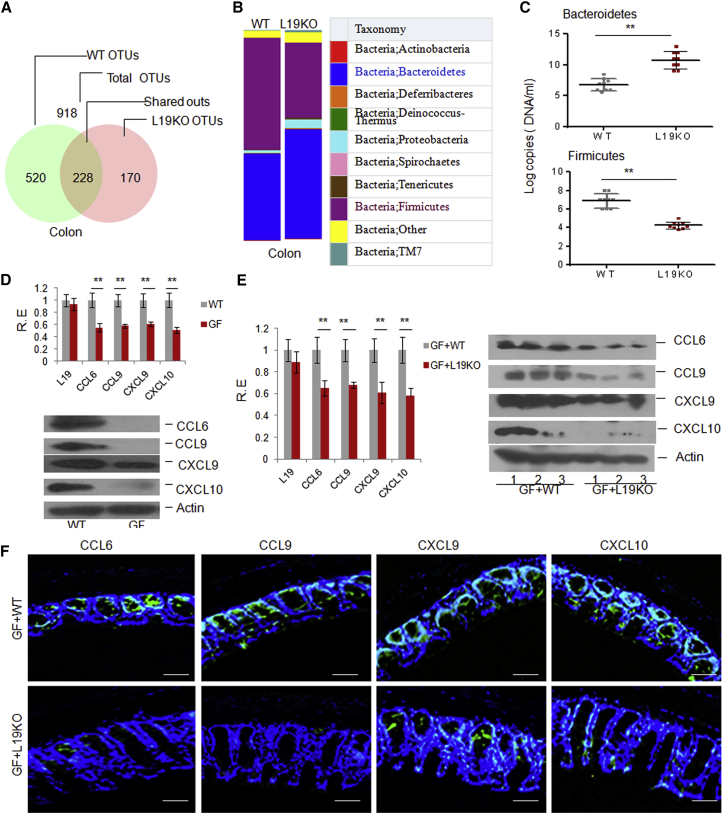
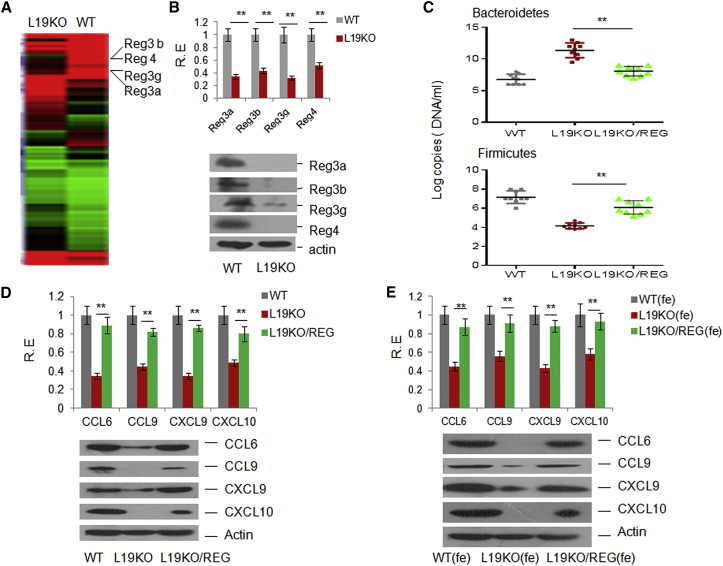
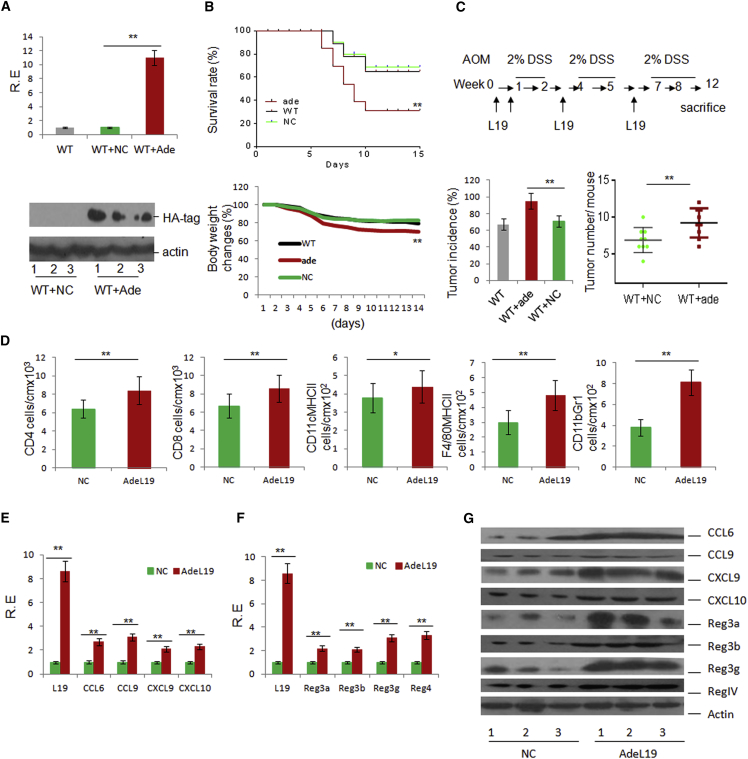
Commensal microbes are necessary for a healthy gut immune system. However, the mechanism involving these microbes that establish and maintain gut immune responses is largely unknown. Here, we have found that the gut immune receptor leucine-rich repeat (LRR) C19 is involved in host-microbiota interactions. LRRC19 deficiency not only impairs the gut immune system but also reduces inflammatory responses in gut tissues. We demonstrate that the LRRC19-associated chemokines CCL6, CCL9, CXCL9, and CXCL10 play a critical role in immune cell recruitment and intestinal inflammation. The expression of these chemokines is associated with regenerating islet-derived (REG) protein-mediated microbiotas. We also found that the expression of REGs may be regulated by gut Lactobacillus through LRRC19-mediated activation of NF-κB. Therefore, our study establishes a regulatory axis of LRRC19, REGs, altered microbiotas, and chemokines for the recruitment of immune cells and the regulation of intestinal inflammation.


Figures

None
Graphical abstract
Figure 1
Figure 1
LRRC19 Deficiency Inhibits the Occurrence and Development of Gut Inflammation (A) Survival rates (top) and changes in body weight (bottom) of WT (WT, n = 24 [female, 12; male, 12]) and Lrrc19 KO (L19KO, n = 24 [female, 12; male, 12]) mice on standard chow. (B and C) Morphology of gut and cecum from representative WT (B) and Lrrc19 KO (C) mice after eating standard chow for 2 years. (D) qRT-PCR analyses (top) of TNF-α, IL-1β (IL1b), IL-6, IFNγ (IFNg), IL-17, and IL-12 and immunoblot (bottom) of pp-65 and pSTAT3 in colon tissues of WT (n = 6) and Lrrc19 KO (n = 6) mice after standard chow for 2 years. RE, relative expression; M, male; F, female. (E) H&E staining of representative WT and Lrrc19 KO mouse colons after standard chow for 2 years. The green arrow indicates inflammatory response cells. Scale bars, 40 μm. (F) Immunostaining of PCNA, β-catenin, and COX2 in colon tissues of representative WT and Lrrc19 KO mice. The green arrows indicate PCNA, β-catenin, and COX2. Scale bars, 40 μm. p < 0.05, ∗∗p < 0.01 (Wilcoxon’s test in A [top], ANOVA in A [bottom], t test in D; mean ± SD). See also Figure S1.
Figure 2
Figure 2
Lrrc19 KO Mice Are Highly Resistant to DSS-Induced Colitis (A) Survival (top) and body weight (bottom) were monitored after the start of DSS. WT (n = 18, male) and Lrrc19 KO (n = 18, male) mice were fed a 2% DSS solution in drinking water for 7 days and then switched to regular drinking water. (B) Length of WT and Lrrc19 KO colon tissues. Mice were sacrificed on day 7 after the start of DSS, and colon length was measured. (C) H&E staining and histological scores of representative distal colon samples from WT and Lrrc19 KO mice on day 7 after the start of DSS. Histological scores were assessed according to the methods described in the Supplemental Experimental Procedures. (D) Incidence of colon carcinoma in WT (n = 18, male) and Lrrc19 KO (n = 18, male) mice after AOM-2% DSS treatment for 3 months. (E) Morphology and tumor numbers of colon carcinoma in WT and Lrrc19 KO mice after AOM-2% DSS treatment for 3 months. (F) Histopathological changes in representative distal colon samples from Lrrc19 KO and WT mice after staining with H&E. (G) Immunostaining of PCNA, COX2, and BrdU in colon tissues of representative WT and Lrrc19 KO mice. Colon samples from Lrrc19 KO and WT mice were stained by anti-PCNA or anti-COX2 antibodies. For the BrdU assay, mice were injected intraperitoneally with BrdU, and the colon sections were stained by anti-BrdU antibodies after 4 hr. Brown, PCNA; green, COX2 or BrdU. Scale bars, 40 μm. p < 0.05, ∗∗p < 0.01 (Wilcoxon’s test in A [top], ANOVA in A [bottom], t test in B and D, mean ± SD; Mann-Whitney U test in C and E).
Figure 3
Figure 3
LRRC19 Deficiency Affects Maturation of Gut-Associated Lymphoid Tissues (A and B) Visible PP number (A) and sizes (B) in the guts of WT and Lrrc19 KO mice. (C) Absolute numbers of CD4+T cells, CD8+ T cells, CD11c+MHCII+ cells, F4/80+MHCII+ cells, and CD11b+Gr1+ cells in colon tissues. The absolute numbers were standardized by calculating the numbers per l cm of colon. (D) Numbers of CD11c+CD103+CD11bDCs (pp-CD103+DC), CD11C+CD103+CD11b+ DCs (PP-DP-DC), CD11C+CD11bCD103DCs (PP-DNDC), and CD11C+CD11b+ (PP-CD11b+DC) in PPs as assessed by flow cytometry analysis. (E and F) Number of CD4+, CD8+, CD4+Foxp3+, CD4+IL-17+, and CD4+IFNγ+ T cells in PPs (E) and MLNs (F). Cell numbers in age- and sex-matched WT (n = 6) and Lrrc19 KO (n = 6) mice were compared. p < 0.05, ∗∗p < 0.01 (Mann-Whitney U test). The data are representative of three independent experiments. See also Figures S2 and S3.
Figure 4
Figure 4
LRRC19 Deficiency Reduces the Expression of Chemokines CCL6, CCL9, CXCL9, and CXCL10 (A) Microarray analyses of gene expression in WT and Lrrc19 KO mice given standard chow. (B) qRT-PCR (top) and immunoblot (bottom) of CCL6, CCL9, CXCL9, and CXCL10 in WT and Lrrc19 KO colon epithelial cells. (C) Size of visible PP and MLN in L19 KO mice with (KO/CC) or without (KO) CCL6-, CCL9-, CXCL9-, and CXCL10-expressing adenovirus injection. (D) Absolute number of CD4+ and CD8+ T cells, CD11C+MHCII+ DCs, F4/80MHCII, and CD11b+Gr1+ cells in colon tissue of L19 KO mice with or without (control adenovirus only) chemokine adenovirus injection as assessed by flow cytometric analysis. CC, CCL6-, CCL9-, CXCL9-, and CXCL10-expressing adenovirus complexes; WT, cell numbers from the colon tissues of WT mice. (E) Survival (right) and body weight (left) were monitored until day 14 after the start of DSS. L19 KO mice with (n = 18) or without (n = 18) CCL6, CCL9, CXCL9, and CXCL10 adenovirus injection were fed a 2% DSS solution in drinking water for 7 days and then switched to regular drinking water. p < 0.05, ∗∗p < 0.01 (t test in B, mean ± SD; Mann-Whitney U test in C and D; Wilcoxon’s test in E (right); ANOVA in E (left). See also Figure S4.
Figure 5
Figure 5
The LRRC19-Associated Gut Microbiota Modulates the Expression of Chemokines (A and B) 16S rRNA analyses of gut microbiota of WT and Lrrc19 KO mice. The samples were clustered at the operational taxonomic unit (OTU) (A) and phylum (B) levels using the sample OTU and sample phylum count matrices, respectively. (C) qRT-PCR of gut microbiota. The abundance of bacteria in WT and Lrrc19 KO mice was measured as bacterium-specific 16S rRNA copy numbers by qPCR analysis of fecal pellets. Standard curves were prepared from serial dilution of E. coli genomic 16S rRNA extracted in the same manner as above. (D) qRT-PCR and immunoblot of CCL6, CCL9, CXCL9, and CXCL10 in WT and GF mice. (E) qRT-PCR and immunoblot of CCL6, CCL9, CXCL9, and CXCL10 in GF+WT and GF+L19KO mice. GF+WT, GF mice transplanted with the microbiota from the feces of WT mice; GF+L19KO, GF mice transplanted with microbiota from the feces of Lrrc19 KO mice. (F) Immunostaining of CCL6, CCL9, CXCL9, and CXCL10 in GF+WT and GF+L19KO mice. Scale bars, 40 μm. p < 0.05, ∗∗p < 0.01 (Mann-Whitney U test in C; t test in D and E, mean ± SD). See also Table S1.
Figure 6
Figure 6
Expression of Chemokines Is Associated with the REG-Mediated Microbiota (A) Microarray analysis of gene expression in gut tissues of WT and Lrrc19 KO mice. (B) qRT-PCR (top) and immunoblot (bottom) of REG3α, REG3β, REG3γ, and REG4 in WT and Lrrc19 KO colon tissues. (C) qRT-PCR of gut microbiotas. The abundance of bacteria in L19 KO mice with (KO/REGs) or without (KO, control adenoviruses only) REG3α-, REG3β-, REG3γ-, and REG4-expressing adenovirus injection was measured as 16S rRNA copy numbers by qPCR analysis of fecal pellets. Standard curves were prepared from serial dilution of E. coli genomic 16S rRNA extracted in the same manner as above. (D) qRT-PCR and immunoblot of CCL6, CCL9, CXCL9, and CXCL10 in L19 KO mice with or without (control adenoviruses only) REG adenovirus injection. Adenovirus-Reg3α, -Reg3β, -Reg3γ, and -Reg4 complexes (REG) or control adenovirus were injected intraperitoneally once per week, three times. (E) qRT-PCR and immunoblot of CCL6, CCL9, CXCL9, and CXCL10 in feces-transplanted mice. Mice were first treated using pan-antibiotics (1 g/l ampicillin, Sigma), 0.5 g/l vancomycin, 1 g/l neomycin sulfate, and 1 g/l metronidazole) in drinking water for 4 weeks and were then transplanted with microbiotas from feces. WT(fe), Lrrc19 KO mice transplanted with the microbiota from the feces of WT mice; L19KO(fe), Lrrc19 KO mice transplanted with the microbiota from the feces of Lrrc19 KO mice with control adenovirus injection; L19KO/REG(fe), Lrrc19 KO mice transplanted with the microbiota from the feces of REG adenovirus-administered Lrrc19 KO mice. Expression of CCL6, CCL9, CXCL9, and CXCL10 was analyzed 3 days after transplantation. p < 0.05, ∗∗p < 0.01 (Mann-Whitney U test in C; t test in D and E, mean ± SD). See also Figures S5, S6, and S7.
Figure 7
Figure 7
Exogenous LRRC19 Promotes the Occurrence and Development of Gut Inflammation (A) qRT-PCR (top) and immunoblot (bottom) of LRRC19 in LRRC19 adenovirus- (WT+ade) or control adenovirus (WT+NC)-injected mice. Colon tissues were lysed and analyzed for LRRC19 expression by anti-hemagglutinin (HA), with which LRRC19 was tagged in adenoviruses. (B) Survival (top) and body weight (bottom) were monitored until day 14 after the start of DSS. Mice with (Ade) and without LRRC19 (NC) adenovirus injection (n = 16, male) were fed a 2% DSS solution in drinking water for 7 days and then switched to regular drinking water. (C) Experimental design (top) and incidence and tumor numbers (bottom) of colon carcinoma in LRRC19 adenovirus- (WT+ade) (n = 16) or control adenovirus-administered (WT+NC) mice (n = 16) after AOM-2% DSS treatment for 3 months. (D) Absolute number of CD4+T cells, CD8+ T cells, CD11C+MHCII+ DCs, F4/80+MHCII+, and CD11b+Gr1+ cells in colon tissues of LRRC19 adenovirus- (AdeL19) or control adenovirus (NC)-injected mice (n = 6) as assessed by flow cytometry. The absolute numbers were standardized by calculating the numbers per l cm of colon. (E, F, and G) qRT-PCR (E and F) and immunoblot (G) of CCL6, CCL9, CXCL9, and CXCL10 and REG3α, REG3β, REG3γ, and REG4 in LRRC19 adenovirus (AdeL19)- or control adenovirus (NC)-injected mice (n = 6). Lanes 1–3 in (G) are representatives of six mice. p < 0.05, ∗∗p < 0.01 (Wilcoxon’s test in B [top]; ANOVA in B [bottom]; t test in A, C, D, E, and F, mean ± SD; Mann-Whitney U test in C for tumor number).

References

    1. Abreu M.T., Vora P., Faure E., Thomas L.S., Arnold E.T., Arditi M. Decreased expression of Toll-like receptor-4 and MD-2 correlates with intestinal epithelial cell protection against dysregulated proinflammatory gene expression in response to bacterial lipopolysaccharide. J. Immunol. 2001;167:1609–1616. - PubMed
    1. Aluwihare A.P. An ultrastructural study of the effect of neomycin on the colon in the human subject and in the conventional and the germ-free mouse. Gut. 1971;12:341–349. - PMC - PubMed
    1. Asensio V.C., Lassmann S., Pagenstecher A., Steffensen S.C., Henriksen S.J., Campbell I.L. C10 is a novel chemokine expressed in experimental inflammatory demyelinating disorders that promotes recruitment of macrophages to the central nervous system. Am. J. Pathol. 1999;154:1181–1191. - PMC - PubMed
    1. Benson M.J., Pino-Lagos K., Rosemblatt M., Noelle R.J. All-trans retinoic acid mediates enhanced T reg cell groWTh, differentiation, and gut homing in the face of high levels of co-stimulation. J. Exp. Med. 2007;204:1765–1774. - PMC - PubMed
    1. Brandl K., Plitas G., Schnabl B., DeMatteo R.P., Pamer E.G. MyD88-mediated signals induce the bactericidal lectin RegIII gamma and protect mice against intestinal Listeria monocytogenes infection. J. Exp. Med. 2007;204:1891–1900. - PMC - PubMed

Publication types

MeSH terms