

Interplay Between Intracellular Ca(2+) Oscillations and Ca(2+)-stimulated Mitochondrial Metabolism
- PMID: 26776859
- PMCID: PMC4725975
- DOI: 10.1038/srep19316
Interplay Between Intracellular Ca(2+) Oscillations and Ca(2+)-stimulated Mitochondrial Metabolism
Abstract
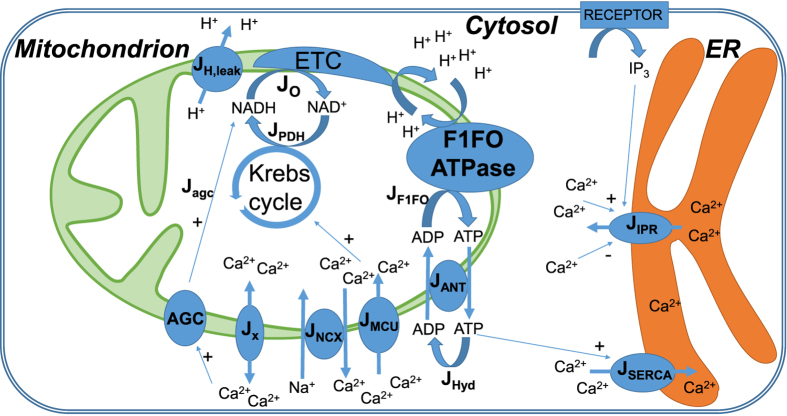
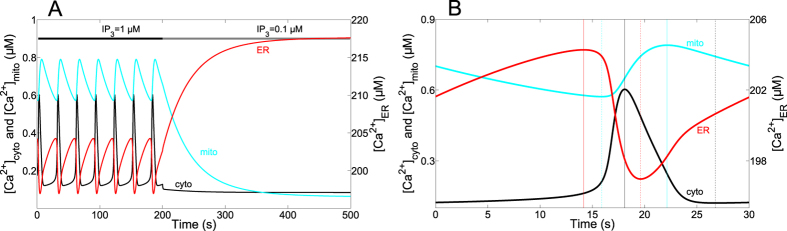
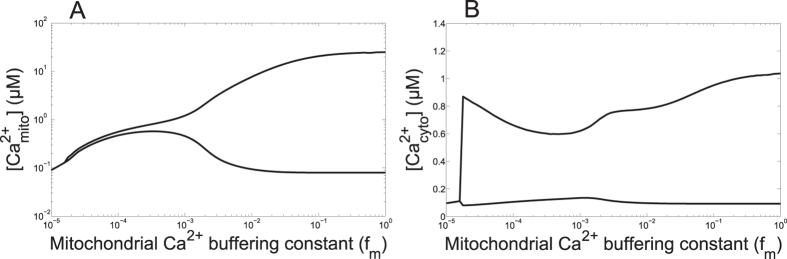
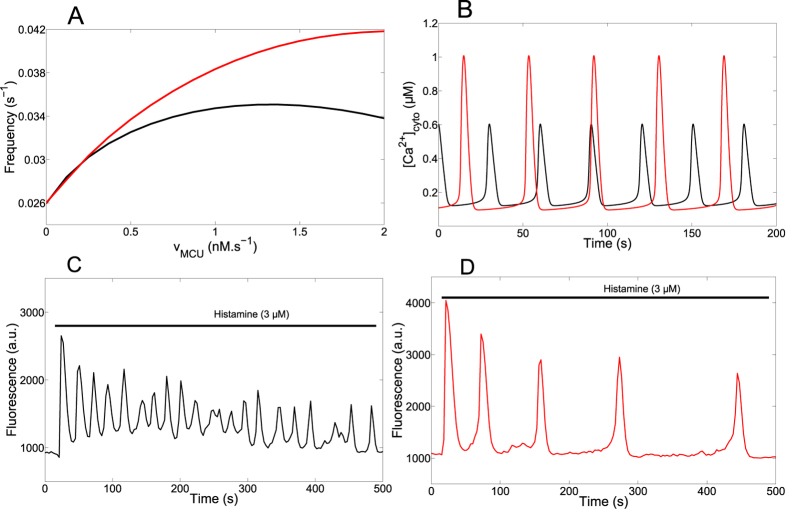
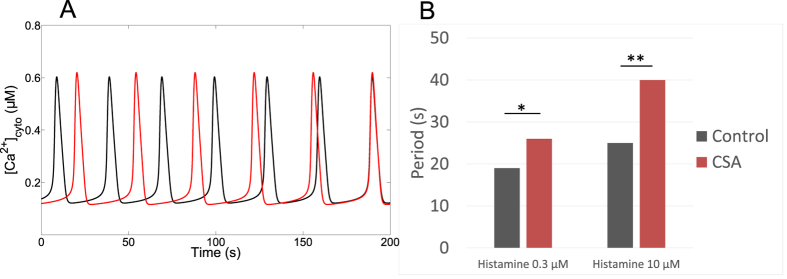
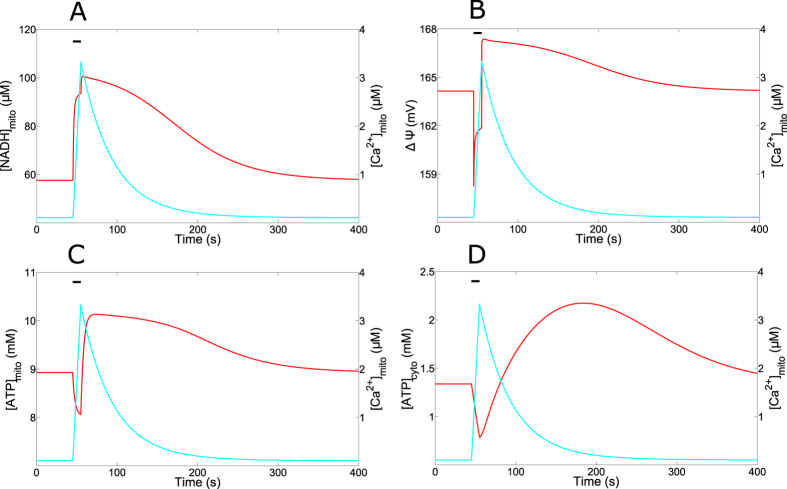
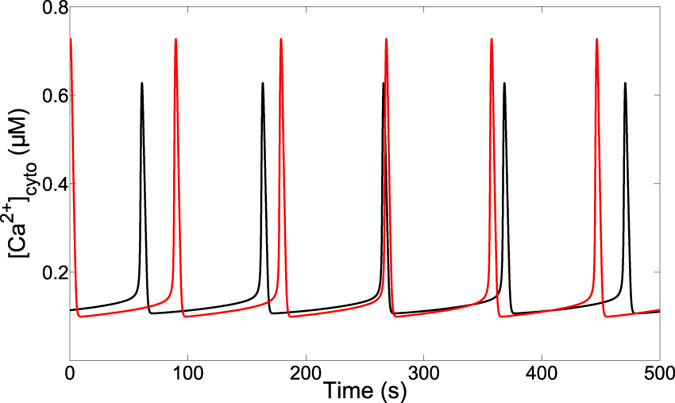
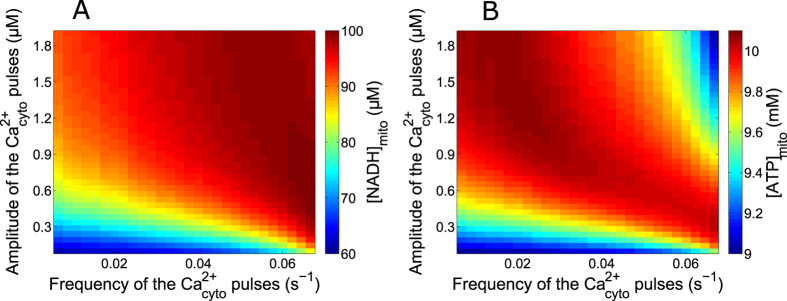
Oscillations of cytosolic Ca(2+) concentration are a widespread mode of signalling. Oscillatory spikes rely on repetitive exchanges of Ca(2+) between the endoplasmic reticulum (ER) and the cytosol, due to the regulation of inositol 1,4,5-trisphosphate receptors. Mitochondria also sequester and release Ca(2+), thus affecting Ca(2+) signalling. Mitochondrial Ca(2+) activates key enzymes involved in ATP synthesis. We propose a new integrative model for Ca(2+) signalling and mitochondrial metabolism in electrically non-excitable cells. The model accounts for (1) the phase relationship of the Ca(2+) changes in the cytosol, the ER and mitochondria, (2) the dynamics of mitochondrial metabolites in response to cytosolic Ca(2+) changes, and (3) the impacts of cytosol/mitochondria Ca(2+) exchanges and of mitochondrial metabolism on Ca(2+) oscillations. Simulations predict that as expected, oscillations are slowed down by decreasing the rate of Ca(2+) efflux from mitochondria, but also by decreasing the rate of Ca(2+) influx through the mitochondrial Ca(2+) uniporter (MCU). These predictions were experimentally validated by inhibiting MCU expression. Despite the highly non-linear character of Ca(2+) dynamics and mitochondrial metabolism, bioenergetics were found to be robust with respect to changes in frequency and amplitude of Ca(2+) oscillations.
Figures
Similar articles
-
Optimal microdomain crosstalk between endoplasmic reticulum and mitochondria for Ca2+ oscillations.Sci Rep. 2015 Jan 23;5:7984. doi: 10.1038/srep07984. Sci Rep. 2015. PMID: 25614067 Free PMC article.
-
Modeling the role of endoplasmic reticulum-mitochondria microdomains in calcium dynamics.Sci Rep. 2019 Nov 19;9(1):17072. doi: 10.1038/s41598-019-53440-7. Sci Rep. 2019. PMID: 31745211 Free PMC article.
-
The Mitochondrial Ca2+ uniporter is a central regulator of interorganellar Ca2+ transfer and NFAT activation.J Biol Chem. 2021 Oct;297(4):101174. doi: 10.1016/j.jbc.2021.101174. Epub 2021 Sep 6. J Biol Chem. 2021. PMID: 34499925 Free PMC article.
-
Calcium signalling in astroglia.Mol Cell Endocrinol. 2012 Apr 28;353(1-2):45-56. doi: 10.1016/j.mce.2011.08.039. Epub 2011 Sep 10. Mol Cell Endocrinol. 2012. PMID: 21945602 Review.
-
The ER-mitochondria Ca2+ signaling in cancer progression: Fueling the monster.Int Rev Cell Mol Biol. 2021;363:49-121. doi: 10.1016/bs.ircmb.2021.03.006. Epub 2021 Apr 12. Int Rev Cell Mol Biol. 2021. PMID: 34392932 Review.
Cited by
-
Fine tuning of cytosolic Ca (2+) oscillations.F1000Res. 2016 Aug 19;5:F1000 Faculty Rev-2036. doi: 10.12688/f1000research.8438.1. eCollection 2016. F1000Res. 2016. PMID: 27630768 Free PMC article. Review.
-
A Systems Biology Approach Towards a Comprehensive Understanding of Ferroptosis.Int J Mol Sci. 2024 Nov 2;25(21):11782. doi: 10.3390/ijms252111782. Int J Mol Sci. 2024. PMID: 39519341 Free PMC article.
-
The Function of Mitochondrial Calcium Uniporter at the Whole-Cell and Single Mitochondrion Levels in WT, MICU1 KO, and MICU2 KO Cells.Cells. 2020 Jun 22;9(6):1520. doi: 10.3390/cells9061520. Cells. 2020. PMID: 32580385 Free PMC article.
-
NLRP14 Safeguards Calcium Homeostasis via Regulating the K27 Ubiquitination of Nclx in Oocyte-to-Embryo Transition.Adv Sci (Weinh). 2023 Sep;10(27):e2301940. doi: 10.1002/advs.202301940. Epub 2023 Jul 26. Adv Sci (Weinh). 2023. PMID: 37493331 Free PMC article.
-
Circulating Mitochondrial DNA and Inter-Organelle Contact Sites in Aging and Associated Conditions.Cells. 2022 Feb 15;11(4):675. doi: 10.3390/cells11040675. Cells. 2022. PMID: 35203322 Free PMC article. Review.
References
Publication types
MeSH terms
Substances
LinkOut - more resources
Full Text Sources
Other Literature Sources
Miscellaneous
