. 2016 Jan 20;89(2):308-16.
doi: 10.1016/j.neuron.2015.12.017.

Arkypallidal Cells Send a Stop Signal to Striatum

Affiliations

Arkypallidal Cells Send a Stop Signal to Striatum

Nicolas Mallet et al. Neuron. .

Abstract

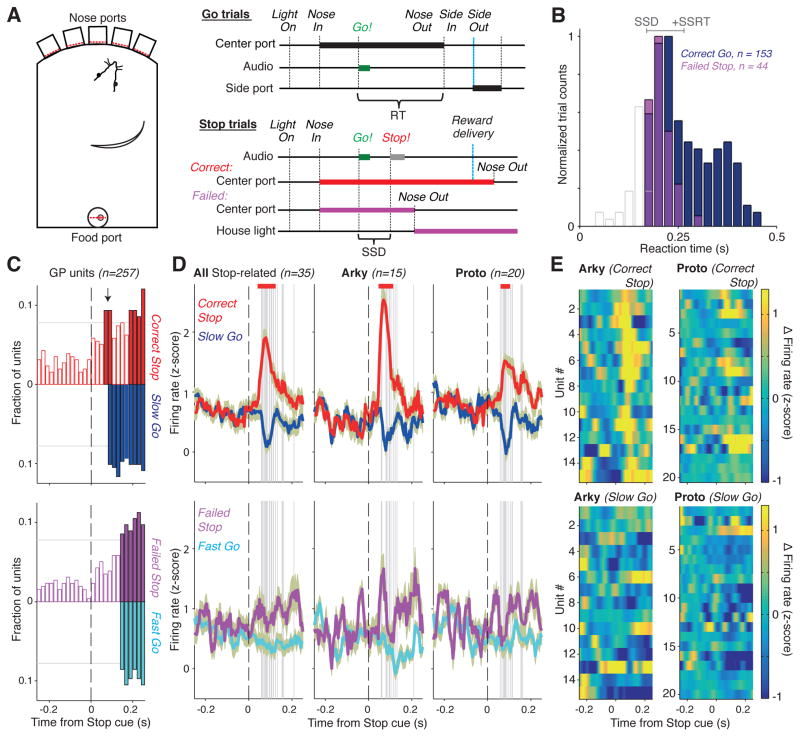
The suppression of inappropriate actions is critical for flexible behavior. Cortical-basal ganglia networks provide key gating mechanisms for action suppression, yet the specific roles of neuronal subpopulations are poorly understood. Here, we examine Arkypallidal (‘‘Arky’’) and Prototypical (‘‘Proto’’) globus pallidus neurons during a Stop task, which requires abrupt cancellation of an imminent action. We first establish that Arky neurons can be identified by their firing properties across the natural sleep/wake cycle. We then show that Stop responses are earlier and stronger in the Arky compared to the Proto subpopulation. In contrast to other basal ganglia neurons, pallidal Stop responses are selective to Stop, rather than Go, cues. Furthermore, the timing of these Stop responses matches the suppression of developing striatal Go-related activity. Our results support a two-step model of action suppression: actions-inpreparation are first paused via a subthalamic-nigral pathway, then cancelled via Arky GABAergic projections to striatum.


Conflict of interest statement

The authors declare no competing financial interests.

Figures

Figure 1
Figure 1. Properties of identified Arky and Proto neurons
(A) Schematic of bilateral electrocorticograms (ECoG) and craniotomies above GPe (B) Head-fixed recording durations for all neurons (n=135, in 8 rats). (C) Location of each labeled neuron, represented on sagittal atlas sections at the indicated medio-lateral levels. (D) An identified Proto neuron during the awake state (left) and natural slow-wave sleep (SWS). Vertical bars, 1mV (units) and 0.5 mV (ECoG); horizontal bars, 1s. Images at right show the cell body labeled with neurobiotin (Nb; red), and co-expressing Nkx2-1 (cyan), but not FoxP2 (gray). Insets show a FoxP2 positive/Nkx2-1 negative GPe neuron located in the same focal plane (positive control for FoxP2 labeling). Scale bars, 10 μm. (E) An identified Arky neuron, co-expressing PPE (green), and FoxP2 (grey). (F) Identified Protos (n=15) sho and SWS states. (G) Average firing rates for all identified neurons, and rate change during SWS. Box-and-whisker plots show lowest sample value, first quartile, median, third quartile, maximum value.
Figure 2
Figure 2. Classification of Arky and Proto neurons predicts oscillatory entrainment
(A) Properties of individual GPe neurons in head-restrained rats. CV was measured during SWS. Cells form two distinct clusters, as seen in the 3D-plot and the projection onto the first principal component (far right). (B) Same analysis for freely-moving GPe units also reveals 2 clusters. The bimodal principal component projection was used to classify neurons into putative Arky (light blue) and putative Proto (dark blue), with units near threshold left unclassified (grey). (C,D) Spike timing of putative Proto and Arky neurons during sleep spindle oscillations for the head-fixed (C) and freely-moving (D) datasets. Phase histograms on the left sides show mean spike phases, with solid bars indicating units with significant phase-locking. Arrows show population average phase for these entrained units. Empty bars show mean phases of the other units within a subpopulation. Dashed sine waves indicate phase of the idealized frontal ECoG rhythm, i.e. peaks are maximal positive voltage at brain surface. Right plots show entrainment strength as measured by the mean resultant length (arrows indicate overall population average). Arkys are more strongly entrained to natural sleep spindle oscillations than Protos, and show distinct phase preference.
Figure 3
Figure 3. GPe Stop responses
(A) Task setup. Reaction time (RT) is measured between Go cue onset and Nose Out. For Stop trials, the time between the onsets of Go and Stop cues is the Stop-signal delay (SSD). (B) RT distributions from a single session. White bars show trials with an RT faster than the SSD (so no Stop cue was presented). Grey line at the top indicates SSD (170ms; left end) and SSRT (95ms; line length) for this session, which also included 64 Correct Stop trials. (C) Fraction of units with significant trial-type-dependent firing at each moment (red, Correct Stop > Slow Go; blue, Slow Go > Correct Stop; magenta, Failed Stop > Fast Go; cyan, Fast Go > Failed Stop). Filled bars denote significant population differences (thin horizontal line shows significance threshold). A GPe subset had short-latency responses to the Stop signal (top, two filled red bars soon after the vertical dashed line); these cells are examined further in panels D,E. This short-latency GPe response was not seen on Failed Stop trials (bottom). (D) Activity time courses (± SEM) for Stop-responsive GPe neurons. Vertical grey lines indicate SSRT in the corresponding sessions. Bars mark significant differences in firing rate between the shown trial types (shuffle tests, corrected for multiple comparisons). Separating Stop-related neurons into Arkys and Protos (2nd and 3rd columns) reveals stronger Correct Stop responses for Arkys. (E) Individual unit activity showing Stop responses (top). Units are sorted by time of peak response (from 50–150ms after Stop cue). Bottom panels show the same units, in the same order, during Slow Go trials (i.e. without Stop cue; alignment made to SSD).
Figure 4
Figure 4. Multiple basal ganglia circuits for action suppression
(A) Single-unit responses to Stop compared to Go cues. Selective responses to the Stop cue are seen only for GPe subpopulations (p-values, significance from shuffle tests). STN, SNr, Str data are from Schmidt et al., 2013). (B) Mean firing rate time courses for Stop-related units. Solid lines, normalized Stop responses; dotted lines Go responses; shading indicates ± SEM). Colored bars at the top indicate significant differences. (C) Comparison of Stop response timing between basal ganglia. (Left) Mean firing rates (z-scores, shifted to a common baseline) of units with short-latency Stop responses in STN, SNr and GPe. (Right) Cumulative distributions of single-unit Stop response latencies. (D) Relative timing of GPe and Str activity. On Correct Stop trials Str activity (red) shows an abrupt decrease after the Stop cue, compared to Slow Go trials (green). The prominent Arky Stop response occurs just before this decrease, consistent with a role for Arky neurons in suppressing Str movement-related activity (E,F) Two-step race model. (E) Left, variable Go process timing (green lines) leads to variable RTs. Salient sensory cues (Go or Stop) evoke a rapid Pause process (orange), that transiently elevates Go threshold (black dotted line). In Correct Stop trials (right) this buys additional time for the Stop process to finish before the Go process. (F) Left, Go process completion likely involves increased activity in the Str direct pathway to SNr. Middle, salient cues cause a rapid, less-selective and transient pause in movement initiation via PPN, STN and SNr. Right,Arky GABAergic projections to Str abolish movement preparation. Abbreviations: Ctx, cortex; Thal, thalamus; SC, PPN, pedunculopontine nucleus; superior colliculus.

Comment in

References

    1. Abdi A, Mallet N, Mohamed FY, Sharott A, Dodson PD, Nakamura KC, Suri S, Avery SV, Larvin JT, Garas FN, Garas SN, Vinciati F, Morin S, Bezard E, Baufreton J, Magill PJ. Prototypic and arkypallidal neurons in the dopamine-intact external globus pallidus. J Neurosci. 2015;35:6667–6688. - PMC - PubMed
    1. Aron AR. From reactive to proactive and selective control: developing a richer model for stopping inappropriate responses. Biol Psychiatry. 2011;69:e55–e68. - PMC - PubMed
    1. Aron AR, Poldrack RA. Cortical and subcortical contributions to Stop signal response inhibition: role of the subthalamic nucleus. J Neurosci. 2006;26:2424–2433. - PMC - PubMed
    1. Bari A, Robbins TW. Inhibition and impulsivity: behavioral and neural basis of response control. Prog Neurobiol. 2013;108:44–79. - PubMed
    1. Benhamou L, Bronfeld M, Bar-Gad I, Cohen D. Globus Pallidus external segment neuron classification in freely moving rats: a comparison to primates. PLoS One. 2012;7:e45421. - PMC - PubMed

Publication types