. 2016 Jan 18:7:10305.
doi: 10.1038/ncomms10305.

Tumour cell-derived Wnt7a recruits and activates fibroblasts to promote tumour aggressiveness

Affiliations

Tumour cell-derived Wnt7a recruits and activates fibroblasts to promote tumour aggressiveness

Alexandra Avgustinova et al. Nat Commun. .

Abstract

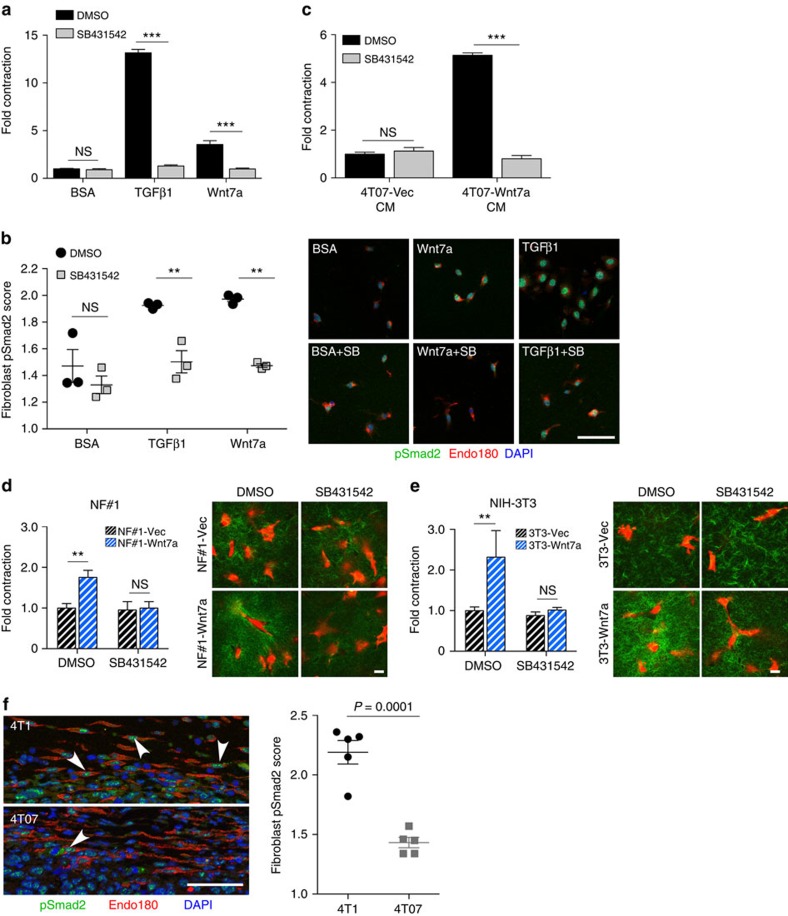
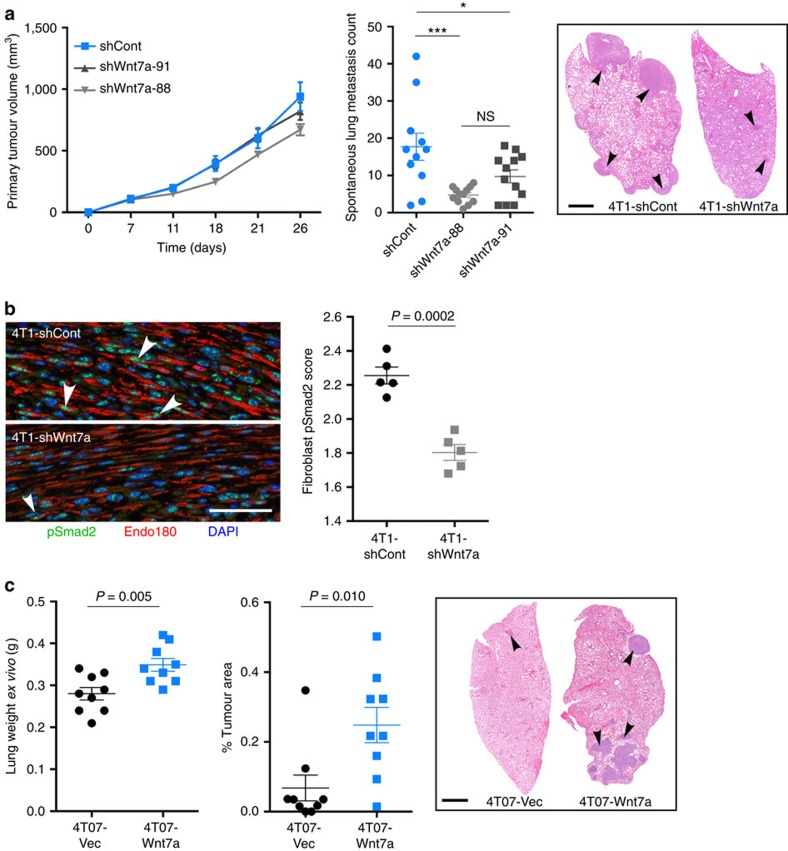
Stromal fibroblast recruitment to tumours and activation to a cancer-associated fibroblast (CAF) phenotype has been implicated in promoting primary tumour growth and progression to metastatic disease. However, the mechanisms underlying the tumour:fibroblast crosstalk that drive the intertumoural stromal heterogeneity remain poorly understood. Using in vivo models we identify Wnt7a as a key factor secreted exclusively by aggressive breast tumour cells, which induces CAF conversion. Functionally, this results in extracellular matrix remodelling to create a permissive environment for tumour cell invasion and promotion of distant metastasis. Mechanistically, Wnt7a-mediated fibroblast activation is not dependent on classical Wnt signalling. Instead, we demonstrate that Wnt7a potentiates TGFβ receptor signalling both in 3D in vitro and in vivo models, thus highlighting the interaction between two of the key signalling pathways in development and disease. Importantly, in clinical breast cancer cohorts, tumour cell Wnt7a expression correlates with a desmoplastic, poor-prognosis stroma and poor patient outcome.


Figures

Figure 1
Figure 1. Differential CAF recruitment and activation in vivo.
(a) 4T07, 410.4 and 4T1 orthotopic tumours in Balb/c mice were formalin-fixed and paraffin-embedded and sections stained with FITC–αSMA (green) and endosialin followed by Alexa 555-anti-rabbit-IgG (red). Nuclei were counterstained with 4,6-diamidino-2-phenylindole (DAPI; blue). Representative confocal images are shown. Dashed line indicates the border between tumour, T, and stroma, S. Scale bar, 75 μm. Low-power images are shown in Supplementary Fig. 1a. (b) Isolation of tumour cells and CAFs. 4T07, 410.4 and 4T1 cells were inoculated into the fourth mammary fat pad of Ub-GFP Balb/c mice. Confocal images of 4T1 and 4T07 tumours showing GFP-negative tumour cells and GFP-positive stromal cells. Scale bar, 25 μm. Tumours were dissociated and subject to FACSorting. Shown are representative FACS profiles from 4T1 and 4T07 tumours. Right panel shows the number of GFP+; CD45− fibroblasts as a percentage of live cells in individual 4T07 (n=14) and 4T1 (n=7) tumours. Comparison made using Student's t-test. (c,d) Tumour cells and fibroblasts from three independent isolates were directly lysed for RNA extraction. (c) Acta2, Tagln and Tgfb1 mRNA expression in normal MGFs and CAFs monitored using qPCR. Data shown are the mean±s.e.m. relative quantification (RQ) values from three independent biological replicates. (d) Tumour cells were subject to whole-genome expression profiling. Dendrogram shows correlation-centred hierarchical clustering based on average linkage. Shown are tumour cell expression data of probes significantly differentially expressed between 410.4/4T1 and 4T07 tumour cells with a fold change >2 (498 probes). (e) qPCR validation of selected genes from independently FACSorted tumour cell samples. n, non-detectable. Data shown are the mean±s.e.m. RQ values from three independent biological replicates.
Figure 2
Figure 2. Wnt7a promotes fibroblast recruitment and activation in vivo and in vitro.
(a,b) 4T07 cells were injected bilaterally into the fourth mammary fat pads of wild-type Balb/c mice (four to five mice per group) and treated with recombinant growth factors (see Methods section). (a) Data represent the mean tumour volume±s.e.m. (see Supplementary Fig. 2a for tumour weights). Groups were compared with two-way ANOVA followed by Bonferroni post-test. No statistically significant differences were found. (b) Tumours were stained for αSMA-FITC (green) and endosialin followed by Alexa 555-anti-rabbit-IgG (red). Nuclei were counterstained with DAPI (blue). Representative confocal images are shown. T, tumour; S, stroma; arrowheads, peritumoural blood vessels. Scale bar, 150 μm. See Supplementary Fig. 2b for separated images. (c) NF#1 fibroblasts were treated with vehicle or 100 ng ml−1 Wnt7a and viable cell amount monitored by CellTiter-Glo assay at the indicated time points. Data represent the mean values from four wells per condition at each time point±s.e.m. (d) Tumour (GFP−; CD45−), immune cell (GFP–; CD45–) and CAF (GFP–; CD45−) populations from 4T1, 410.4 and 4T07 tumours. Wnt7a mRNA expression was monitored using qPCR as described in b. n, non-detectable. Data shown are the mean±s.e.m. RQ values from two independent biological replicates.
Figure 3
Figure 3. Wnt7a promotes fibroblast recruitment and activation in vivo and in vitro.
Quantification of αSMA staining in primary tumours following ectopic expression of Wnt7a (see Supplementary Fig. 3 for qPCR analysis). Left panels show quantification of αSMA staining. Right panels show representative images of αSMA staining. (a) Balb/c mice inoculated with 5 × 10⁵ parental 4T1, parental 4T07, vector-transfected 4T07 (4T07-Vec) and 4T07-expressing Wnt7a (4T07-Wnt7a) cells. Tumours were removed on day 30. Tumour numbers; 4T1, n=5; 4T07, 4T07-Vec, 4T07-Wnt7a, n=9 or 10. Scale bar, 100 μm. (b) Balb/c mice inoculated with 3 × 10⁶ 168FARN-Vec or 168FARN-Wnt7a cells. Tumours were removed on day 12. Data shown are from five mice per group. Scale bar, 100 μm. (c) 2 × 10⁶ ZR75.1-Vec and ZR75.1-Wnt7a were inoculated into nonobese diabetic severe combined immunodeficient mice. Tumours were removed on day 28. Data shown are from four mice per group. Scale bar, 50 μm. (d) NF#1 MGFs embedded in collagen gels were treated with BSA or Wnt7a (100 ng ml−1) or conditioned medium from 4T07 cells transfected with vector alone (4T07-Vec CM) or Wnt7a (4T07-Wnt7a CM) for 72 h. Data show quantification of matrix remodelling as monitored by gel contraction±s.e.m. Equivalent results were obtained in three independent experiments (e) NIH-3T3 fibroblasts expressing empty vector (3T3-Vec) or Wnt7a (3T3-Wnt7a) were assayed as described in d. All comparisons were made using Student's t-test.
Figure 4
Figure 4. Wnt7a signalling in fibroblasts.
NF#1 or NIH-3T3 fibroblasts were plated on Softwell hydrogels in serum-free Advanced DMEM. Twenty-four hours later, cells were treated with BSA or Wnt7a (100 ng ml−1) for 24 h. (a) Cells were fixed and stained for αSMA-FITC (green). Nuclei were counterstained with DAPI. Scale bar, 100 μm. Right panel, % cells with strong αSMA fibres±s.e.m. Comparison was made using Student's t-test. (b,c) Samples were subjected to immunoblotting with the indicated antibodies. Molecular size markers are in kDa.
Figure 5
Figure 5. Wnt7a and TGFβ pathways converge during myofibroblast conversion.
(a) NF#1 fibroblast matrix remodelling assay. NF#1 fibroblasts embedded in collagen gels were treated with BSA, Wnt7a or TGFβ1 in the presence or absence of SB43152 for 72 h. Recombinant Wnt7a was pre-absorbed with a neutralizing anti-TGFβ antibody before use (see Methods). Data show quantification of matrix remodelling by NF#1 fibroblasts±s.e.m. Groups were compared using two-way ANOVA followed by Bonferroni post-test. ***P<0.001. Equivalent results were obtained in two independent experiments. (b) Remodelled gels from a were fixed, sectioned and stained with antibodies against the pan-fibroblast marker Endo180 (Mrc2) (red) and phospho-Smad2 (green). Nuclei were counterstained with DAPI. Left panel, the mean fibroblast phospho-Smad2 scores±s.e.m. (n=3 remodelled gels in each group). One-way ANOVA with Bonferroni post-test was used to compare groups. **P<0.01. Right panel, representative images. Scale bar, 150 μm. (c) NF#1 fibroblasts embedded in collagen gels were treated with conditioned medium from 4T07 cells transfected with vector alone (4T07-Vec CM) or Wnt7a (4T07-Wnt7a CM) in the presence or absence of SB43152 (10 μM) for 72 h. Conditioned media were pre-absorbed with a neutralizing anti-TGFβ antibody before use (see Methods). Data show quantification of matrix remodelling±s.e.m. Two-way ANOVA with Bonferroni post-test was used to compare groups. ***P<0.001. (d,e) NF#1 or NIH-3T3 fibroblasts transfected with vector alone (−Vec) or Wnt7a (−Wnt7a) embedded in collagen gels were cultured in the presence or absence of SB43152 (10 μM). Data show quantification of matrix remodelling from five independent experiments±s.e.m. Groups were compared using two-way ANOVA. **P<0.01. Representative confocal images of NF#1 and NIH-3T3 gels stained with TRITC-phalloidin (red) and second-harmonic emission to image collagen density (green). Scale bar, 20 μm. (f) 4T1 and 4T07 tumour sections were stained for Endo180 (Mrc2) (red) and phospho-Smad2 (green). Nuclei were counterstained with DAPI. Left panel, representative images taken from the tumour–stroma interface. Arrowheads indicate Endo180-positive fibroblasts with high nuclear phospho-Smad2. Scale bar, 50 μm. Right panel, the mean fibroblast phospho-Smad2 scores (n=5 tumours in each group). Comparison was made using Student's t-test.
Figure 6
Figure 6. Wnt7a-driven myofibroblast conversion increases tumour cell invasion.
(a) Organotypic assays of breast cancer cell invasion into NF#1 fibroblast-containing matrix. Left panel: quantification of invasion index (a.u.) by measuring the total area over which cancer cells had dispersed (including invading and non-invading cells) and the area of non-invading cells. The value shown is the average 1—(non-invading area/total area) of at least 13 measurements±s.e.m. Right panel, representative images used for invasion index measurements. Scale bar, 50 μm. Two-way ANOVA with Bonferroni post-test used to compare groups. ***P<0.001. Equivalent results were obtained in two independent experiments. (b) Organotypic assays of cell invasion into a NF#1 fibroblast-conditioned matrix. Left panel: quantification of invasion index (a.u.) and statistical analysis as in a for seven measurements per gel±s.e.m. Right panel: representative images used for invasion index measurements. Scale bar, 50 μm. Two-way ANOVA with Bonferroni post-test used to compare groups. **P<0.01. Equivalent results were obtained in two independent experiments.
Figure 7
Figure 7. Wnt7a promotes tumour metastasis and activates the TGFβ pathway in fibroblasts.
(a) In all, 1 × 10⁴ 4T1 cells infected with control (4T1-shCont) or two independent Wnt7a (4T1-shWnt7a-91 and 4T1-sh-Wnt7a-88) shRNAs (see Supplementary Fig. 6a for qPCR analysis) were inoculated into Balb/c mice, n=11–12 mice per group. Primary tumour volume was measured until tumours reached maximum size (day 26), P=NS (nonsignificant). One-way ANOVA with Bonferroni post-test used to compare groups. *P<0.05; ***P<0.001. Metastasis to the lung was quantified as the number of tumour nodules from sections taken mid-way through the lung. Representative histology sections of metastases in the lungs are shown. Arrowheads indicate tumour nodules. Scale bar, 1 mm. (b) 4T1-shCont and 4T1-shWnt7a primary tumours were fixed, paraffin-embedded, and phospho-Smad2 nuclear localization in fibroblasts at the tumour–stroma interface was quantified as in Fig. 5b. Left panel, representative images taken at the tumour–stroma interface. Arrowheads indicate Endo180-positive fibroblasts with high nuclear phospho-Smad2. Right panel, data shown are the mean fibroblast phospho-Smad2 scores per tumour (n=5 tumours in each group). (c) In all, 2.5 × 10⁵ 4T07-Vec or 4T07-Wnt7a cells were inoculated into the tail vein of Balb/c mice. Mice were killed on day 19 and tumour burden in the lung was assessed by lung weight and quantification of % tumour area from sections taken mid-way through the lung. Data shown are from nine mice per group±s.e.m. Comparison was made using Student's t-test. Representative histology images are shown. Arrowheads indicate tumour nodules. Scale bar, 1 mm.
Figure 8
Figure 8. Tumour Wnt7a expression correlates with breast cancer stromal activation and patient outcome.
(a) A tissue microarray comprising 65 scoreable invasive breast cancers and 5 normal breast samples was assessed for Wnt7a and αSMA expression using immunohistochemistry. Shown are representative 0.6-mm cores with low or high tumour cell Wnt7a expression, and the matched αSMA-stained cores. Graph shows correlation of Wnt7a expression with the ‘fibroblast activation score' (see Methods section). (b) Assessment of Wnt7a protein expression and fibroblast activation in an independent (Leeds) tissue microarray comprising 347 scoreable breast tumours using the same scoring criteria as in a. (c) Kaplan–Meier curve showing Wnt7a high protein expression in the Leeds samples was significantly associated with decreased overall survival (P=0.0273, log-rank Mantel–Cox). (d) Cox multivariate analysis showing that Wnt7a expression in the Leeds samples is a significant predictor of overall survival independent of oestrogen receptor (ER), grade and lymph node (LN) status. Hazard ratios with 95% confidence intervals (CIs) are shown. (e) Correlation of WNT7A expression with the Finak SDPP. Unsupervised hierarchical clustering of the SDPP genes and WNT7A was performed with the 522 primary breast cancers available in the TCGA data set. WNT7A was clustered with the poor-prognosis SDPP genes. Pearson correlation showed a significant correlation between WNT7A expression with centroid gene expression of the SDPP poor-prognosis group (r=0.213, P<0.0001). (f) WNT7A expression was examined in the TCGA data set of breast cancers (n=514). Using one-way ANOVA and Tukey's multiple comparison test, high WNT7A gene expression was significantly associated with the basal-like intrinsic subtype (P<0.0001). (g,h) Kaplan–Meier curves showing high WNT7A expression in 533 systemically untreated breast cancers, and the 73 systemically untreated basal breast cancers is significantly associated with poor distant metastasis-free survival (P=0.0382 and P=0.0427, log-rank Mantel–Cox, respectively).

References

    1. De Wever O., Demetter P., Mareel M. & Bracke M. Stromal myofibroblasts are drivers of invasive cancer growth. Int. J. Cancer 123, 2229–2238 (2008). - PubMed
    1. Kalluri R. & Zeisberg M. Fibroblasts in cancer. Nat. Rev. Cancer 6, 392–401 (2006). - PubMed
    1. Pietras K. & Ostman A. Hallmarks of cancer: interactions with the tumour stroma. Exp. Cell Res. 316, 1324–1331 (2010). - PubMed
    1. Schafer M. & Werner S. Cancer as an overhealing wound: an old hypothesis revisited. Nat. Rev. Mol. Cell Biol. 9, 628–638 (2008). - PubMed
    1. Cirri P. & Chiarugi P. Cancer-associated-fibroblasts and tumour cells: a diabolic liaison driving cancer progression. Cancer Metastasis Rev. 31, 195–208 (2012). - PubMed

Publication types