. 2016 Mar 15:262:21-31.
doi: 10.1016/j.jneumeth.2016.01.010. Epub 2016 Jan 14.

An optimized surgical approach for obtaining stable extracellular single-unit recordings from the cerebellum of head-fixed behaving mice

Affiliations

An optimized surgical approach for obtaining stable extracellular single-unit recordings from the cerebellum of head-fixed behaving mice

Joshua J White et al. J Neurosci Methods. .

Abstract

Background: Electrophysiological recording approaches are essential for understanding brain function. Among these approaches are various methods of performing single-unit recordings. However, a major hurdle to overcome when recording single units in vivo is stability. Poor stability results in a low signal-to-noise ratio, which makes it challenging to isolate neuronal signals. Proper isolation is needed for differentiating a signal from neighboring cells or the noise inherent to electrophysiology. Insufficient isolation makes it impossible to analyze full action potential waveforms. A common source of instability is an inadequate surgery. Problems during surgery cause blood loss, tissue damage and poor healing of the surrounding tissue, limited access to the target brain region, and, importantly, unreliable fixation points for holding the mouse's head.

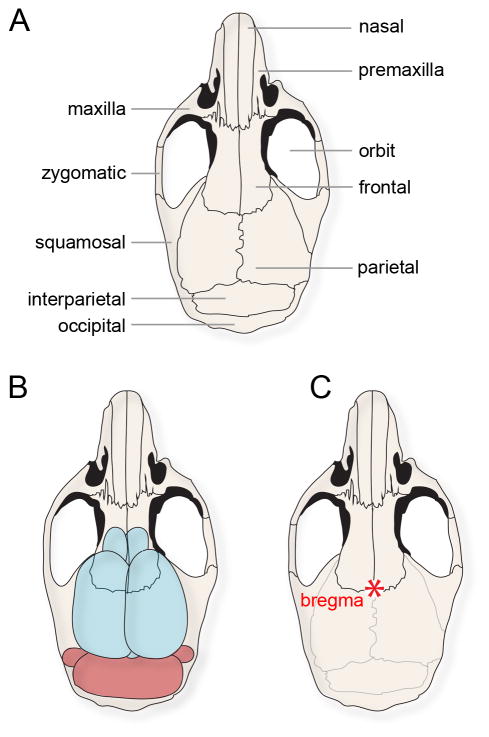
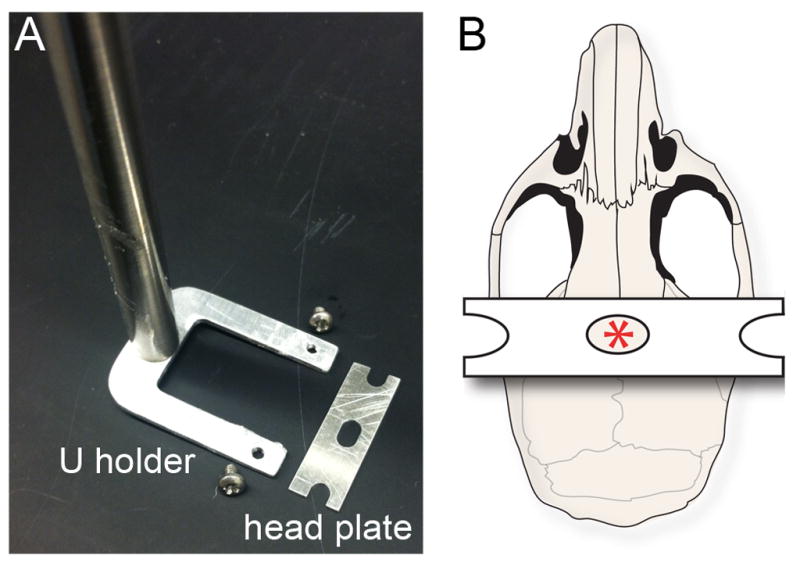
New method: We describe an optimized surgical procedure that ensures limited tissue damage and delineate a method for implanting head plates to hold the animal firmly in place.

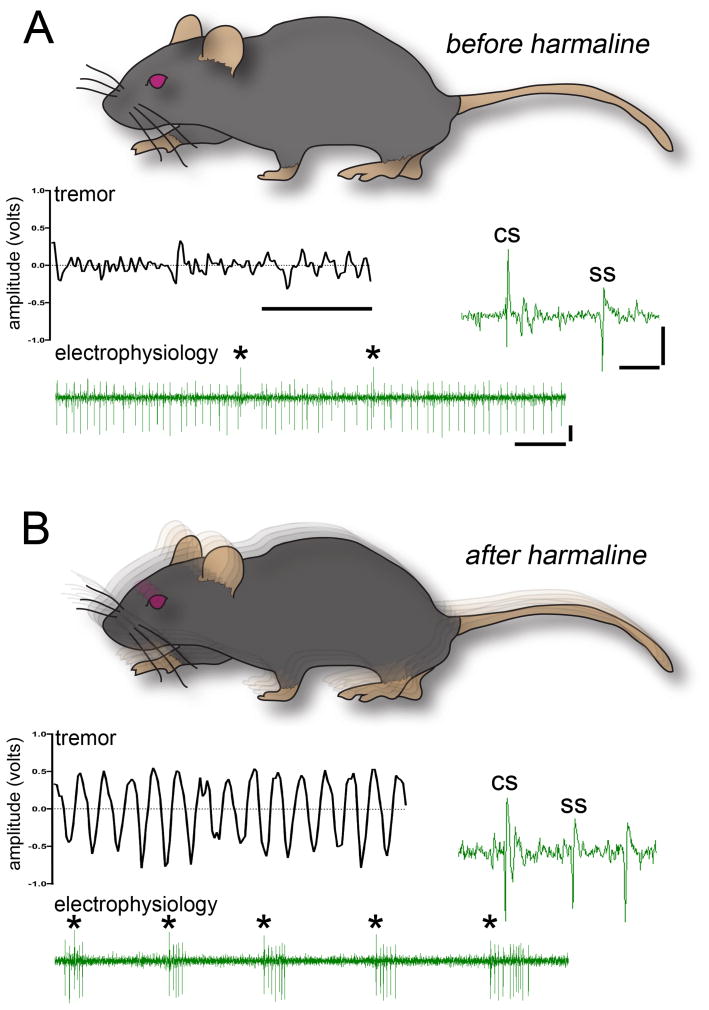
Results: Using the cerebellum as a model, we implement an extracellular recording technique to acquire single units from Purkinje cells and cerebellar nuclear neurons in behaving mice. We validate the stability of our method by holding single units after injecting the powerful tremorgenic drug harmaline. We performed multiple structural analyses after recording.

Comparison with existing methods: Our approach is ideal for studying neuronal function in active mice and valuable for recording single-neuron activity when considerable motion is unavoidable.

Conclusions: The surgical principles we present for accessing the cerebellum can be easily adapted to examine the function of neurons in other brain regions.

Keywords: Action potential; Behavior; Cerebellum; Electrophysiology; Surgery; Tremor.


Conflict of interest statement

Conflicts of Interest: We have nothing to disclose.

Figures

Fig. 1
Fig. 1
(A) Purkinje cells stained with an anti-CAR8 antibody demonstrating the cellular density and structural complexity of the cerebellum. In this 3D reconstruction, the red pseudo color indicates the structures that are closest to the surface whereas the blue reveals deeper structures. Extracellular recoding electrodes have to traverse these structures in order for a single-unit to be isolated, typically with the electrode tip near the soma. (B) Schematic of an electrode targeting the cerebellum for in vivo recordings in an alert adult mouse. The schematics on the right illustrate the basic architecture of the cerebellum with the electrode targeting either the Purkinje cells (left, pink) or the cerebellar nuclear neurons (right, black). The granule cells are gray.
Fig. 2
Fig. 2
(A) Schematic of a mouse skull with the major bones labeled. (B) The same schematic shown in (A), but with the brain drawn below the surface in order to illustrate the relative position of the cerebellum with respect to the overlying bones. Access to the cerebellum during in vivo electrophysiology experiments typically involves a craniotomy made in the interparietal bone. (C) The schematic of the mouse skull with bregma labeled (red asterisk).
Fig. 3
Fig. 3
(A) A bird’s-eye view of the U holder, screws, and head plate. (B) Schematic of the mouse skull illustrating the position of the head plate. The hole in the center of the head plate allows visibility of bregma (red asterisk) throughout the procedure.
Fig. 4
Fig. 4
(A) After the head plate and 1/16 screw (green arrow) are secured, a craniotomy is initiated over the cerebellum (blue arrow). (B) The post is then positioned at bregma, the craniotomy completed, and a chamber adhered into place (blue arrowhead). (C) Schematic illustrating the positioning of the three major pieces of equipment that need to be secured: the head plate, the screw, and the recording chamber. The scale bar in (B) = 5 mm.
Fig. 5
Fig. 5
(A) Image of a mouse head-fixed over a foam running wheel with an electrophysiology electrode targeted to the cerebellum. (B) Schematic illustrating the in vivo electrophysiology set up. The recording chamber is surgically adhered above the cerebellum allowing for the isolation of single units from Purkinje cells. (C) Single-unit activity was isolated from Purkinje cells less than one week (top raw trace) and more than one week (bottom raw trace) after the first recording. The asterisks mark Purkinje cell complex spikes. The x-axis scale bar = 50 ms, y-axis scale bar = 2 mV.
Fig. 6
Fig. 6
(A) In vivo activity of a cerebellar nuclear neuron shown at lower power. (B) Higher power view of the raw trace in (A) showing individual spikes. The schematic illustrates the position of the electrode within the cerebellar nuclei. X-axis scale bar in (A) = 200 ms and (B) = 20 ms, y-axis scale bars = 2.5 mV.
Fig. 7
Fig. 7
(A) All control mice exhibit baseline movement oscillations termed “physiological tremor”. The raw output waveform (middle left inset) has irregular peaks with low amplitude. Raw voltage trace (bottom inset) of a Purkinje cell shows the typical firing of simple spikes and complex spikes (asterisks) recorded in vivo. The higher power raw trace (middle right inset) shows the distinct features of the two types of Purkinje cell action potentials. (B) Harmaline induces a severe tremor that manifests as highly rhythmic oscillations. Despite the severe shaking, we could isolate and hold single-unit Purkinje cell activity successfully. Complex spike rate is significantly increased after injecting harmaline. Despite the shaking of the mice, the recordings were stable enough for distinguishing and analyzing individual complex spike and simple spike waveforms. For both panels, the x-axis scale bar in the lower power traces = 50 ms, y-axis scale bar = 2.5 mV, and in the higher power traces x-axis = 5 ms, y-axis = 5 mV.
Fig. 8
Fig. 8
(A) Schematic of the mouse skull and brain showing the approximate tissue-cutting planes (dotted lines) on each side of the cerebellar midline. (B) Schematic of a sagittal section cut through the cerebellum. The lobules are numbered with Roman numerals according to standard nomenclature (Larsell, 1952). (C) Tissue sections were stained with a series of markers to reveal the different cell types in the cerebellum and their architecture on the recorded and non-recorded sides of the cerebellum: CAR8 (Purkinje cells); parvalbumin (Purkinje cells, stellate cells, basket cells); GABARα6 (granule cells); neurogranin (Golgi cells), calretinin (unipolar brush cells in lobules IX and X). (D) The tissue was also stained for markers of afferents and projections: VGLUT2 (mossy fiber terminals in the granular layer and climbing fiber terminals in the molecular layer); CART (climbing fibers in lobule X); NFH (basket cell axons and Purkinje cells). (E) ApopTag staining revealed localized cell death only near the craniotomy (arrow). The ApopTag stained tissue was counterstained with hematoxylin (blue). In these regions (arrow), marker expression was weaker (e.g. parvalbumin). Abbreviations: ml; molecular layer, pcl; Purkinje cell layer; gl, granule cell layer. Scale bar = 50 μm in CAR8 panel (C), 200 μm in calretinin panel (C), 20 μm in NFH panel (D), and 100 μm in parvalbumin panel (E).
Fig. 9
Fig. 9
(A) Wholemount schematic illustrating the pattern of zebrinII. Refer to Larsell (1952) for lobule nomenclature. Refer to Apps and Hawkes (2009) for a full discussion of transverse zones (AZ, anterior zone; CZ central zone; PZ, posterior zone; NZ, nodular zone). (B, C) ZebrinII “stripe” expression is intact in the anterior and posterior zones on the recorded and non-recorded sides of the cerebellum. Background staining was detected in blood vessels (arrows). (D) Schematic illustrating the striped expression of HSP25 in the CZ and NZ. (E) Hsp25 reveals distinct stripes in lobules VI/VII and IX/X after recording. (F) The complementary patterns of HSP25 and NFH remain clear after recording. Scale bar = 250 in (B), 500 in (C), 100 in (F).

References

    1. Ahn AH, Dziennis S, Hawkes R, Herrup K. The cloning of zebrin II reveals its identity with aldolase C. Development. 1994;120:2081–2090. - PubMed
    1. Apps R, Hawkes R. Cerebellar cortical organization: a one-map hypothesis. Nature reviews Neuroscience. 2009;10:670–681. - PubMed
    1. Arancillo M, White JJ, Lin T, Stay TL, Sillitoe RV. In vivo analysis of Purkinje cell firing properties during postnatal mouse development. J Neurophysiol. 2015;113:578–591. - PMC - PubMed
    1. Badura A, Sun XR, Giovannucci A, Lynch LA, Wang SS. Fast calcium sensor proteins for monitoring neural activity. Neurophotonics. 2014;1:025008. - PMC - PubMed
    1. Bazzigaluppi P, De Gruijl JR, van der Giessen RS, Khosrovani S, De Zeeuw CI, de Jeu MT. Olivary subthreshold oscillations and burst activity revisited. Frontiers in neural circuits. 2012;6:91. - PMC - PubMed

Publication types

MeSH terms

LinkOut - more resources