. 2016 Jan 18:7:10316.
doi: 10.1038/ncomms10316.

A better-ventilated ocean triggered by Late Cretaceous changes in continental configuration

Affiliations

A better-ventilated ocean triggered by Late Cretaceous changes in continental configuration

Yannick Donnadieu et al. Nat Commun. .

Abstract

Oceanic anoxic events (OAEs) are large-scale events of oxygen depletion in the deep ocean that happened during pre-Cenozoic periods of extreme warmth. Here, to assess the role of major continental configuration changes occurring during the Late Cretaceous on oceanic circulation modes, which in turn influence the oxygenation level of the deep ocean, we use a coupled ocean atmosphere climate model. We simulate ocean dynamics during two different time slices and compare these with existing neodymium isotope data (ɛNd). Although deep-water production in the North Pacific is continuous, the simulations at 94 and 71 Ma show a shift in southern deep-water production sites from South Pacific to South Atlantic and Indian Ocean locations. Our modelling results support the hypothesis that an intensification of southern Atlantic deep-water production and a reversal of deep-water fluxes through the Caribbean Seaway were the main causes of the decrease in ɛNd values recorded in the Atlantic and Indian deep waters during the Late Cretaceous.


Figures

Figure 1
Figure 1. Annual distribution of convective adjustments across the water column.
(a) For 94 Ma, 4 × CO2 from the North Pole. (b) For 71 Ma, 4 × CO2 from the North Pole. (c) For 94 Ma, 4 × CO2 from the South Pole. (d) For 71 Ma, 4 × CO2 from the South Pole. The shading signifies the number of times the water column has undergone convective mixing summed over a year. Regions experiencing a large occurrence of convective adjustments are interpreted to represent site of intermediate and deep-water formation.
Figure 2
Figure 2. Land–sea distribution and bathymetry specified in the FOAM simulations.
(a) Cenomanian/Turonian boundary (94 Ma). (b) Early Maastrichtian (71 Ma). Latitudinal and meridional sections across which water transport has been calculated for Fig. 3 are shown. C, Caribbean Seaway; CA, Central Atlantic; D, Drake Passage; EI, East India; Med, Mediterranean; SA, South Atlantic; Tet, Tethys; WI, West India. Supplementary Figs 3 and 4 show the latitude/longitude—depth profile for each section except for the c and d sections for which the bathymetry of the area of interest is shown. The red arrows schematically show the deep-water pathways deduced from our modelling experiments. ɛNd(t) values of intermediate and deep waters (in white) inferred from fish remains and oxide coatings and averaged for the Turonian (a) and Maastrichtian (b) are reported at available ODP sites (see Supplementary Fig. 5 for the names of each ODP site). Details on the calculation of average ɛNd(t) values can be found in Supplementary Data 2. For ODP sites at Demerara Rise (Central Atlantic), ɛNd(t) values within OAE2 have not been included in the calculation. Values in parentheses indicate a contamination of the samples or a contamination of deep waters by volcanogenic particles. Values in orange on the Maastrichtian map (b) are from the late Campanian. ɛNd values of the modern detrital fraction (core-top detrital fraction and continental lithogenic sources) in the regions of modelled deep-water production are reported in grey for discussion (details on the specified range of values are available in Supplementary Data 1 and 2, and Supplementary Figs 5 and 6 with associated references).
Figure 3
Figure 3. Water transports.
As computed for the segments defined in Fig. 2 for the North Atlantic and the Tethys basins (a,b) and for the SA and Indian basins (c,d). The units are in Sv, that is, 106 m3 s−1. Sv is used to quantify the volumetric rate of transport of ocean currents. Values corresponding to the water flow for each vertical level of the ocean model are plotted. The variable corresponds to the integration of the velocity V (U) on the x axis (or y axis depending on the orientation of the section) and on the z axis. Calculated water fluxes account for both the velocity and the area of the section at a given level of the model. For zonal water transports such as the one calculated for the Med segment, positive values indicate eastward transport. For meridional water transports such as those calculated for the Tethyan (Tet), Central Atlantic (CA), South Atlantic (SA), East Indian (EI) and West Indian (WI) segments, positive values indicate northward transport; negative values indicate southward transport. For the specific case of the D section, positive directions are Southward and Eastward, and for the c section, positive directions are Northward and Eastward. Blue arrows in c,d represent water fluxes computed across the SA section for the deeper vertical levels where the transport is northward.
Figure 4
Figure 4. Hydrological budget over the Central and South Atlantic.
Precipitation minus evaporation for 94 (a) and 71 Ma (b) runs.
Figure 5
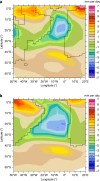
Figure 5. Absolute salinity fields.
Salinity and current velocity (m s−1) averaged over the first 300 m of the ocean for 94 (a) and 71 Ma (b) runs.
Figure 6
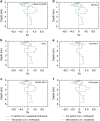
Figure 6. Water transports for the North Atlantic and the Tethys basins at 94 Ma.
(a) Drake Passage closed (DRAKE CLOSED), (b) Drake Passage at 145 m (CTRL), (c) Drake Passage at 408 m (DRAKE408m), (d) Drake Passage as in Sewall et al. (SEWALL), (e) Caribbean gateway at 560 m (CAS560m) and (f) continental plate across the Caribbean gateway (CAS-Islands).
Figure 7
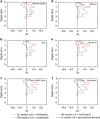
Figure 7. Water transport for the SA and Indian basins at 94 Ma.
(a) Drake Passage closed (DRAKE CLOSED), (b) Drake Passage at 145 m (CTRL), (c) Drake Passage at 408 m (DRAKE408m), (d) Drake Passage as in Sewall et al. (SEWALL), (e) Caribbean gateway at 560 m (CAS560m) and (f) Continental plate across the Caribbean gateway (CAS-Islands).
Figure 8
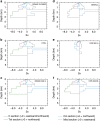
Figure 8. Water transport for the North Atlantic and the Tethys basins at 71 Ma.
(a) Drake Passage closed (DRAKE CLOSED), (b) Drake Passage at 145 m (CTRL), (c) Drake Passage at 408 m (DRAKE408m), (d) Drake Passage as in Sewall et al. (SEWALL), (e) Caribbean gateway at 560 m (CAS560m) and (f) continental plate across the Caribbean gateway (CAS-Islands).
Figure 9
Figure 9. Water transport for the SA and Indian basins at 71 Ma.
(a) Drake Passage closed (DRAKE CLOSED), (b) Drake Passage at 145 m (CTRL), (c) Drake Passage at 408 m (DRAKE408m), (d) Drake Passage as in Sewall et al. (SEWALL), (e) Caribbean gateway at 560 m (CAS560m) and (f) continental plate across the Caribbean gateway (CAS-Islands).

References

    1. Keeling R. E., Körtzinger A. & Gruber N. Ocean deoxygenation in a warming world. Annu. Rev. Marine Sci. 2, 199–229 (2010). - PubMed
    1. Jenkyns H. C. Geochemistry of oceanic anoxic events. Geochem. Geophys. Geosyst. 11, doi:10.1029/2009GC002788 (2010).
    1. Meyer K. M. & Kump L. R. Oceanic euxinia in earth history: causes and consequences. Annu. Rev. Earth Planet Sci. 36, 251–288 (2008).
    1. Monteiro F. M., Pancost R. D., Ridgwell A. & Donnadieu Y. Nutrients as the dominant control on the spread of anoxia and euxinia across the Cenomanian-Turonian oceanic anoxic event (OAE2): model-data comparison. Paleoceanography 27, doi:10.1029/2012PA002351 (2012).
    1. Föllmi K. B. Early Cretaceous life, climate and anoxia. Cretaceous Res. 35, 230–257 (2012).

Publication types

LinkOut - more resources