. 2016 Mar 7;16(5):829-46.
doi: 10.1039/c5lc01396h.

Microfabricated reciprocating micropump for intracochlear drug delivery with integrated drug/fluid storage and electronically controlled dosing

Affiliations

Microfabricated reciprocating micropump for intracochlear drug delivery with integrated drug/fluid storage and electronically controlled dosing

Vishal Tandon et al. Lab Chip. .

Abstract

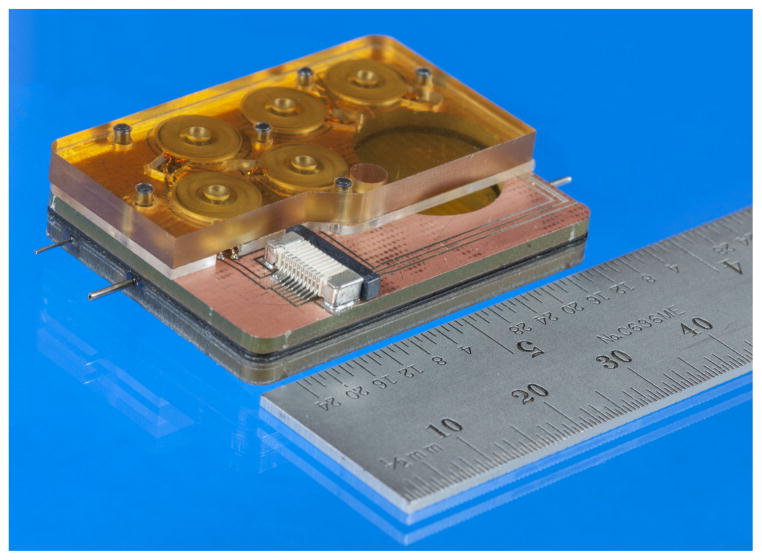
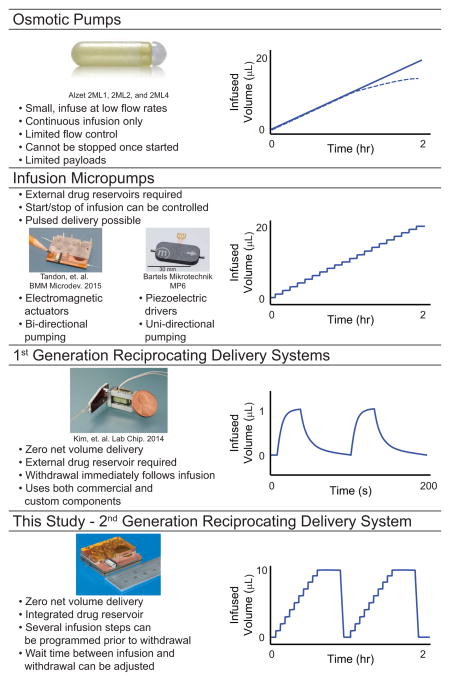
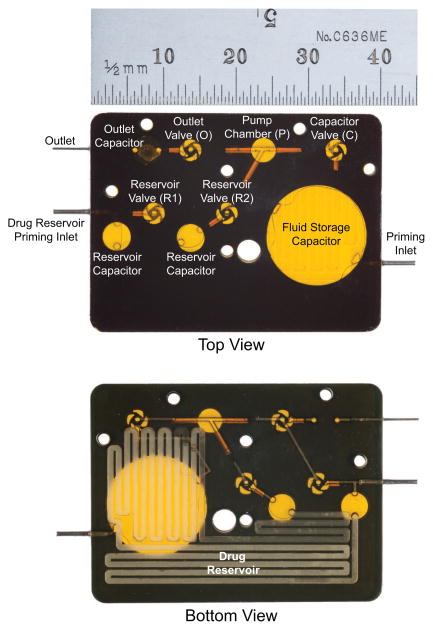
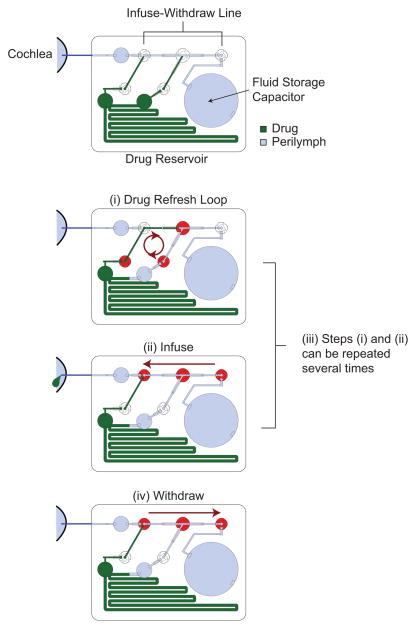
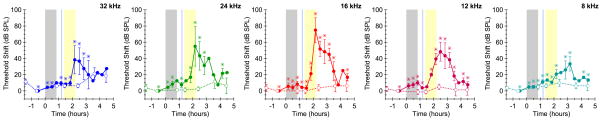
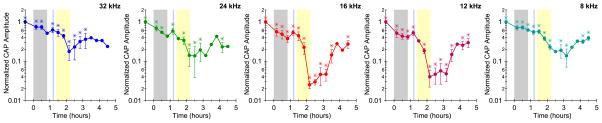
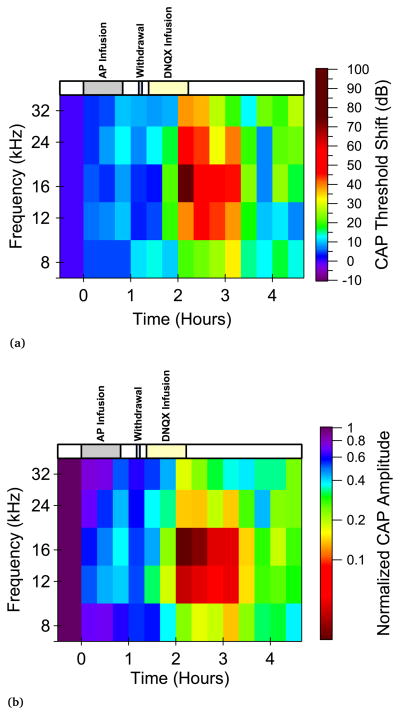
The anatomical and pharmacological inaccessibility of the inner ear is a major challenge in drug-based treatment of auditory disorders. This also makes pharmacokinetic characterization of new drugs with systemic delivery challenging, because efficacy is coupled with how efficiently a drug can reach its target. Direct delivery of drugs to cochlear fluids bypasses pharmacokinetic barriers and helps to minimize systemic toxicity, but anatomical barriers make administration of multiple doses difficult without an automated delivery system. Such a system may be required for hair-cell regeneration treatments, which will likely require timed delivery of several drugs. To address these challenges, we have developed a micropump for controlled, automated inner-ear drug delivery with the ultimate goal of producing a long-term implantable/wearable delivery system. The current pump is designed to be used with a head mount for guinea pigs in preclinical drug characterization experiments. In this system, we have addressed several microfluidic challenges, including maintaining controlled delivery at safe, low flow rates and delivering drug without increasing the volume of fluid in the cochlea. By integrating a drug reservoir and all fluidic components into the microfluidic structure of the pump, we have made the drug delivery system robust compared to previous systems that utilized separate, tubing-connected components. In this study, we characterized the pump's unique infuse-withdraw and on-demand dosing capabilities on the bench and in guinea pig animal models. For the animal experiments, we used DNQX, a glutamate receptor antagonist, as a physiological indicator of drug delivery. DNQX suppresses compound action potentials (CAPs), so we were able to infer the distribution and spreading of the DNQX over time by measuring the changes in CAPs in response to stimuli at several characteristic frequencies.


Figures

Fig. 1
Fig. 1
Photograph of our reciprocating micropump comprising microfluidics, a printed circuit board (PCB), and 5 electromagnetic acutators with associated fixtures.
Fig. 2
Fig. 2
Comparison of pump types including different generations of our inner-ear drug delivery systems. Representations of typical infusion profiles are shown on the right. For the osmotic pump, the dashed line indicates the possible decay in flow rate over time. For the first generation reciprocating delivery system, the time scale shown is much shorter (on the order of minutes as opposed to hours) because withdrawal of fluid in that system must immediately follow infusion, so the relevant time scale is that of individual pump strokes.
Fig. 3
Fig. 3
Top and bottom back lit photographs of the microfluidics portion of our micropump. Several polymer layers were laminated together to form the 3-D microfluidic structures. The actuator locations are identified by O, P, C, R1, and R2.
Fig. 4
Fig. 4
Scheme showing the process flow for one drug delivery cycle, including drug refresh, infuse, and withdraw steps. All of the valves are normally closed, and open when power is supplied. Actuators/valves that are active and supplied power at some point during a particular step are highlighted in red. A simplified version of the drug reservoir is shown for clarity.
Fig. 5
Fig. 5
Scheme showing an exploded view of the layers and structures that comprise our micropump. The layers numbered (1–6) were laminated together to form the microfluidics portion of the pump shown in Figure 3. The microfluidics and remaining layers were fastened together with bolts (Figure 1). Detailed descriptions of the materials are shown in Table 1.
Fig. 6
Fig. 6
Chart describing the flow of drug delivery experiments in guinea pigs. The approximate timing of each experimental phase is listed. In a real experiment, there were additional delays for set up time.
Fig. 7
Fig. 7
Volume delivered (or withdrawn) per stroke of the micropump as a function of hydrodynamic resistance added to the outlet. A 9-cm length of 100-μm ID PEEK, as was used in our fluorescence and animal experiments, corresponds to a resistance of 0.61 kPa/(μL/min). Exponential fits are shown to help guide the eye. Hydrodynamic resistances shown here and throughout this work were calculated using the standard relation derived from Hagen-Poiseuille flow.
Fig. 8
Fig. 8
Flow rate generated by the pump as a function of time after (a) a single infuse pump stroke and (b) a single withdraw stroke. A 9-cm length of 100-μm ID PEEK was attached to the outlet. The volume of the infuse stroke was 0.47 μL, and the volume of the withdraw stroke was 0.22 μL.
Fig. 9
Fig. 9
Infuse stroke volume is consistent over more than 1600 strokes after some initial scatter (likely due to air settling in the system). For these data, the pump was set to repeatedly generate infuse strokes. A 9-cm length of 100-μm ID PEEK and the flow sensor were attached to the outlet. Stroke volumes were calculated by integrating the flow sensor data. The average stroke volume was 0.42 ± 0.02 μL.
Fig. 10
Fig. 10
Volume delivered (or withdrawn) per pump stroke as a function of intake time (the amount of time the intake valve and pump actuators are held in the powered state). In (a), no resistive tubing was added to the outlet, so the outlet resistance was low—approximately 5.4 Pa/(μL/min)—while in (b), 9 cm of 100-μm ID PEEK tubing were attached to the outlet, bringing the total outlet resistance to 0.62 kPa/(μL/min). For all of these data, the expulsion valve hold time was set to 200 ms, and the inlet resistance was 0.9 Pa/(μL/min).
Fig. 11
Fig. 11
Bench-top measurement of the fluid volume output of the pump as a function of time for the same reciprocation profile used in our animal experiments. We could not use a flow sensor to measure volume output during animal experiments, because attaching a flow sensor inline at the pump outlet adds unacceptable dead volume. For this profile, two infuse strokes were pumped every 5 min., 10 times (20 total infuse pump strokes with a total volume of 9.4 μL). After a 20 min wait, 45 withdraw strokes were pumped bringing the total infusion volume back to nearly zero.
Fig. 12
Fig. 12
Drug dosing is electronically initiated on demand. The effective concentration of drug delivered can be lowered by reducing the number of refresh strokes relative to the number of infuse strokes. (a) Scheme showing the process flow for fluorescence experiments that demonstrate 3 different dosing schemes. The drug reservoir in the pump was primed with fluorescein solution, while the rest of the pump was primed with deionized water. A higher ratio of infuse to refresh strokes leads to increased dilution of the dose. Note that some dilution occurs in all dosing schemes due to the dead volume (~ 4 μL) that must be cleared at the start of the dose. The entire process was repeated 10 times in subsequent wells on the microplate to generate the data shown in (b), resulting in a total of 60 aliquots collected sequentially in individual wells. (b) 10-μL aliquots (20 infuse strokes each) dispensed by the pump were collected in successive wells in a 96-well plate. For the first aliquot and every 6th aliquot thereafter (i.e. first, seventh, thirteenth, etc.), drug refresh strokes were actuated prior to the infuse strokes according to one of the schemes shown in (a). The fluorescence data was normalized to the initial fluorescein concentration (0.1 mg/ml).
Fig. 13
Fig. 13
CAP (solid lines, closed circles) and DPOAE (dashed lines, open circles) threshold shifts as a function of time during infusion of AP into, withdrawal of fluid from, and infusion of DNQX into a guinea pig cochlea. AP infusion began at t = 0, and shifts were calculated with respect to measurements taken just before t = 0. The gray shaded areas (t = 0 to t = 0.83 hours) represent the times during which artificial perilymph was infused. The blue shaded areas (t = 1.17 to t = 1.24 hours) represent the times during which fluid was withdrawn from the cochlea. The yellow shaded areas (t = 1.38 hours to t = 2.22 hours) represent the times during which a drug-refresh pump stroke was run prior to each infuse pump stroke, resulting in DNQX infusion into the cochlea. For non-shaded areas, the pump was idle. The asterisks for the CAP thresholds indicate data points that are the mean of either 3 or 4 biological replicates, and the error bars on those points represent the standard error of the mean. All other CAP threshold data points had fewer than 3 replicates. All DPOAE thresholds shown are the mean of 4 biological replicates, with error bars that represent standard error. In cases where there was no CAP response, CAP threshold shifts were set to 120 dB.
Fig. 14
Fig. 14
CAP amplitude as a function of time in response to 60-dB tone-pip stimuli during infusion of AP into, withdrawal of fluid from, and infusion of DNQX into a guinea pig cochlea. See Figure 13 for notation.
Fig. 15
Fig. 15
Image plots of (a) CAP threshold shift and (b) normalized CAP amplitude as functions of time and frequency. Warmer colors represent greater hearing loss (larger threshold shifts, smaller CAP amplitudes). AP infusion began at t = 0, and regions of AP infusion, withdrawal, and DNQX infusion are indicated. For (b), the color bar is on a log scale, and the CAPs were generated in response to 60-dB tone-pip stimuli. Each pixel represents the mean of up to 4 biological replicates.

Similar articles

Cited by

References

    1. Juhn SK, Rybak LP. Acta Otolaryngol. 2008;91:529–534. - PubMed
    1. Juhn SK, Hunter BA, Odland RM. Int Tinnitus J. 2001;7:72–83. - PubMed
    1. Haynes DS, O’Malley M, Cohen S, Watford K, Labadie RF. Laryngoscope. 2007;117:3–15. - PubMed
    1. Mizutari K, Fujioka M, Hosoya M, Bramhall N, Okano HJ, Okano H, Edge ASB. Neuron. 2013;77:58–69. - PMC - PubMed
    1. Kang WS, Sun S, Nguyen K, Kashemirov B, Mckenna CE, Hacking SA, Quesnel AM, Sewell WF, Mckenna MJ, Jung DH. Otol Neurotol. 2015;36:953–960. - PMC - PubMed

Publication types