. 2016 Apr:68:86-97.
doi: 10.1016/j.jaut.2015.12.004. Epub 2016 Jan 6.

Sonic Hedgehog regulates thymic epithelial cell differentiation

Affiliations

Sonic Hedgehog regulates thymic epithelial cell differentiation

José Ignacio Saldaña et al. J Autoimmun. 2016 Apr.

Abstract

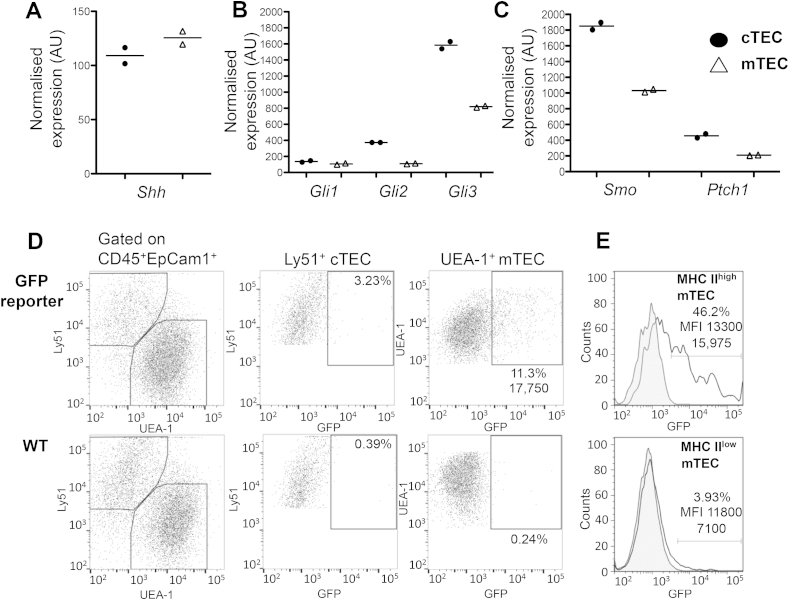
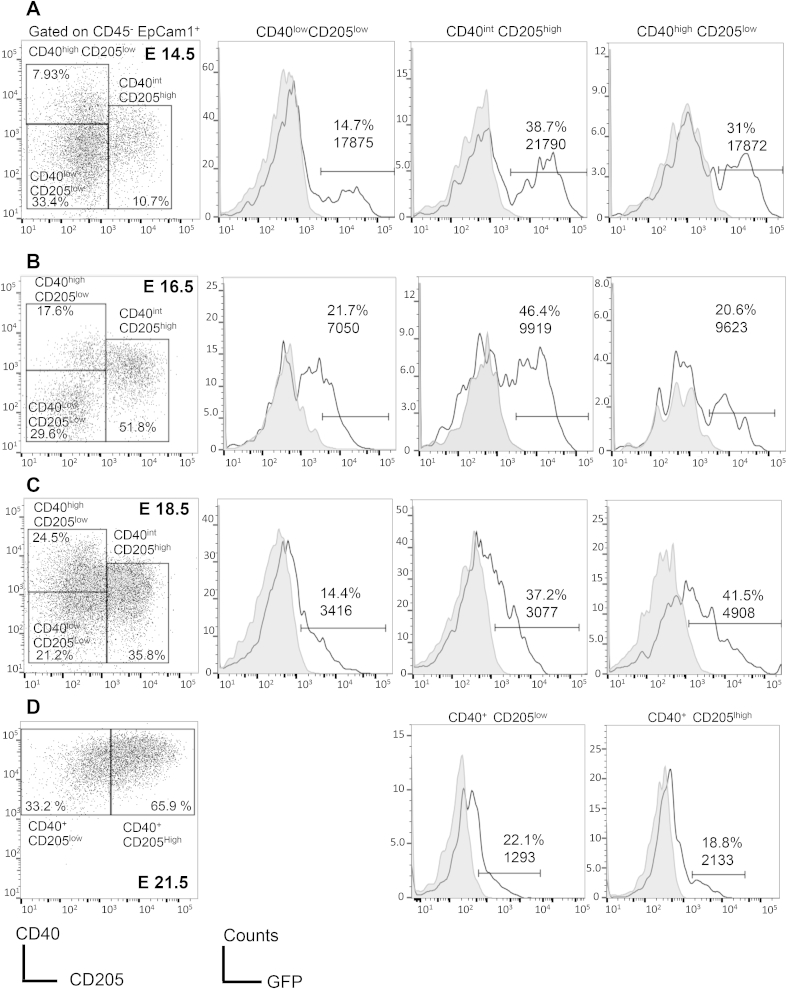
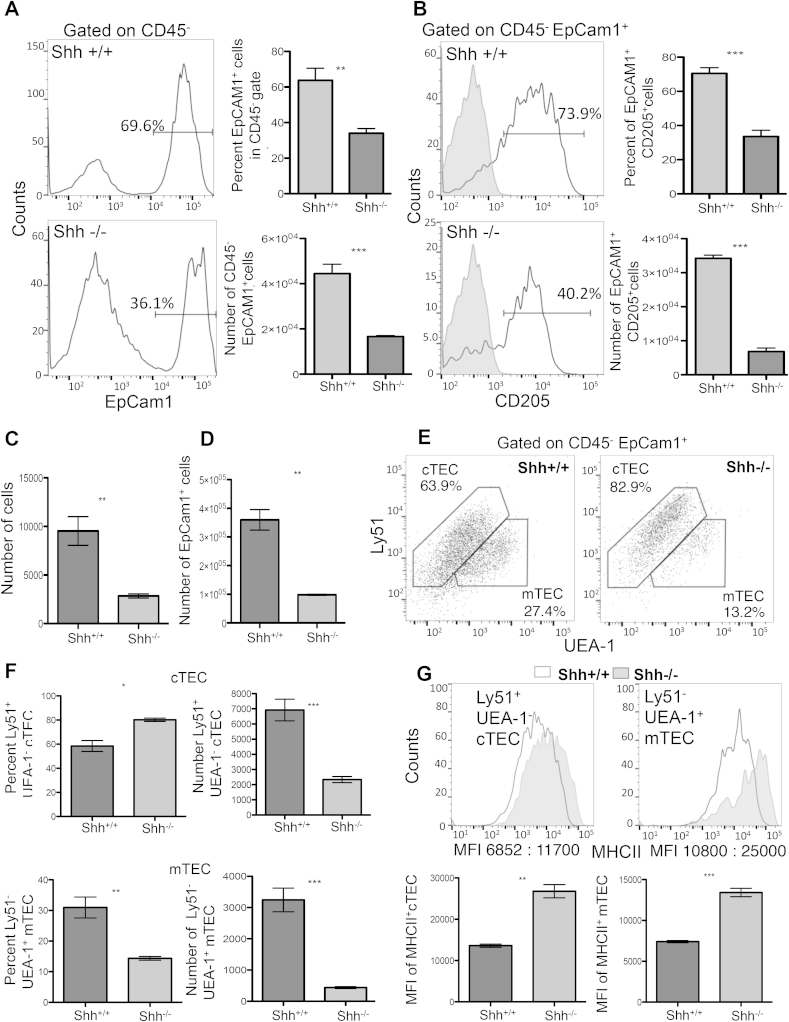
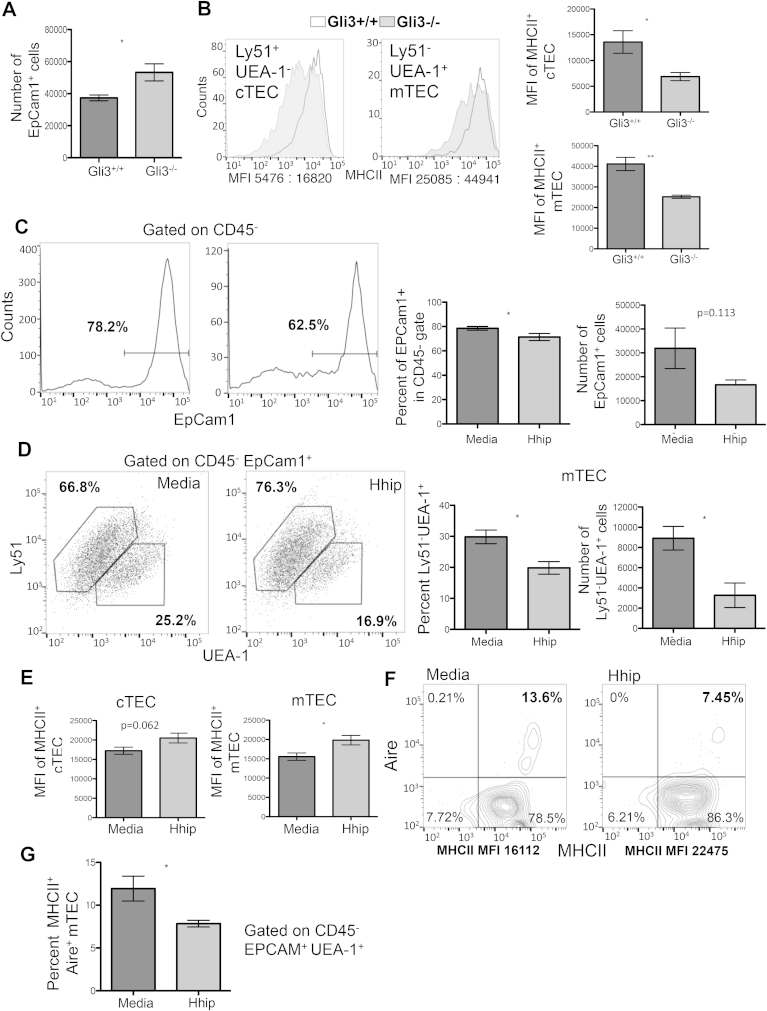
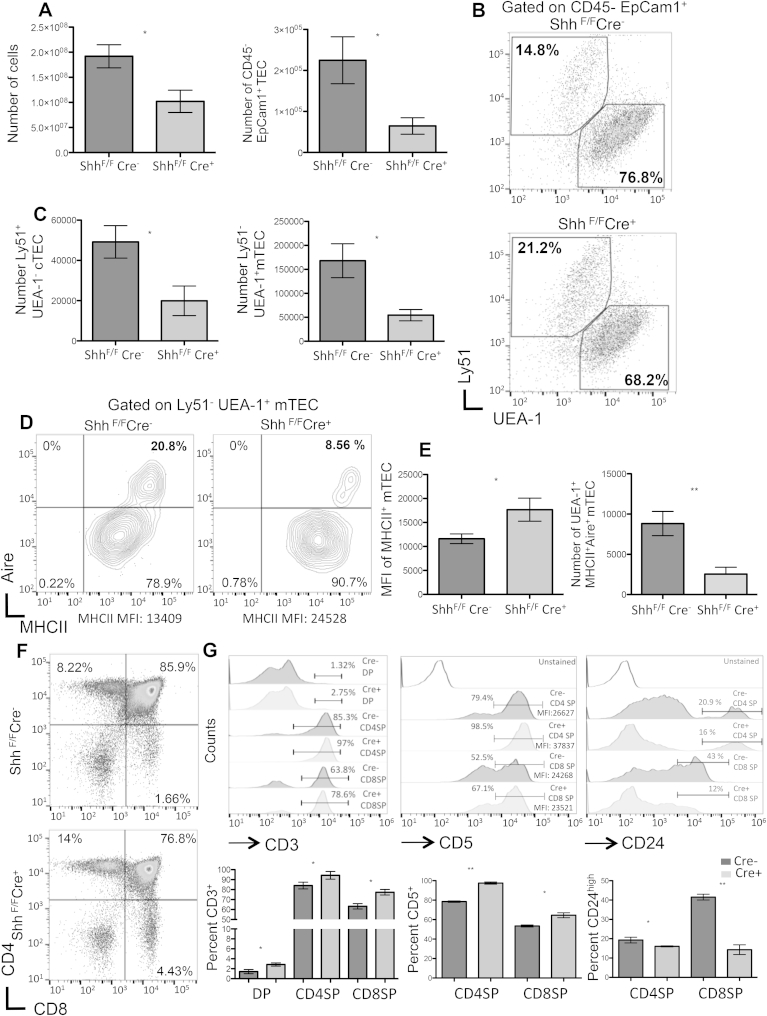
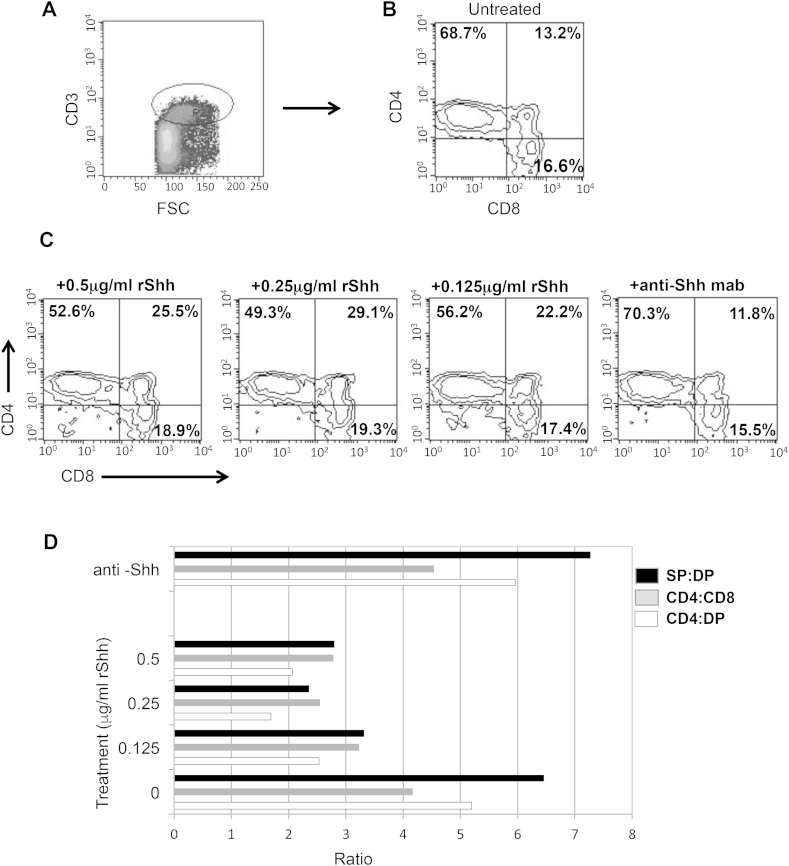
Sonic Hedgehog (Shh) is expressed in the thymus, where it regulates T cell development. Here we investigated the influence of Shh on thymic epithelial cell (TEC) development. Components of the Hedgehog (Hh) signalling pathway were expressed by TEC, and use of a Gli Binding Site-green fluorescence protein (GFP) transgenic reporter mouse demonstrated active Hh-dependent transcription in TEC in the foetal and adult thymus. Analysis of Shh-deficient foetal thymus organ cultures (FTOC) showed that Shh is required for normal TEC differentiation. Shh-deficient foetal thymus contained fewer TEC than wild type (WT), the proportion of medullary TEC was reduced relative to cortical TEC, and cell surface expression of MHC Class II molecules was increased on both cortical and medullary TEC populations. In contrast, the Gli3-deficient thymus, which shows increased Hh-dependent transcription in thymic stroma, had increased numbers of TEC, but decreased cell surface expression of MHC Class II molecules on both cortical and medullary TEC. Neutralisation of endogenous Hh proteins in WT FTOC led to a reduction in TEC numbers, and in the proportion of mature Aire-expressing medullary TEC, but an increase in cell surface expression of MHC Class II molecules on medullary TEC. Likewise, conditional deletion of Shh from TEC in the adult thymus resulted in alterations in TEC differentiation and consequent changes in T cell development. TEC numbers, and the proportion of mature Aire-expressing medullary TEC were reduced, and cell surface expression of MHC Class II molecules on medullary TEC was increased. Differentiation of mature CD4 and CD8 single positive thymocytes was increased, demonstrating the regulatory role of Shh production by TEC on T cell development. Treatment of human thymus explants with recombinant Shh or neutralising anti-Shh antibody indicated that the Hedgehog pathway is also involved in regulation of differentiation from DP to mature SP T cells in the human thymus.

Keywords: MHCII; Morphogen; Sonic hedgehog; T cell; Thymic epithelium; cTEC; mTEC.


Figures

Fig. 1
Fig. 1
Hedgehog signalling is active in thymic epithelial cells from adult mice. (A–C) Gene expression by microarray of components of the Hh signalling pathway from sorted cTEC and mTEC extracted from 4 week-old mice. (D) Hh signalling in TEC measured by Gli-mediated GFP expression using a reporter transgenic (GBS-GFP-transgenic). (E) GFP expression in mature MHCIIhigh and immature MHCIIlow mTEC. Numbers within plots indicate percentage of GFP positive cells and mean fluorescence intensity (MFI). (D-E). Data representative of three independent experiments.
Fig. 2
Fig. 2
Hedgehog signalling during foetal TEC ontogeny. Gli-mediated GFP expression was measured by flow cytometry on the indicated days of embryonic (E) development in GBS-GFP-transgenic thymi. Developing TEC were identified as CD45EpCAM+, and stained with anti-CD40 and anti-CD205 to identify three immature TEC populations on E14.5, E16.5 E18.5, and cTEC and mTEC on E21.5 (neonate) (A–D): CD40lowCD205low (containing TEC progenitors), CD40intCD205high (immature cTEC) and CD40high CD205low (mTEC lineage); and in neonatal thymus, showing GFP in mTEC and cTEC populations. Open histograms show GFP-fluorescence in a GBS-GFP transgenic thymus and filled histograms WT (background fluorescence). Data representative of three independent experiments.
Fig. 3
Fig. 3
Reduced TEC differentiation in the E15.5 Shh−/− thymus and Shh−/− FTOC compared to WT. (A–B) TEC populations in E15.5 thymus. (A) Histograms show anti-EpCam1 staining on CD45-cells in Shh+/+ and Shh−/− thymus, giving the percentage of cells that stain positive with anti-EpCam1. Bar charts show mean percentage of CD45-cells that stain positive with anti-EpCam1 (upper chart), and number of CD45EpCam1+ cells (lower chart). (B) Histograms show CD205 expression on CD45EpCam1+ cells, and shaded histograms correspond to isotype controls. Bar charts show the mean percentage of EpCam1+CD45 cells that stain positive with CD205 (upper chart) and the number of CD45EpCam1+CD205+ cells (lower chart). N = 4 for both genotypes. Data represent mean ± SD **p < 0.001 ***p < 0.0001. (C–G) TEC populations in Shh−/− and WT FTOC. Shh−/− and WT litter mate FTOC were cultured for 7 days and TEC populations were analysed by flow cytometry. (C) Number of cells recovered from Shh−/− and WT FTOC. (D) Number of epithelial cells (CD45EpCam1+) isolated from Shh−/−, and WT FTOC. (E) Anti-Ly51 (cTEC) and UEA-1 (mTEC) staining on CD45EpCam1+ cells isolated from Shh−/− and WT FTOC, showing the percentage of cells within the region. (F) Bar charts show mean percentage of epithelial cells that are cTEC (Ly51+) and mTEC (UEA-1 staining), and the mean number of cTEC and of mTEC isolated from Shh−/− and WT FTOC. (G) Histograms show cell surface MHCII staining on cTEC and mTEC isolated from Shh−/− (shaded histogram) and WT (open histogram) FTOC. Bar charts show mean of MFI for cell surface MHCII staining on cTEC and mTEC isolated from Shh−/− and WT FTOC.
Fig. 4
Fig. 4
TEC differentiation in Gli3−/− FTOC compared to WT, and in rHhip-treated WT FTOC compared to untreated. (AB) Gli3−/− and WT litter mate FTOC were cultured for 7 days and TEC populations were analysed by flow cytometry. (A) Bar chart shows mean number of epithelial cells recovered from Gli3−/− and WT littermate FTOC. (B) Histograms show cell surface MHCII staining on cTEC and mTEC isolated from Gli3−/− and WT FTOC. Shaded histograms are Gli3−/− and open are WT. Bar charts show mean of MFI for cell surface MHCII staining on cTEC and mTEC isolated from Gli3−/− and WT FTOC. Data represent mean ± SD. N = 5 for Shh−/− and their WT littermate and N = 3 for Gli3 and their WT littermates **p < 0.001 ***p < 0.0001. (C–G) rHhip treatment modulates TEC differentiation in WT FTOC. TEC development was analysed by flow cytometry in WT FTOC treated with rHhip for 7 days, compared to control untreated FTOC. (C) Histograms show anti-EpCam1 staining on CD45 cells, giving the percentage of positive cells. Bar charts show mean percentage and number of EpCam1+ cells. (D) Dot plots show anti-Ly51 (cTEC) and UEA-1 (mTEC) staining on CD45EpCam1+ cells isolated from control and rHhip-treated FTOC. Bar charts show mean percentage and number of Ly51UEA-1+ (mTEC). (E) Bar charts show mean MFI of cell surface anti-MHCII staining on cTEC (left chart) and mTEC (right chart) from treated and control FTOC. (F) Contour plots show cell surface anti-MHCII staining and intracellular anti-Aire staining, gated on CD45EpCam1+UEA-1+ mTEC, from control and rHhip-treated FTOC, showing the percentage of cells that stained positive for both markers. The MFI of MHCII staining is also given. (G) Bar chart shows percentage of mTEC (CD45EpCam1+UEA-1+) that are positive with intracellular anti-Aire staining and anti MHCII staining. For (C), (D) and (E) data were obtained from n = 7 FTOC and for (F and G) from n = 3. Data represent mean ± SD, *p < 0.05.
Fig. 5
Fig. 5
Conditional deletion of Shh from TEC reduces TEC differentiation in the adult thymus. Conditional knockout mice of Shh in TEC (ShhcoKO) were generated by crossing Shhfloxed mice with FoxN1-Cre transgenics to conditionally delete Shh from TEC. Thymus from Cre+ (ShhcoKO) was compared to thymus from Cre- (WT) littermates. (A) Bar charts show overall number of cells (left) and number of TEC (CD45EpCam1+ cells) (right) in the Cre- (control) and Cre+ (ShhcoKO) thymus. (B) Dot plots show UEA-1 staining (mTEC) and staining against Ly51 (cTEC), gated on CD45EpCam1+ cells, from Cre+ and Cre-littermates. The percentage of cells within each region is given. (C) Bar charts show the mean number of cTEC and mTEC. (D) Contour plots show cell surface anti-MHCII staining and intracellular anti-Aire staining, gated on CD45EpCam1+UEA-1+ mTEC. The percentage of cells in each quadrant and the MFI for anti-MHCII staining are given. (E) The bar chart (left) shows the mean MFI of MHCII staining on mTEC and the bar chart (right) shows the mean number of mTEC (CD45EpCam1+Ly51-UEA-1+) that are positive with intracellular anti-Aire staining. N = 4 mice per genotype. (F) Dot plots show anti-CD4 and anti-CD8 staining on thymus from ShhcoKO and WT mice. Representative percentages of thymocytes from three independent experiments are given. Mean DP:CD4 SP ratio WT = 12.73 ± 1.255, ShhcoKO = 7.833 ± 1.167 (p = 0.0459) and mean DP:CD8 SP ratio WT = 42.30 ± 4.723, ShhcoKO = 25.77 ± 3.453 (p = 0.0475). (G). Offset histograms represent CD3 (top left), CD5 (top centre), MFI of CD5high SP cells are indicated, and CD24high (top right) expression on thymocytes from ShhcoKO and WT mice. Bar charts show mean percentage of cells that stain positive with anti-CD3, anti-CD5 and anti-CD24 in the thymocyte subsets. Data represent mean ± SD, *p < 0.05 **p < 0.001 ***p < 0.0001.
Fig. 6
Fig. 6
Shh modulates differentiation from DP to SP thymocyte in the human thymus. T cell development was analysed by flow cytometry in human thymus explants treated with rShh or neutralizing anti-Shh mab (5E1) for 5 days, compared to control untreated explants. (A) Density plot show Forward side scatter (FSC) against anti-CD3 staining, showing the gate on CD3high thymocytes. (B) Contour plot shows anti-CD4 and anti-CD8 staining on the CD3high gated population in control untreated thymus explants cultured for 5 days. (C) Contour plots show CD4 and CD8 expression in the CD3high gate in thymus explants treated for 5 days with 0.5, 0.25 and 0.125 μg/ml rShh, and 5 μg/ml 5E1 (anti-Shh neutralizing antibody). (D) The bar-chart shows the ratios of CD4:DP (open bar), CD4SP:CD8SP (grey bar), and SP:DP (black bar) within the CD3high population, under the different culture conditions. Data are representative of three independent experiments.

Similar articles

Cited by

References

    1. Alves N.L. Serial progression of cortical and medullary thymic epithelial microenvironments. Eur. J. Immunol. 2014;44(1):16–22. - PMC - PubMed
    1. Hollander G. Cellular and molecular events during early thymus development. Immunol. Rev. 2006;209:28–46. - PubMed
    1. Arstila T.P., Jarva H. Human APECED; a Sick Thymus Syndrome? Front. Immunol. 2013;4:313. - PMC - PubMed
    1. Ucar O., Rattay K. Promiscuous gene expression in the thymus: a matter of epigenetics, miRNA, and more? Front. Immunol. 2015;6:93. - PMC - PubMed
    1. Bredenkamp N. An organized and functional thymus generated from FOXN1-reprogrammed fibroblasts. Nat. Cell Biol. 2014;16(9):902–908. - PMC - PubMed

Publication types

Substances