

Targeted Lipidomic and Transcriptomic Analysis Identifies Dysregulated Renal Ceramide Metabolism in a Mouse Model of Diabetic Kidney Disease
- PMID: 26778897
- PMCID: PMC4712744
- DOI: 10.4172/jpb.S14-002
Targeted Lipidomic and Transcriptomic Analysis Identifies Dysregulated Renal Ceramide Metabolism in a Mouse Model of Diabetic Kidney Disease
Abstract
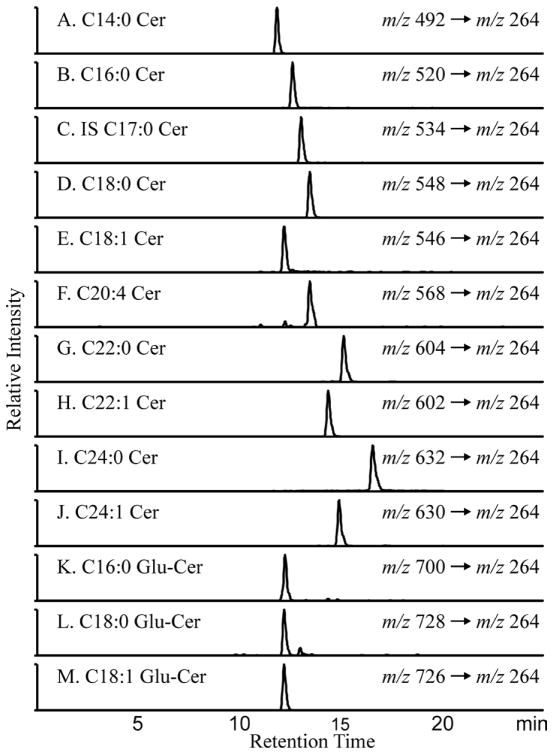
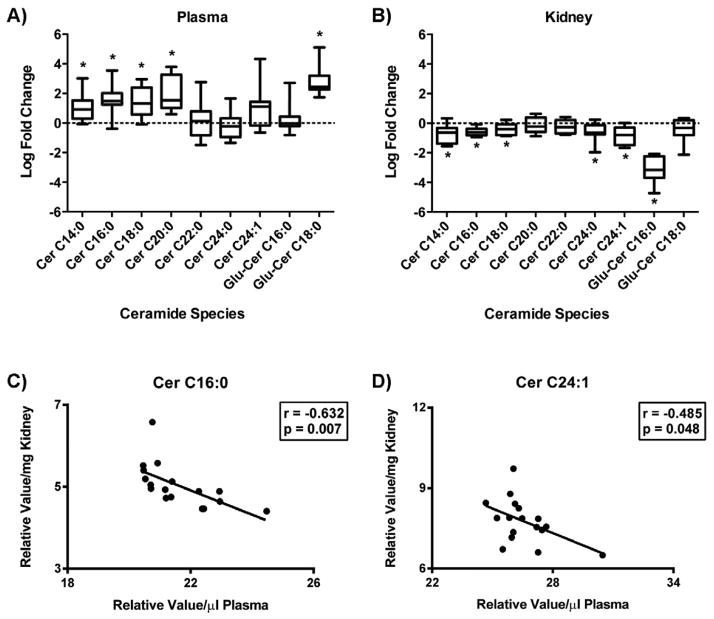
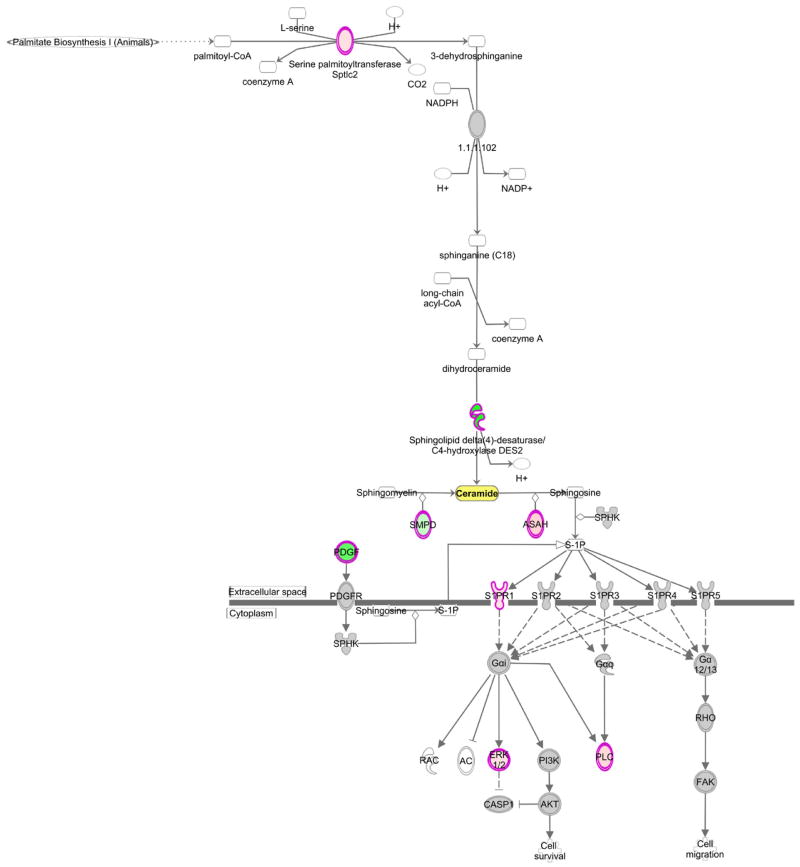
Both type 1 and type 2 diabetes are associated with altered lipid metabolism, which might in part contribute to debilitating complications such as diabetic kidney disease (DKD). Ceramides are bioactive sphingolipids that have been implicated in a variety of diseases as they can regulate cellular responses to stress and invoke a myriad of downstream signaling responses. To investigate a potential role of altered ceramide metabolism in DKD, we utilized a highly sensitive and specific mass spectrometry (MS) method to quantitatively measure species in plasma and kidney cortex from the C57BLKS db/db mouse model of DKD and littermate controls. Long-chain ceramides (C14:0, C16:0, C18:0, C20:0) and a glucosylceramide (Glu-Cer C18:0) were increased in diabetic mouse plasma, while long-chain (C14:0, C16:0, C18:0) and very-long-chain (C24:0, C24:1) ceramides and a glucosylceramide (Glu-Cer C16:0) were decreased in diabetic mouse kidney tissue. Kidney and plasma ceramide levels correlated to functional and histopathological features of DKD. Transcriptomic analysis of mouse kidney tissue revealed expression changes indicative of decreased ceramide synthesis (Degs2, Smpd2) and increased conversion to sphingosine (Acer2) and downstream sphingosine-1-phosphate signaling. Correlation analysis identified a negative relationship between plasma and kidney tissue levels of ceramide C16:0 and ceramide C24:1. Overall, the findings suggest a previously unrecognized role for ceramide metabolism in DKD.
Keywords: Ceramide; Diabetes; Diabetic kidney disease; Diabetic nephropathy; Glucosylceramide; Kidney; Lipidomics; Mass spectrometry.
Figures
Similar articles
-
Decreased Serum Levels of Sphingomyelins and Ceramides in Sickle Cell Disease Patients.Lipids. 2018 Mar;53(3):313-322. doi: 10.1002/lipd.12027. Epub 2018 Apr 16. Lipids. 2018. PMID: 29663386
-
Blood bioactive sphingolipids in patients with advanced serous epithelial ovarian cancer - mass spectrometry analysis.Arch Med Sci. 2018 Jul 10;17(1):53-61. doi: 10.5114/aoms.2018.76996. eCollection 2021. Arch Med Sci. 2018. PMID: 33488856 Free PMC article.
-
CERS6-derived ceramides aggravate kidney fibrosis by inhibiting PINK1-mediated mitophagy in diabetic kidney disease.Am J Physiol Cell Physiol. 2023 Aug 1;325(2):C538-C549. doi: 10.1152/ajpcell.00144.2023. Epub 2023 Jul 17. Am J Physiol Cell Physiol. 2023. PMID: 37458434 Free PMC article.
-
Rotten to the Cortex: Ceramide-Mediated Lipotoxicity in Diabetic Kidney Disease.Front Endocrinol (Lausanne). 2021 Jan 28;11:622692. doi: 10.3389/fendo.2020.622692. eCollection 2020. Front Endocrinol (Lausanne). 2021. PMID: 33584550 Free PMC article. Review.
-
Sphingomyelins and ceramides: possible biomarkers for dementia?Curr Opin Lipidol. 2022 Feb 1;33(1):57-67. doi: 10.1097/MOL.0000000000000804. Curr Opin Lipidol. 2022. PMID: 34879042 Review.
Cited by
-
Metabolic Signatures Elucidate the Effect of Body Mass Index on Type 2 Diabetes.Metabolites. 2023 Feb 3;13(2):227. doi: 10.3390/metabo13020227. Metabolites. 2023. PMID: 36837846 Free PMC article.
-
Role of Sphingolipid Signaling in Glomerular Diseases: Focus on DKD and FSGS.J Cell Signal. 2020 Sep;1(3):56-69. doi: 10.33696/Signaling.1.013. J Cell Signal. 2020. PMID: 32914148 Free PMC article.
-
A Rheostat of Ceramide and Sphingosine-1-Phosphate as a Determinant of Oxidative Stress-Mediated Kidney Injury.Int J Mol Sci. 2022 Apr 4;23(7):4010. doi: 10.3390/ijms23074010. Int J Mol Sci. 2022. PMID: 35409370 Free PMC article. Review.
-
Lipotoxic Proximal Tubular Injury: A Primary Event in Diabetic Kidney Disease.Front Med (Lausanne). 2021 Oct 25;8:751529. doi: 10.3389/fmed.2021.751529. eCollection 2021. Front Med (Lausanne). 2021. PMID: 34760900 Free PMC article. Review.
-
Drug-Based Lifespan Extension in Mice Strongly Affects Lipids Across Six Organs.Aging Cell. 2025 May;24(5):e14465. doi: 10.1111/acel.14465. Epub 2025 Mar 24. Aging Cell. 2025. PMID: 40129070 Free PMC article.
References
-
- Miller M, Stone NJ, Ballantyne C, Bittner V, Criqui MH, et al. Triglycerides and cardiovascular disease: a scientific statement from the American Heart Association. Circulation. 2011;123:2292–2333. - PubMed
-
- U.S. Renal Data System. USRDS 2013 Annual Data Report: Atlas of Chronic Kidney Disease and End-Stage Renal Disease in the United States. National Institutes of Health, National Institute of Diabetes and Digestive and Kidney Diseases; Bethesda, MD: 2013.
-
- Alzaid AA. Microalbuminuria in patients with NIDDM: an overview. Diabetes Care. 1996;19:79–89. - PubMed
-
- Mattock MB, Morrish NJ, Viberti G, Keen H, Fitzgerald AP, et al. Prospective study of microalbuminuria as predictor of mortality in NIDDM. Diabetes. 1992;41:736–741. - PubMed
Grants and funding
LinkOut - more resources
Full Text Sources
Miscellaneous