

Chronic Stress Decreases Cerebrovascular Responses During Rat Hindlimb Electrical Stimulation
- PMID: 26778944
- PMCID: PMC4688360
- DOI: 10.3389/fnins.2015.00462
Chronic Stress Decreases Cerebrovascular Responses During Rat Hindlimb Electrical Stimulation
Abstract
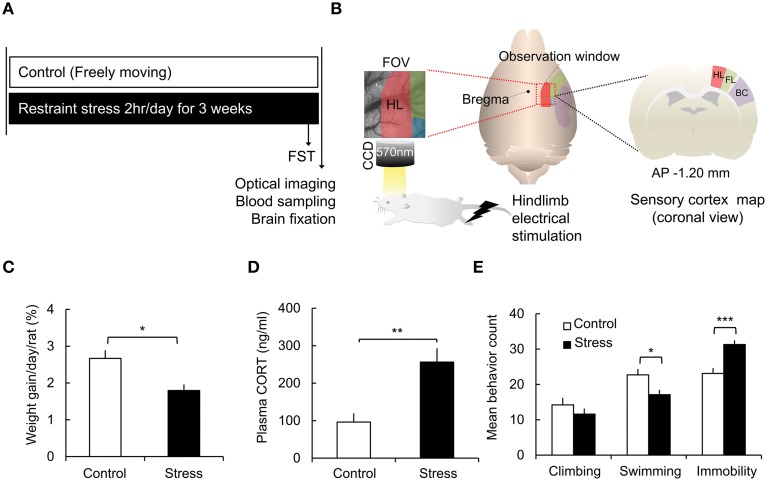
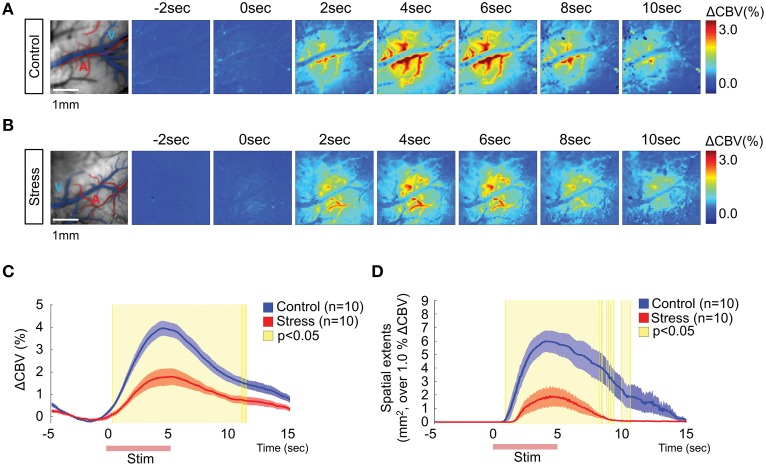
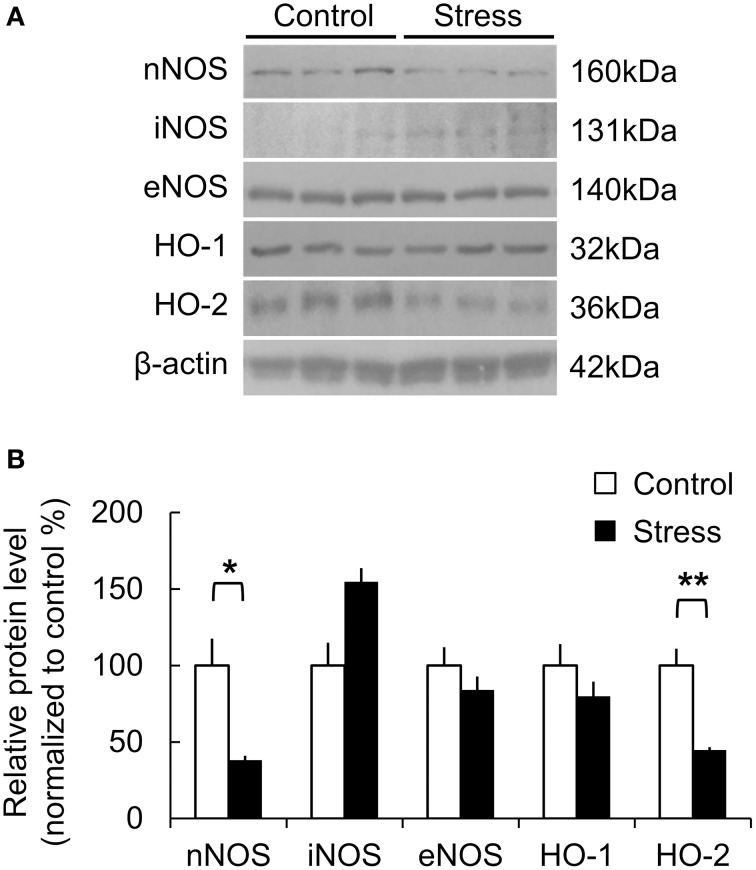
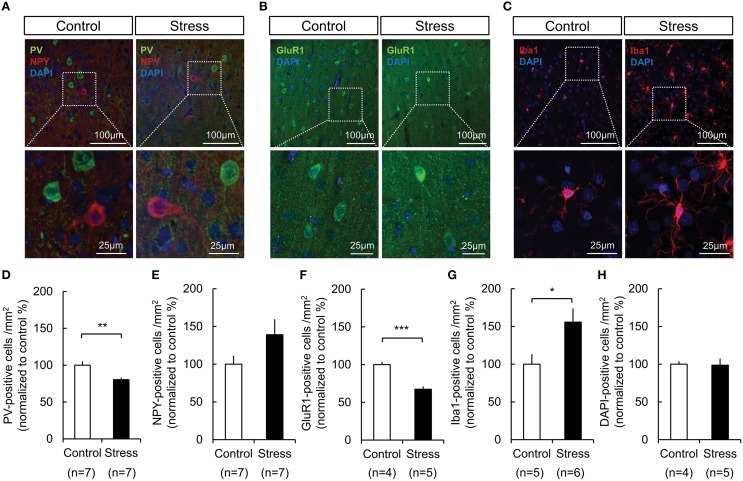
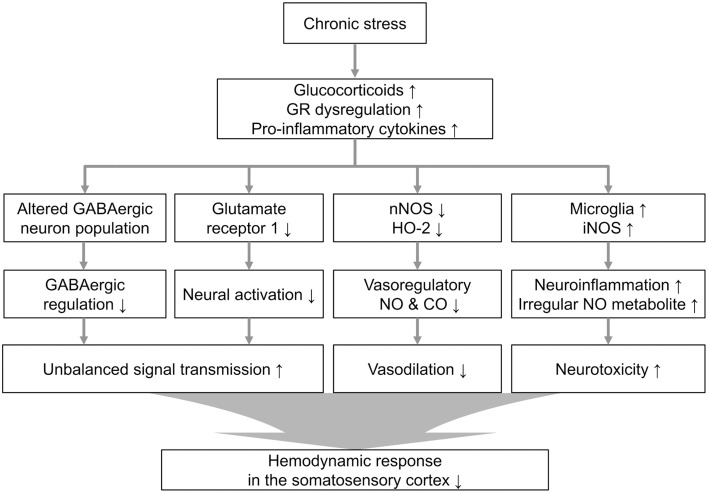
Repeated stress is one of the major risk factors for cerebrovascular disease, including stroke, and vascular dementia. However, the functional alterations in the cerebral hemodynamic response induced by chronic stress have not been clarified. Here, we investigated the in vivo cerebral hemodynamic changes and accompanying cellular and molecular changes in chronically stressed rats. After 3 weeks of restraint stress, the elicitation of stress was verified by behavioral despair in the forced swimming test and by physical indicators of stress. The evoked changes in the cerebral blood volume and pial artery responses following hindpaw electrical stimulation were measured using optical intrinsic signal imaging. We observed that, compared to the control group, animals under chronic restraint stress exhibited a decreased hemodynamic response, with a smaller pial arterial dilation in the somatosensory cortex during hindpaw electrical stimulation. The effect of chronic restraint stress on vasomodulator enzymes, including neuronal nitric oxide synthase (nNOS) and heme oxygenase-2 (HO-2), was assessed in the somatosensory cortex. Chronic restraint stress downregulated nNOS and HO-2 compared to the control group. In addition, we examined the subtypes of cells that can explain the environmental changes due to the decreased vasomodulators. The expression of parvalbumin in GABAergic interneurons and glutamate receptor-1 in neurons were decreased, whereas the microglial activation was increased. Our results suggest that the chronic stress-induced alterations in cerebral vascular function and the modulations of the cellular expression in the neuro-vasomodulatory system may be crucial contributing factors in the development of various vascular-induced conditions in the brain.
Keywords: chronic stress; neurovascular coupling; optical intrinsic signals; restraint stress; sensory stimulation; somatosensory cortex.
Figures

Similar articles
-
Neurovascular Coupling under Chronic Stress Is Modified by Altered GABAergic Interneuron Activity.J Neurosci. 2019 Dec 11;39(50):10081-10095. doi: 10.1523/JNEUROSCI.1357-19.2019. Epub 2019 Oct 31. J Neurosci. 2019. PMID: 31672788 Free PMC article.
-
Evaluation of coupling between optical intrinsic signals and neuronal activity in rat somatosensory cortex.Neuroimage. 2003 Jul;19(3):884-94. doi: 10.1016/s1053-8119(03)00086-7. Neuroimage. 2003. PMID: 12880817
-
Chronic stress adaptation of the nitric oxide synthases and IL-1β levels in brain structures and hypothalamic-pituitary-adrenal axis activity induced by homotypic stress.J Physiol Pharmacol. 2015 Jun;66(3):427-40. J Physiol Pharmacol. 2015. PMID: 26084225
-
How reliable is cerebral blood flow to map changes in neuronal activity?Auton Neurosci. 2019 Mar;217:71-79. doi: 10.1016/j.autneu.2019.01.005. Epub 2019 Jan 29. Auton Neurosci. 2019. PMID: 30744905 Review.
-
Alteration of somatosensory response in adulthood by early life stress.Front Mol Neurosci. 2015 May 19;8:15. doi: 10.3389/fnmol.2015.00015. eCollection 2015. Front Mol Neurosci. 2015. PMID: 26041988 Free PMC article. Review.
Cited by
-
Stress Affects Central Compensation of Neural Responses to Cochlear Synaptopathy in a cGMP-Dependent Way.Front Neurosci. 2022 Jul 29;16:864706. doi: 10.3389/fnins.2022.864706. eCollection 2022. Front Neurosci. 2022. PMID: 35968392 Free PMC article.
-
Excitation-Inhibition Imbalance Leads to Alteration of Neuronal Coherence and Neurovascular Coupling under Acute Stress.J Neurosci. 2020 Nov 18;40(47):9148-9162. doi: 10.1523/JNEUROSCI.1553-20.2020. Epub 2020 Oct 21. J Neurosci. 2020. PMID: 33087471 Free PMC article.
-
Cerebrovascular dysfunction with stress and depression.Brain Circ. 2018 Apr-Jun;4(2):43-53. doi: 10.4103/bc.bc_6_18. Epub 2018 Jun 29. Brain Circ. 2018. PMID: 30276336 Free PMC article. Review.
-
Parvalbumin interneuron alterations in stress-related mood disorders: A systematic review.Neurobiol Stress. 2021 Aug 12;15:100380. doi: 10.1016/j.ynstr.2021.100380. eCollection 2021 Nov. Neurobiol Stress. 2021. PMID: 34557569 Free PMC article. Review.
-
Orofacial Neuropathic Pain Leads to a Hyporesponsive Barrel Cortex with Enhanced Structural Synaptic Plasticity.PLoS One. 2016 Aug 22;11(8):e0160786. doi: 10.1371/journal.pone.0160786. eCollection 2016. PLoS One. 2016. PMID: 27548330 Free PMC article.
References
LinkOut - more resources
Full Text Sources
Other Literature Sources