. 2016 Jan 8:9:498.
doi: 10.3389/fncel.2015.00498. eCollection 2015.

β-Secretase 1's Targeting Reduces Hyperphosphorilated Tau, Implying Autophagy Actors in 3xTg-AD Mice

Affiliations

β-Secretase 1's Targeting Reduces Hyperphosphorilated Tau, Implying Autophagy Actors in 3xTg-AD Mice

Diego Piedrahita et al. Front Cell Neurosci. .

Abstract

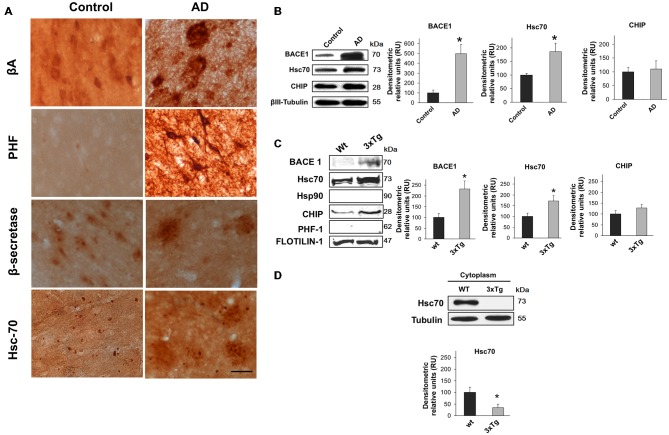
β-site APP cleaving enzyme 1 (BACE1) initiates APP cleavage, which has been reported to be an inducer of tau pathology by altering proteasome functions in Alzheimer's disease (AD). However, the exact relationship between BACE1 and PHF (Paired Helical Filaments) formation is not clear. In this study, we confirm that BACE1 and Hsc70 are upregulated in the brains of AD patients, and we demonstrate that both proteins show enhanced expression in lipid rafts from AD-affected triple transgenic mouse brains. BACE1 targeting increased Hsc70 levels in the membrane and cytoplasm fractions and downregulated Hsp90 and CHIP in the nucleus in the hippocampi of 3xTg-AD mice. However, these observations occurred in a proteasome-independent manner in vitro. The BACE1miR-induced reduction of soluble hyperphosphorylated tau was associated with a decrease in MAPK activity. However, the BACE1 RNAi-mediated reduction of hyperphosphorylated tau was only blocked by 3-MA (3-methyladenine) in vitro, and it resulted in the increase of Hsc70 and LAMP2 in lipid rafts from hippocampi of 3xTg-AD mice, and upregulation of survival and homeostasis signaling. In summary, our findings suggest that BACE1 silencing neuroprotects reducing soluble hyperphosphorylated tau, modulating certain autophagy-related proteins in aged 3xTg-AD mice.

Keywords: Alzheimer’s disease; autophagy; chaperones; lipid rafts; tauopathy; β-secretase 1.


Figures

Figure 1
Figure 1
BACE1 and Hsc70 in AD-affected human brains and in lipid rafts from triple-transgenic Alzheimer’s disease mouse brains. (A) β-amyloid, PHF-1, BACE1 and Hsc70 immunoreactivity in the temporal gyrus of AD-affected brains (AD) and control brains. 40× magnification; scale bar: 20 μm. n = 4. (B) BACE1, Hsc70 and CHIP Western blotting from the temporal gyrus of AD brains (AD); normal human brains were used as controls. A representative plot is shown. βIII-tubulin was used as a loading control. Densitometric quantification was performed; RU = relative units. n = 4, *p < 0.05. (C) Western blotting of BACE1, Hsc70, Hsp90, CHIP and PHF-1 proteins in lipid rafts isolated from the cerebral cortex of 15-month-old wild-type and 3xTg-AD mice. Flotillin-1 was used as a loading control. Densitometric quantification was performed; RU = relative units. n = 3, *p < 0.05. (D) Western blotting of Hsc70 in the cytoplasmic fraction from the cerebral cortex of wild-type and 3xTg-AD mice. RU = relative units. n = 3, *p < 0.05. Representative blots are shown. The arrow shows the band corresponding to the expected molecular weight of the BACE1 protein.
Figure 2
Figure 2
BACE1miR produces specific BACE1 silencing and reduces β-amyloidosis in 3xTg-AD mice. (A) Representative confocal images of BACE1 and BACE2 immunofluorescence in the hippocampus from wild-type mice at 6 months after injection with AAV2/5-BACE1miR compared to mice with AAV2/5-GFP injection (Control). Green: GFP fluorescence, red: Alexa 594. 60× magnification; scale bar: 20 μm. n = 3. (B) Representative immunoblots showing BACE1 and BACE2 protein levels from the hippocampi of wild-type mice at 3 weeks, 3 months and 6 months after injection with AAV2/5-BACE1miR compared to the control values (AAV2/5-GFP). n = 3. (C) β-secretase 1 (BACE1) and β-amyloid immunoreactivities in the dentate gyrus (DG) of 18-month-old 3xTg-AD mice treated with AAV2/5-BACE1miR or AAV2/5-GFP as control for 6 months. The black arrowheads show the downregulation of the BACE1 and β-A immunostaining. Green: GFP fluorescence, adeno-associated virus (AAV) distribution in the DG. 40×, scale bar: 20 μm. n = 3. (D) Representative immunoblots showing BACE1, the C-terminal fragment (CTF-β), APP-CT, APP-NT, full-length PS1 and the C-terminal fragment of PS1 from the hippocampi of 18-month-old 3xTg-AD mice evaluated at 6 months after injection of AAV2/5-BACE1miR or AAV2/5-GFP as a control. RU = relative units. n = 4, *p < 0.05. (E) β-amyloid 1–40 and 1–42 levels from the hippocampi of 18-month-old 3xTg-AD mice were evaluated by ELISA at 6 months after the injection of AAV2/5-BACE1miR or AAV2/5-GFP; C57BL/6 mice were also used as controls. Absorbance was measured at 620 nm. n = 5, *p < 0.05.
Figure 3
Figure 3
BACE1miR reverses hyper-phosphorylated tau in the hippocampus of 3xTg-AD mice. (A) The number of PHF-positive cells in the CA1 region of the hippocampus of 18-month-old 3xTg-AD mice that were treated with AAV2/5-BACE1miR or AAV2/5-GFP as control for 6 months. The white arrowhead shows a significant decrease in immunoreactivity. Representative confocal-DSU images ofimmunofluorescence are shown. Red: Alexa 594, 10× magnification, scale bar: 20 μm. n = 3, *p < 0.05. (B) Representative bands of the soluble and insoluble fractions of tau. n = 3, *p < 0.05. (C) Levels of the hyperphosphorylated tau (PHF-1, AT8, AT100, AT180 and TAU-5) protein from the hippocampi of 18-month-old 3xTg-AD mice at 6 months after injection with AAV2/5-BACE1miR or AAV2/5-GFP as control. Representative blots are shown. RU = relative units. n = 4, *p < 0.05. (D) CDK5, (E) CDK5 activity, (F) GSK3- β, (G) Bcl-2, (H) MAPK activity and ERK-1/ERK-2 protein levels were detected. (I) Protein phosphatase 2 (PP2A) activity was quantified using the PP2A Immunoprecipitation (IP) Phosphatase Assay Kit (Millipore), which detects picomoles of phosphate per microliter. n = 4, *p < 0.05. Representative blots are shown. RU = relative units. n = 4, *p < 0.05, **p < 0.001.
Figure 4
Figure 4
BACE1miR decreases HSF-1, upregulates Hsc70 and induces differential cellular distribution of Hsc70 and Hsp90 in the hippocampus of 3xTg-AD mice. (A) Hippocampi of 18-month-old 3xTg-AD mice at 12 months after injection with AAV2/5-BACE1miR (BACE1miR) or AAV2/5-GFP (GFP). Immunofluorescence of Hsc70 in the CA1 region of 3xTg-AD mice. The white arrowheads show a significant increase in Hsc70 protein expression in the CA1 region that was injected with AAV2/5.BACE1miR compared to the left hemisphere (not injected) and to a right hemisphere injected with AAV2/5-GFP (control). Red: Alexa 594. 10X magnification, scale bar: 20 μm. n = 3. (B) Graph of Hsc70 fluorescence intensity (red channel) in the CA1 area showing a significant increase of Hsc70 expression in BACE1miR-treated mice compared to the left hemisphere (not injected) and right hemisphere injected with AAV2/5-GFP (control). Quantification was performed using image Scope Pro software (Media Cybernetics); RU = relative units. n = 3, *p < 0.05. (C) Cellular fractions from the hippocampi of 15-month-old 3xTg-AD mice that were treated with AAV2/5-BACE1miR (BACE1miR) or AAV2/5-GFP (GFP) for three weeks. Hsc70, CHIP and Hsp90 levels in the (C) cytoplasm, (D) membrane and (E) nuclear fractions. (F) HSF-1 protein expression in the hippocampi of 15-month-old 3xTg-AD mice at three weeks after injection with AAV2/5-BACE1miR (BACE1miR) or AAV2/5-GFP (GFP). Representative blots are shown. βIII tubulin, flotillin and NeuN were used as loading controls or as fraction controls. Densitometric quantification was performed; RU = relative units. n = 6, *p < 0.05, **p < 0.001, ***p < 0.0001.
Figure 5
Figure 5
BACE1miR decreased hyper-phosphorylated tau in a proteosome-independent manner in primary neuronal cultures. (A) BACE1, PHF-1, Hsp90, Hsc70, CHIP, pAkt (ser473), GSK3 (pSer9) and CDK5 Western blots from primary neuronal cultures transduced at DIV5 (7 days transduction) with AAV2/5-BACE1miR or AAV2/5-GFP as a control. Representative blots are shown. Actin was used as a loading control. Densitometric quantification was performed; RU = relative units. n = 4, *p < 0.05, *p < 0.001. (B) Western blotting of primary cortical cultures transduced with AAV2/5-BACE1miR or AAV2/5-GFP at DIV5 for 7 days. Neurons were exposed to lactacystin (synthetic; 10 μM), KNK437 heat shock protein inhibitor I, (100 μM) or DMSO for 24 h. Representative blots of (B) PHF-1, (C) Hsc70, (D) Hsp90, (E) CHIP and (F) LC3-B. βIII-tubulin was used as a loading control. Densitometric quantification was performed; RU = relative units. n = 4, *p < 0.05, **p < 0.001, ***p < 0.0001.
Figure 6
Figure 6
BACE1miR reduces the level of hyperphosphorylated tau, and this effect is blocked by 3-MA. Primary cortical cultures were transduced with AAV2/5-BACE1miR or AAV2/5-GFP at DIV5 for 7 days. The neurons were exposed to autophagy inhibitors, including 3-methyladenine (10 mM), bafilomycin (100 nM), ammonium chloride (NH4Cl, 20 mM) or DMSO for 24 h. (A) Representative bands and quantification of the levels of LC-3B I and II proteins from neurons transduced with AAV2/5-BACE1miR or AAV2/5-GFP and treated with DMSO, (B) 3-methyladenine (10 mM), (C) bafilomycin (100 nM), and (D) ammonium chloride (NH4Cl, 20 mM). RU = relative units, n = 3, *p < 0.05. (E) Representative Western blots for PHF-1 from neurons transduced with AAV2/5-GFP or AAV2/5-BACE1miR. βIII-tubulin was used as a loading control. Densitometric quantification was performed; RU = relative units. n = 3, *p < 0.05. (F,J) GFP expression in hippocampal neurons transduced with AAV2/5-GFP (control). (H,L) GFP expression in hippocampal neurons transduced with AAV2/5-BACE1miR (BACE1miR). (G,K) LC3B immunofluorescence in neurons transduced with AAV2/5-GFP (control). (I,M) LC3B immunofluorescence in neurons transduced with AAV2/5-BACE1miR (BACE1miR). (F–I) Neurons were treated with DMSO as a control; (J–M) neurons were treated with 3-methyladenine (10 mM). Green: GFP fluorescence, red: Alexa 594 fluorescence. 60X magnification; scale bar: 20 μm. n = 3. (N) Quantification of the LC3B fluorescence intensity using Scope-Pro image software (Media Cybernetics) in neurons transduced with AAV2/5-BACE1miR or AAV2/5-GFP and treated with 3-methyladenine (10 mM) or DMSO; RU = relative units, n = 3, *p < 0.05.
Figure 7
Figure 7
BACE1 silencing upregulates Hsc70 and LAMP-2. Hippocampi of 15-month-old 3xTg-AD mice were analyzed at three weeks after injection with AAV2/5-BACE1miR (BACE1miR) or AAV2/5-GFP (GFP). (A) LC3-B protein levels in the membrane and cytoplasm fractions. (B) BACE1, Hsc70, and LAMP-2A protein levels in lipid rafts and LAMP2-A in the cytoplasm from hippocampi of 15-month-old 3xTg-AD mice treated for three weeks with AAV2/5-BACE1miR (BACE1miR) or AAV2/5-GFP (GFP). βIII tubulin and flotillin were used as a loading control and a fraction control respectively Densitometric quantification was performed; RU = relative units. n = 4, *p < 0.05.
Figure 8
Figure 8
Silencing of BACE1 upregulates the survival signaling in 3xTg-AD mice. Survival and quality control regulation pathways were analyzed. (A) Bcl2/Beclin-1, (B) Akt/FoxO3, (C) Hsc70/Hsp90/CHIP protein levels, (D) mTOR pathway and its activity (E) from the hippocampi of 3xTg-AD mice 24-month-old after 6 months of injection with AAV2/5-BACE1miR and AAV2/5-GFP version as control. Representative blots are shown. RU = relative unit. n = 4, *p < 0.05.

Similar articles

Cited by

References

    1. Agarraberes F. A., Terlecky S. R., Dice J. F. (1997). An intralysosomal hsp70 is required for a selective pathway of lysosomal protein degradation. J. Cell Biol. 137, 825–834. 10.1083/jcb.137.4.825 - DOI - PMC - PubMed
    1. Ahmed R. R., Holler C. J., Webb R. L., Li F., Beckett T. L., Murphy M. P. (2010). BACE1 and BACE2 enzymatic activities in Alzheimer’s disease. J. Neurochem. 112, 1045–1053. 10.1111/j.1471-4159.2009.06528.x - DOI - PMC - PubMed
    1. Alani B., Salehi R., Sadeghi P., Zare M., Khodagholi F., Arefian E., et al. . (2014). Silencing of Hsp90 chaperone expression protects against 6-hydroxydopamine toxicity in PC12 cells. J. Mol. Neurosci. 52, 392–402. 10.1007/s12031-013-0163-9 - DOI - PubMed
    1. Ali A., Bharadwaj S., O’Carroll R., Ovsenek N. (1998). HSP90 interacts with and regulates the activity of heat shock factor 1 in Xenopus oocytes. Mol. Cell. Biol. 18, 4949–4960. 10.1128/mcb.18.9.4949 - DOI - PMC - PubMed
    1. Al-Mulla F., Bitar M. S., Thiery J. P., Zea T. T., Chatterjee D., Bennett L., et al. . (2013). Clinical implications for loss or diminution of expression of Raf-1 kinase inhibitory protein and its phosphorylated form in ductal breast cancer. Am. J. Cancer Res. 3, 446–464. - PMC - PubMed