. 2016 Jan 8:9:505.
doi: 10.3389/fncel.2015.00505. eCollection 2015.

Platelet Activating Factor Enhances Synaptic Vesicle Exocytosis Via PKC, Elevated Intracellular Calcium, and Modulation of Synapsin 1 Dynamics and Phosphorylation

Affiliations

Platelet Activating Factor Enhances Synaptic Vesicle Exocytosis Via PKC, Elevated Intracellular Calcium, and Modulation of Synapsin 1 Dynamics and Phosphorylation

Jennetta W Hammond et al. Front Cell Neurosci. .

Erratum in

Abstract

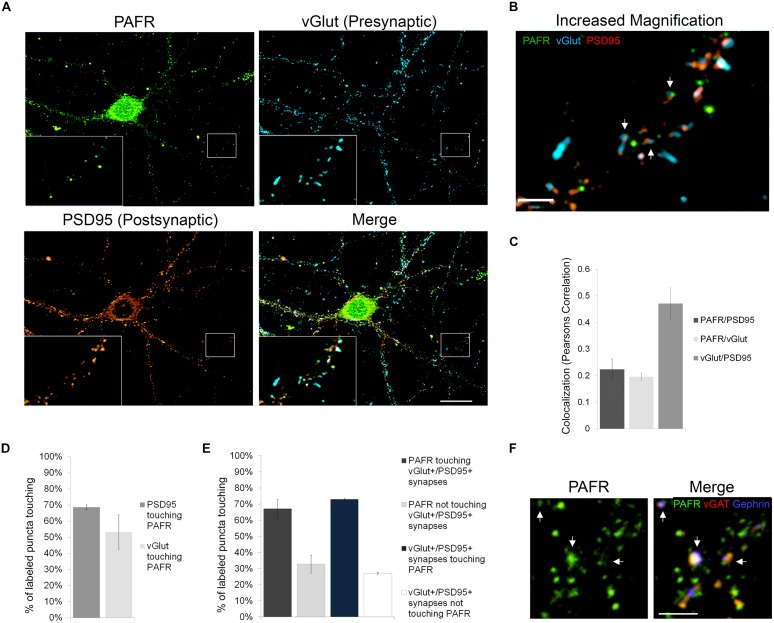
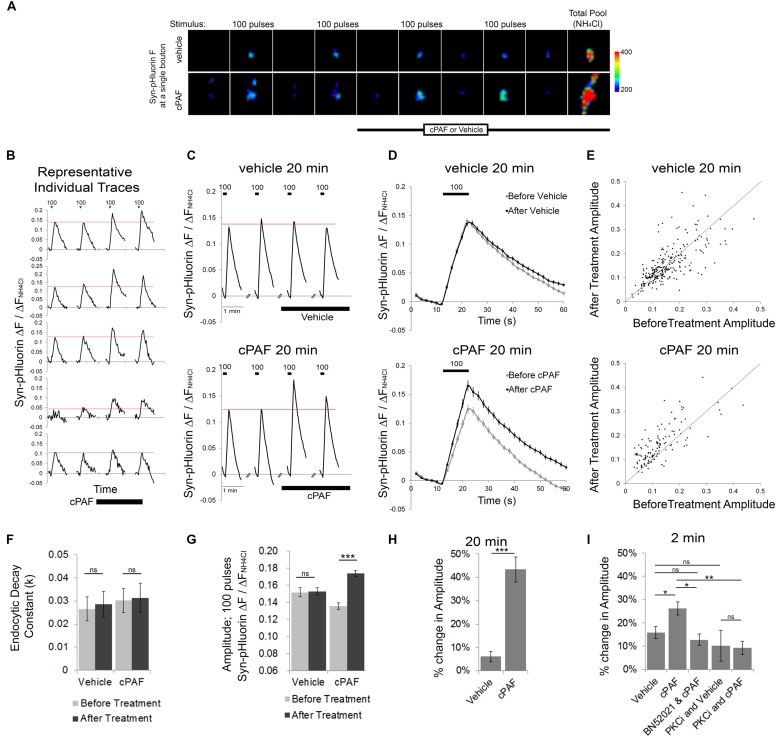
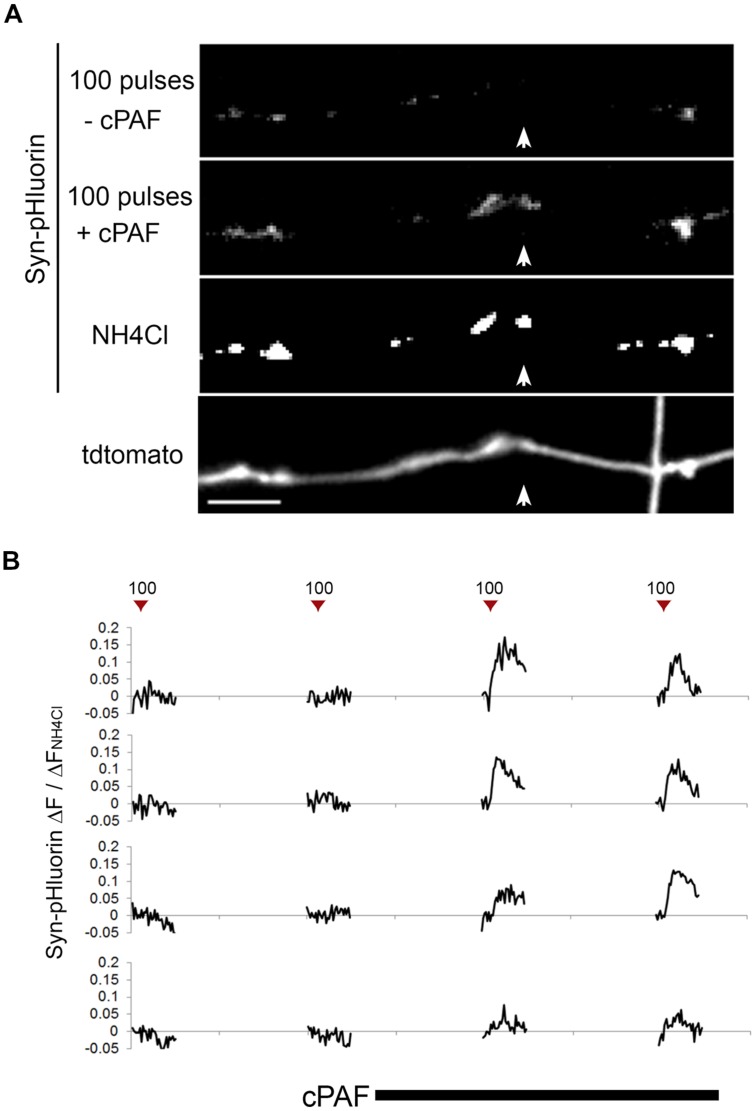
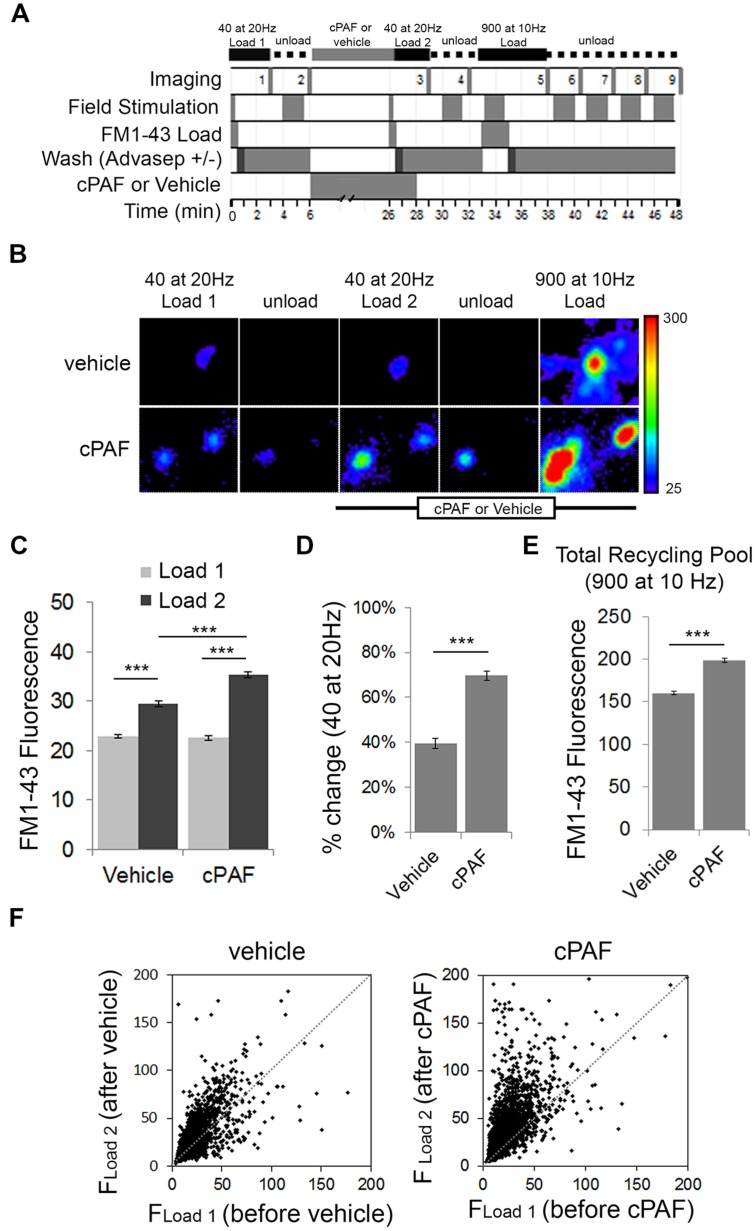
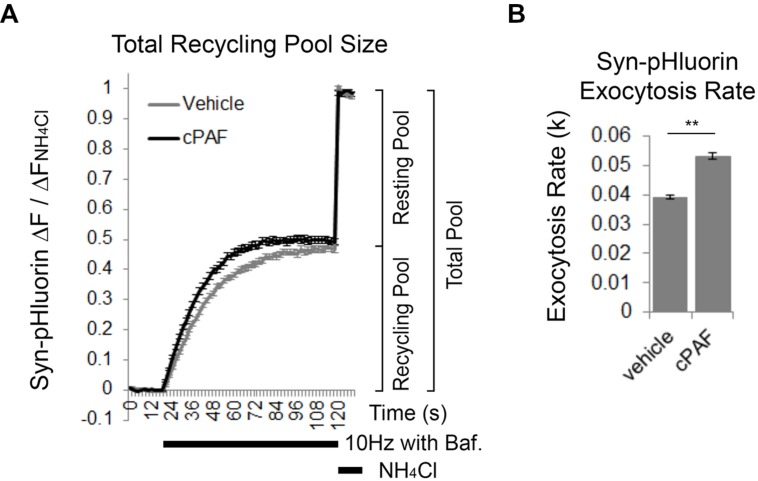
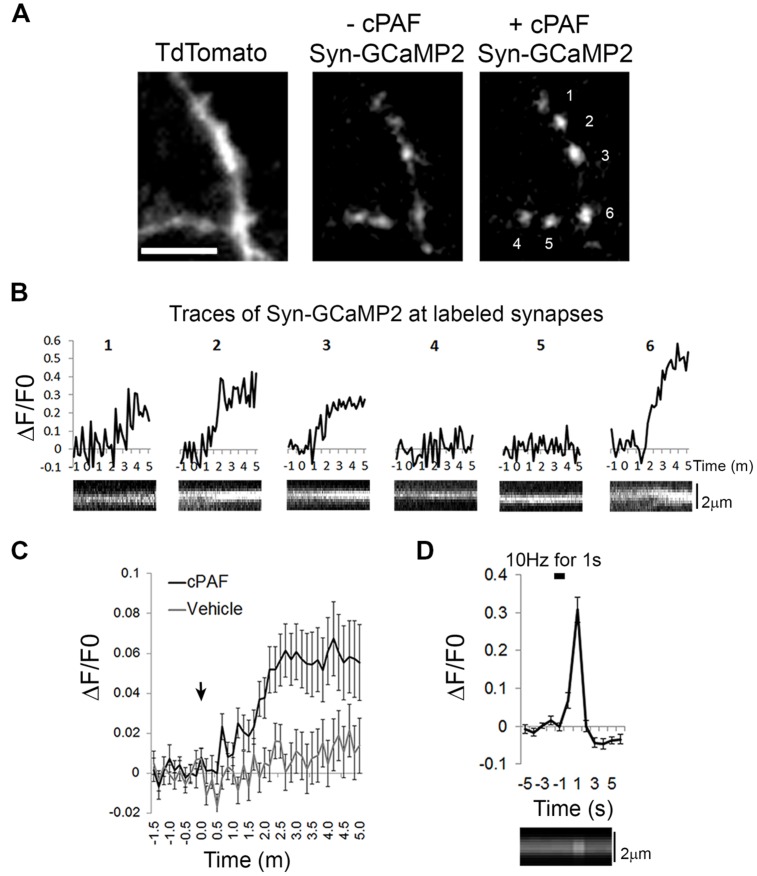
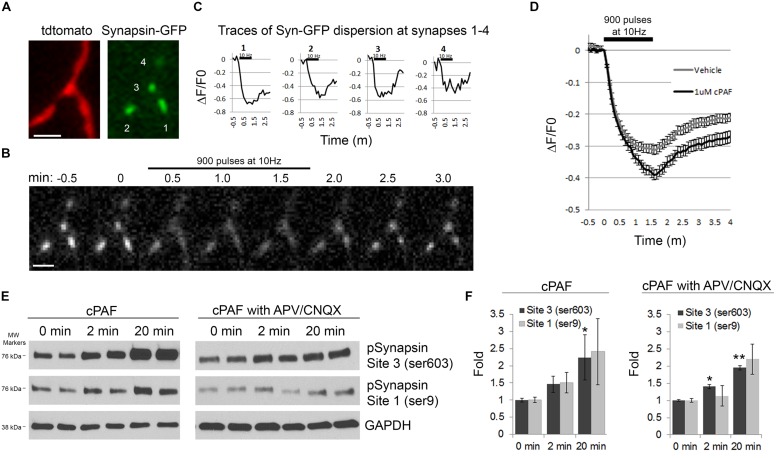
Platelet activating factor (PAF) is an inflammatory phospholipid signaling molecule implicated in synaptic plasticity, learning and memory and neurotoxicity during neuroinflammation. However, little is known about the intracellular mechanisms mediating PAF's physiological or pathological effects on synaptic facilitation. We show here that PAF receptors are localized at the synapse. Using fluorescent reporters of presynaptic activity we show that a non-hydrolysable analog of PAF (cPAF) enhances synaptic vesicle release from individual presynaptic boutons by increasing the size or release of the readily releasable pool and the exocytosis rate of the total recycling pool. cPAF also activates previously silent boutons resulting in vesicle release from a larger number of terminals. The underlying mechanism involves elevated calcium within presynaptic boutons and protein kinase C activation. Furthermore, cPAF increases synapsin I phosphorylation at sites 1 and 3, and increases dispersion of synapsin I from the presynaptic compartment during stimulation, freeing synaptic vesicles for subsequent release. These findings provide a conceptual framework for how PAF, regardless of its cellular origin, can modulate synapses during normal and pathologic synaptic activity.

Keywords: PAF; PKC; calcium; platelet activating factor; presynaptic plasticity; readily releasable pool; synapsin; synaptic vesicle pools.


Figures

FIGURE 1
FIGURE 1
The PAFR co-localizes to synapses. (A,B) Immunofluorescence of hippocampal neuronal cultures 21 days in vivo (DIV). PAFR (green); presynaptic marker vGlut (blue); postsynaptic marker PSD95 (red). (A) Boxed region is shown with 3× magnification in left corner and further magnified in (B). Scale bars A = 20 μm, B = 3 μm. Arrows highlight PAFR puncta touching vGlut+/PSD95+ synapses. (C) Colocalization of PAFR, PSD95, and vGlut calculated as Pearsons correlation coefficient. (D) Quantification of the percent of PSD95 or vGlut puncta touching PAFR puncta. (E) Quantification of the percent of PAFR puncta that contact vGut+/PSD95+ synapses and the percent of vGlut+/PSD95+ synapses that contact PAFR puncta. Error bars represent ±SEM. (F) Immunofluorescence of hippocampal neuronal cultures. PAFR (green); inhibitory presynaptic marker vGAT (red); inhibitory postsynaptic marker Gephrin (blue). Scale bar = 3μm. Arrows highlight PAFR puncta touching vGAT+/Gephrin+ synapses.
FIGURE 2
FIGURE 2
cPAF enhances presynaptic vesicle exocytosis. (A–D) The Syn-pHluorin fluorescence (F) at single boutons (from primary hippocampal cultures transfected with Syn-pHluorin) increases after each 100 pulse stimuli at 10 Hz as a portion of labeled vesicles are exocytosed and then returns to baseline as synaptic vesicles are internalized. Treatment with NH4Cl raises the pH of all internal vesicle and results in maximal pHluorin fluorescence representative of the total vesicle pool. All Syn-pHluorin measurements are normalized to the ΔF with NH4Cl. (A) Representative fluorescence images of single boutons treated with 1 μM cPAF or vehicle. Images are 4.3 μm × 4.3 μm. (B) Examples of individual traces (ΔFFNH4Cl) from representative boutons treated with 1 μM cPAF. (C) Traces show the average Syn-pHluorin ΔFFNH4Cl over time for all boutons treated with 1 μM cPAF or vehicle. Vehicle, 20 min: 263 boutons from seven coverslips; cPAF, 20 min: 120 boutons from five coverslips. (D) Average ΔFFNH4Cl response to the two before treatment 100 pulse stimuli shown overlapping the average response to the two 100 pulse stimuli given after 1 μM cPAF or vehicle treatment. (E) Scatter plot of the average peak amplitude of ΔFFNH4Cl induced by 100 pulse stimuli before and after 20 min treatment with vehicle or 1 μM cPAF. (F) Non-linear regression of decay part of ΔFFNH4Cl trace (in D) was used to quantitate the endocytic decay constant (k) followed by testing the null hypothesis of one rate for all data sets (p = 0.807). (G) Average peak amplitude of ΔFFNH4Cl induced by 100 pulse stimuli before and after 20 min treatment with vehicle or 1 μM cPAF. Statistical analysis was performed using two-way ANOVA with repeated measures followed by Sidak’s multiple comparison tests. (H) Quantification of the % change in peak amplitude due to 20 min treatment of vehicle or 1 μM cPAF. Statistical analysis used paired Student’s t-test. (I) Quantification of the % change in peak amplitude due to 2 min treatment of vehicle or 1 μM cPAF. Some samples were also pretreated 30 min with BN52021 (a PAFR inhibitor) or PKCi (a PKC inhibitor). Statistical analysis used one-way ANOVA with Sidak’s multiple comparison tests. For all graphs statistical significance is indicated by the following markings: p < 0.1; ∗∗p < 0.01; ∗∗∗p < 0.001; ns = not significant. Error bars are ±SEM.
FIGURE 3
FIGURE 3
cPAF activates silent presynaptic boutons. (A) Images show average peak ΔF of Syn-pHluorin upon stimulation of 100 pulses at 10 Hz or NH4Cl treatment. A small percentage of synapses show no measurable exocytosis following stimulation, although acidification of all vesicles by NH4Cl shows Syn-pHluorin is present in these boutons (example highlighted by white arrow). Note that after cPAF treatment (20 min) all boutons imaged show potentiation due to cPAF and the previously silent boutons are now robustly active. Scale bar 5 μm. (B) Representative Syn-pHluorin ΔFFNH4Cl traces of silent boutons that were activated by 1 μM cPAF (20 min). The first trace corresponds to the bouton in (A) highlighted by the white arrow.
FIGURE 4
FIGURE 4
cPAF enhances the size or release probability of the readily releasable pool (RRP) and the size of the total recycling pool as determined by FM1-43 dye uptake. (A) Schematic of FM1-43 dye loading protocol. Cells were stimulated with 40 pulses (2 s at 20 Hz) to load the RRP (Load 1 = before treatment and Load 2 = after treatment). Cells were stimulated with 900 pulses (90 s at 10 Hz) to load the recycling pool or to unload FM dye. (B) Representative boutons from vehicle and cPAF treated samples. Scale of images = 4 μm × 4.6 μm. (C) Quantification of the average FM1-43 Fluorescence (±SEM) obtained for Load 1 and Load 2 of the RRP from boutons treated 20 min with vehicle or 1 μM cPAF (vehicle n = 2098 boutons from three coverslips; cPAF n = 3030 boutons from four coverslips). Statistical analysis was performed using two-way ANOVA followed by Sidak’s multiple comparison tests. (D) Quantification of the average % change [(FLoad2FLoad1)/FLoad1) in FM1-43 fluorescence due to vehicle or cPAF treatment. Statistical analysis was performed using Student’s t-test. (E) Quantification of the total recycling pool as the average FM1-43 Fluorescence (±SEM) in boutons after a 900 pulse at 10 Hz stimulation for neuronal cultures treated 20 min with vehicle or 1 μM cPAF. (F) Scatter plot of FM1-43 fluorescence before (FLoad1) and after (FLoad2) cPAF or vehicle treatment. For all graphs statistical significance is indicated by the following marking: ∗∗∗p < 0.001. Error bars ±SEM.
FIGURE 5
FIGURE 5
cPAF increases the exocytosis rate of the total recycling pool. (A,B) Cells, transfected with Syn-pHluorin, were stimulated with 1000 pulses at 10 Hz in the presence of bafilomycin (a proton pump inhibitor) to induce the release of all synaptic vesicles in the total recycling pool while preventing the reacidification of the vesicles after endocytosis that usually quenches pHluorin fluorescence. Following the stimulation, cells were treated with NH4Cl to measure the total pool of synaptic vesicles. (A) Average Syn-pHluorin ΔFFNH4Cl traces from cells pretreated for 20 min with vehicle or 1 μM cPAF. (Plateau values at end of 1000 pulse stimulus = total recycling pool size: Vehicle 0.47 ± 0.01 (n = 534 synapses from seven coverslips; cPAF 0.50 ± 0.01 (n = 558 synapses from seven coverslips). Student’s t-test p = 0.09). (B) Syn-pHluorin ΔFFNH4Cl traces were fit with a single exponential function by non-linear regression to determine the exocytosis rate constant (k) for the total recycling pool followed by testing the null hypothesis of one rate for all data. ∗∗p < 0.001 Error bars ±SEM.
FIGURE 6
FIGURE 6
cPAF raises calcium levels in presynaptic boutons. (A) Hippocampal neurons expressing Tdtomato (to view axons) and the calcium indicator Syn-GCaMP2 before and after 5 min with 2 μM cPAF. Scale is 4 μm. (B) Traces showing Syn-GCaMp2 % change in fluorescence (ΔF/F0) over time from boutons numbered in (A) that were treated with cPAF at time 0. Under each trace is a kymograph showing the Syn-GCaMP2 fluorescence from a line scan through the same bouton. (C) Quantification of the average Syn-GCaMP2 % change (ΔF/F0) of fluorescence over time from all boutons treated with cPAF or vehicle. (cPAF: 71 boutons from five coverslips; vehicle: 59 boutons from three coverslips; Student’s t-test at 3 min p = 0.0010; Error bars are ±SEM. (D) Quantification of the average % change in fluorescence (ΔF/F0) over time evoked by a 10 Hz for 1 s field stimulus. (27 boutons from two coverslips; Error bars are ±SEM) Kymograph under graph shows the Syn-GCaMP2 fluorescence from a line scan through a representative bouton. Error bars are ±SEM.
FIGURE 7
FIGURE 7
cPAF increases synapsin I phosphorylation and synapsin I dispersion from presynaptic boutons during stimulation. (A–D) Hippocampal neurons expressing synapsin I-GFP and Tdtomato were treated with 1 μM cPAF for 2 min then stimulated with 900 pulses at 10 Hz. (A) Synapsin I-GFP (Syn-GFP) is clustered at presynaptic boutons while tdtomato fills the entire axon. Scale bar = 2 μm. (B) Syn-GFP fluorescence at synapses decreases upon stimulation then reclusters within the bouton. Scale bar = 2 μm. (C) Timelapse measurements of the change in Syn-GFP fluorescence intensity obtained from the boutons numbered in (A) normalized to the fluorescence at time 0. (D) Average ΔF/F0 in syn-GFP fluorescence from all boutons treated with 1 μM cPAF or vehicle. Error bars ±SEM (cPAF: 141 boutons from three coverslips; vehicle: 240 boutons from four coverslips;). Non-linear regression of decay part of synapsin I dispersion curve followed by testing the null hypothesis of one curve for all data sets has p < 0.0001. Statistical analysis comparing cPAF to vehicle treated boutons at the end of stimulation (1.5 min) was done using the Student’s t-test p = 0.0005. (E) Representative western blots showing phosphorylated synapsin I (pSynapsin) at Site 3 (Ser603) and Site 1 (Ser9) and GAPDH immunoreactivity from cell lysates obtained from primary hippocampal cultures that were treated 0, 2, or 20 min with 1 μM cPAF. Blot on right was additionally treated for a total of 30 min with 50 μM APV and 10 μM CNQX to block glutamatergic neurotransmission. (F) pSynapsin/GAPDH ratios calculated by densitometric scanning of the blots. Data are means ± SEM with n = 4 (two independent experiments each performed in duplicate). Statistical analysis: one-way ANOVA followed by Dunnett’s multiple comparison test to 0 min control. ANOVA: Site 3, p = 0.098; Site 3 with APV/CNQX, p = 0.024; Site 1, p = 0.211; Site 1 with APV/CNQX, p = 0.126. Dunnett’s multiplicity adjusted p-values (compared to 0 min control): p < 0.1 ∗∗p < 0.05.

Similar articles

Cited by

References

    1. Aihara M., Ishii S., Kume K., Shimizu T. (2000). Interaction between neurone and microglia mediated by platelet-activating factor. Genes Cells 5 397–406. 10.1046/j.1365-2443.2000.00333.x - DOI - PubMed
    1. Akisu M., Huseyinov A., Yalaz M., Cetin H., Kultursay N. (2003). Selective head cooling with hypothermia suppresses the generation of platelet-activating factor in cerebrospinal fluid of newborn infants with perinatal asphyxia. Prostaglandins Leukot. Essent. Fatty Acids 69 45–50. 10.1016/S0952-3278(03)00055-3 - DOI - PubMed
    1. Alabi A. A., Tsien R. W. (2012). Synaptic vesicle pools and dynamics. Cold Spring Harb. Perspect. Biol. 4 a013680 10.1101/cshperspect.a013680 - DOI - PMC - PubMed
    1. Bazan N. G., Squinto S. P., Braquet P., Panetta T., Marcheselli V. L. (1991). Platelet-activating factor and polyunsaturated fatty acids in cerebral ischemia or convulsions: intracellular PAF-binding sites and activation of a fos/jun/AP-1 transcriptional signaling system. Lipids 26 1236–1242. 10.1007/BF02536539 - DOI - PubMed
    1. Belanger C., Elimam H., Lefebvre J., Borgeat P., Marleau S. (2008). Involvement of endogenous leukotriene B4 and platelet-activating factor in polymorphonuclear leucocyte recruitment to dermal inflammatory sites in rats. Immunology 124 295–303. 10.1111/j.1365-2567.2007.02767.x - DOI - PMC - PubMed

LinkOut - more resources