. 2016 Jan 8:9:165.
doi: 10.3389/fnsys.2015.00165. eCollection 2015.

Genetic Pharmacotherapy as an Early CNS Drug Development Strategy: Testing Glutaminase Inhibition for Schizophrenia Treatment in Adult Mice

Affiliations

Genetic Pharmacotherapy as an Early CNS Drug Development Strategy: Testing Glutaminase Inhibition for Schizophrenia Treatment in Adult Mice

Susana Mingote et al. Front Syst Neurosci. .

Abstract

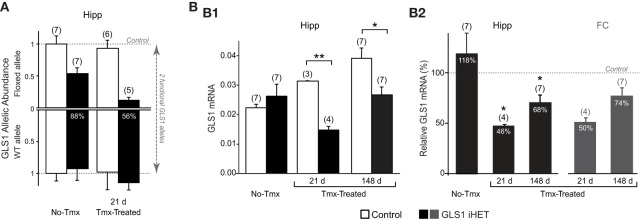
Genetic pharmacotherapy is an early drug development strategy for the identification of novel CNS targets in mouse models prior to the development of specific ligands. Here for the first time, we have implemented this strategy to address the potential therapeutic value of a glutamate-based pharmacotherapy for schizophrenia involving inhibition of the glutamate recycling enzyme phosphate-activated glutaminase. Mice constitutively heterozygous for GLS1, the gene encoding glutaminase, manifest a schizophrenia resilience phenotype, a key dimension of which is an attenuated locomotor response to propsychotic amphetamine challenge. If resilience is due to glutaminase deficiency in adulthood, then glutaminase inhibitors should have therapeutic potential. However, this has been difficult to test given the dearth of neuroactive glutaminase inhibitors. So, we used genetic pharmacotherapy to ask whether adult induction of GLS1 heterozygosity would attenuate amphetamine responsiveness. We generated conditional floxGLS1 mice and crossed them with global CAG(ERT2cre∕+) mice to produce GLS1 iHET mice, susceptible to tamoxifen induction of GLS1 heterozygosity. One month after tamoxifen treatment of adult GLS1 iHET mice, we found a 50% reduction in GLS1 allelic abundance and glutaminase mRNA levels in the brain. While GLS1 iHET mice showed some recombination prior to tamoxifen, there was no impact on mRNA levels. We then asked whether induction of GLS heterozygosity would attenuate the locomotor response to propsychotic amphetamine challenge. Before tamoxifen, control and GLS1 iHET mice did not differ in their response to amphetamine. One month after tamoxifen treatment, amphetamine-induced hyperlocomotion was blocked in GLS1 iHET mice. The block was largely maintained after 5 months. Thus, a genetically induced glutaminase reduction-mimicking pharmacological inhibition-strongly attenuated the response to a propsychotic challenge, suggesting that glutaminase may be a novel target for the pharmacotherapy of schizophrenia. These results demonstrate how genetic pharmacotherapy can be implemented to test a CNS target in advance of the development of specific neuroactive inhibitors. We discuss further the advantages, limitations, and feasibility of the wider application of genetic pharmacotherapy for neuropsychiatric drug development.

Keywords: GLS1; allelic abundance; antipsychotic; glutamate; glutamine; tamoxifen-inducible.


Figures

Figure 1
Figure 1
Generation of conditional floxGLS1 mice. (A) Insertion of 3-loxP construct into the GLS1 gene. (A1) A targeting construct engineered with loxP sites flanking exon 1 (thick black line with transcription start ATG codon indicated) of the GLS1 gene encoding glutaminase was inserted into the endogenous GLS1 locus by homologous recombination. The targeting vector (green) also contained a floxed PGK-neo-cassette (thick blue line) for positive selection of the ES cell clones. The blue bar indicates the position of external Probe A (blue), used for Southern analysis, while the black arrow indicates the length of the expected wild-type band and the red arrow the length of the expected mutant band. Note that an additional HindIII site was introduced along with the middle loxP site. (A2) In a HindIII digest of ES cell DNA, Probe A hybridized to a 6.5 kb band for the WT allele, in contrast to a 5.0 kb band for the 3-loxP allele. Results are shown for ES cells with non-homologous recombination (NHR) and homologous recombination (HR). (B) Breeding floxGLS1 mouse. (B1) 3-loxP mice were crossed with EIIacre partial deletor mice to remove the floxed PGK-neo cassette. 2-loxP progeny were identified by PCR genotyping using two primer pairs flanking the loxP sites. Blue bars indicate the location of the primers. (B2) The PCR gels show genotyping results for two mice. In the top gel, the 5′ loxP site was revealed by a 214 bp band, in addition to the WT allele of 157 bp in the mutant mouse (2-loxP). In the bottom gel, the 3′ loxP site was revealed by a 430 bp band, in addition to the WT and of 341 bp in the mutant mouse. (C) GLS1 mRNA expression from the floxGLS1 allele. mRNA was measured in whole hippocampus (Hipp) and frontal cortex (FC) tissue. Relative expression was normalized to the corresponding WT mice (dashed line), done in two cohorts of mice, lox/+ and lox/lox mice. There was no genotypic impact of GLS1 flox status on GLS1 mRNA. The number of samples is indicated above the bars (gray numbers correspond to the lox/+ cohort and black numbers correspond the lox/lox cohort).
Figure 2
Figure 2
Tamoxifen induction of GLS1 deficiency. (A) Test for universal cre action. CAGERT2cre∕+:: Rosa26fsEYFP∕+ mice and control Rosa26fsEYFP∕+ mice were treated with Tmx, and their brains subsequently immunostained to visualize EYFP, in the frontal cortex, striatum and hippocampus, as indicated on the sagittal brain section schematic (left). Confocal images revealed ubiquitous EYFP expression in CAGERT2cre∕+:: Rosa26fsEYFP∕+, but not Rosa26fsEYFP∕+ mice. (B) Primer strategy used to determine the presence of WT, floxed, and recombined (Δ) GLS1 alleles. Blue bars indicate the locations of the three primers used. Black arrow indicates length of the amplified WT allele, the red arrow the floxed allele and the green arrow the recombined (Δ) allele. (C) PCR genotyping of tail samples from control and GLS1 iHET mice pre- and post-Tmx. Gels from two mice of each genotype are shown, with mouse identification numbers. Band sizes are shown to the right of the gels. (C1) Gel electrophoresis (left) showed both floxed and WT DNA bands (with Primers A,C) prior to Tmx (Pre-Tmx) administration in GLS1 iHET and Control mice, whereas post-Tmx (right), the floxed DNA band remained in Control (GLS1lox∕+) mice, but was eliminated in GLS1 iHET mice. (C2) Gel electrophoresis with Primers X, C identified the presence of a Δ allele in GLS1 iHET mice prior to Tmx treatment, revealing “leaky” cre-mediated recombination.
Figure 3
Figure 3
Induction of GLS1 deficiency in the brain. (A) GLS1 allelic abundance. Wild type (WT) and floxGLS1 (Floxed) allelic abundance in one hippocampus is plotted with respect to the allelic abundance in Control, Tmx-naïve (No-Tmx) mice. In Tmx-naïve GLS1 iHET mice, the floxed allele abundance was 0.54, while in Tmx-treated GLS1 iHET mice this went down to 0.12. The percent reduction in functional allelic abundance is indicated on the bars. (B) Relative GLS1 mRNA expression. (B1) In Tmx-naïve mice (No-Tmx), there was no genotypic difference in GLS1 mRNA expression in the hippocampus, while in Tmx-treated mice, there was a significant main effect of genotype at both time points after Tmx injection (21 days and 148 days). **indicates p < 0.001 *indicates p < 0.05. (B2) mRNA values for the hippocampus (Hipp) in GLS1 iHET mice were expressed as the percentage of control values for each condition (dashed line). There was no reduction in Tmx-naïve mice, whereas in Tmx-treated mice relative mRNA expression was reduced at both 21 and 148 days post-Tmx. *statistically different from No-Tmx GLS1 iHET mice, p < 0.05. The relative mRNA values for the frontal cortex (FC) of Tmx-treated mice (dark gray bars) also showed a similar reduction, to 50 and 74%, 21 and 148 days post-Tmx, respectively.
Figure 4
Figure 4
Attenuation of amphetamine-induced hyperlocomotion in Tmx-Treated GLS1 iHet mice. (A) Amphetamine-induced locomotion. Tmx-naïve (No-Tmx) mice prior to and after amphetamine (AMPH) injection showed no genotypic difference in locomotion in the open field. (B) Locomotion before and after amphetamine for Tmx-treated mice. (B1) Tmx-Treated mice showed a marked genotypic difference in amphetamine-induced hyperlocomotion, 30 days post-Tmx. Factorial ANOVA revealed a significant genotype × time effect of amphetamine (p < 0.05), but no difference prior to amphetamine. (B2) The reduction in amphetamine-induced hyperlocomotion persisted 146 days post-Tmx. (C) Total locomotion after amphetamine injection. (C1) Tmx-naïve (No-Tmx) mice showed no genotypic difference in their overall response to amphetamine, whereas Tmx-Treated control mice differed significantly from GLS1 iHET mice 30 days post-Tmx (left graph). *indicates a significant genotypic difference, p < 0.05. The amphetamine-induced locomotion of Tmx-Treated mice did not change 146 days post-Tmx treatment. ##indicates a main effect of genotype, p < 0.001; but no main effect of time or significant interaction. (C2) AMPH-induced hyperlocomotion expressed as an increase in locomotion above baseline. Tmx-Treated GLS1 iHET mice showed a minimal response to amphetamine at 30 days post-Tmx (5% increase in locomotion in response to AMPH), and a modest response at 146 days (25%).
Figure 5
Figure 5
Genetic pharmacotherapy for glutaminase inhibition. The relative timing and magnitude of DNA, RNA, and behavioral effects are schematized prior to and after Tmx treatment. Black dotted line shows extrapolated DNA levels. Prior to Tmx, there was significant leaky recombination, but this did not impact GLS1 mRNA levels or behavior (amphetamine-induced locomotion). After Tmx, there was full recombination. At short and long-time points post-Tmx, both mRNA levels and amphetamine-induced hyperlocomotion showed the maximum effect at the short-time point. As in constitutive GLS1 Hets, amphetamine-induced hyperlocomotion was blocked at the short-time point, and strongly attenuated at the long-time point.

Similar articles

Cited by

References

    1. Adams D. H., Zhang L., Millen B. A., Kinon B. J., Gomez J. C. (2014). Pomaglumetad methionil (LY2140023 monohydrate) and aripiprazole in patients with schizophrenia: a phase 3, multicenter, double-blind comparison. Schizophr. Res. Treatment 2014:758212. 10.1155/2014/758212 - DOI - PMC - PubMed
    1. Albrecht J., Sidoryk-Wegrzynowicz M., Zielinska M., Aschner M. (2010). Roles of glutamine in neurotransmission. Neuron Glia Biol. 6, 263–276. 10.1017/S1740925X11000093 - DOI - PubMed
    1. Arguello P. A., Gogos J. A. (2006). Modeling madness in mice: one piece at a time. Neuron 52, 179–196. 10.1016/j.neuron.2006.09.023 - DOI - PubMed
    1. Brundtland G. H. (2001). From the World Health Organization. Mental health: new understanding, new hope. JAMA 286:2391. 10.1001/jama.286.19.2391 - DOI - PubMed
    1. Buchanan C. M., Buchanan N. L., Edgar K. J., Lambert J. L., Posey-Dowty J. D., Ramsey M. G., et al. . (2006). Solubilization and dissolution of tamoxifen-hydroxybutenyl cyclodextrin complexes. J. Pharmacol. Sci. 95, 2246–2255. 10.1002/jps.20710 - DOI - PubMed

LinkOut - more resources