. 2016 Jan 6:9:352.
doi: 10.3389/fnbeh.2015.00352. eCollection 2015.

Relationship Between L-DOPA-Induced Reduction in Motor and Exploratory Activity and Striatal Dopamine D2 Receptor Binding in the Rat

Affiliations

Relationship Between L-DOPA-Induced Reduction in Motor and Exploratory Activity and Striatal Dopamine D2 Receptor Binding in the Rat

Susanne Nikolaus et al. Front Behav Neurosci. .

Erratum in

Abstract

Purpose: The present study assessed the influence of L-DOPA administration on neostriatal dopamine (DA) D2 receptor binding in relation to motor and exploratory behaviors in the rat.

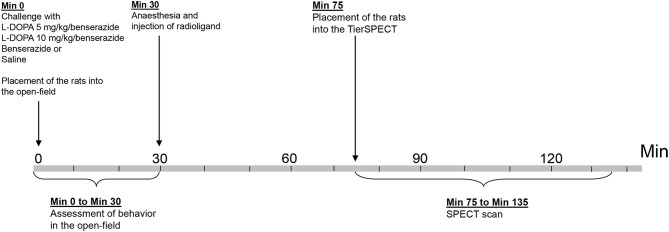
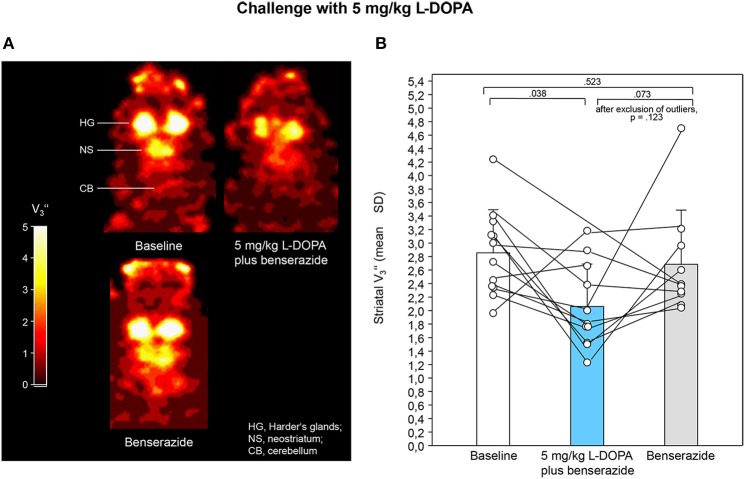
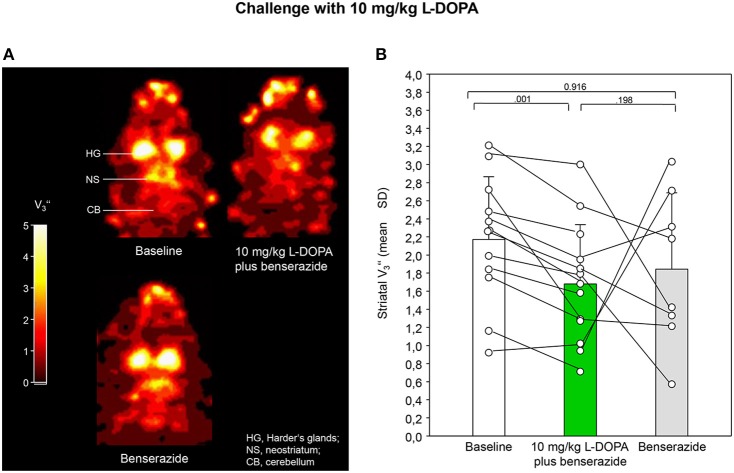
Methods: D2 receptor binding was measured in baseline, after challenge with the aromatic L-amino acid decarboxylase inhibitor benserazide, and after challenge with either 5 or 10 mg/kg L-DOPA plus benserazide. Additional rats received injections of saline. For baseline and challenges, striatal equilibrium ratios (V[Formula: see text]) were computed as estimation of the binding potential. Motor and exploratory behaviors were assessed for 30 min in an open field prior to administration of [(123)I]IBZM. D2 receptor binding was measured with small animal SPECT 2 h after radioligand administration for 60 min.

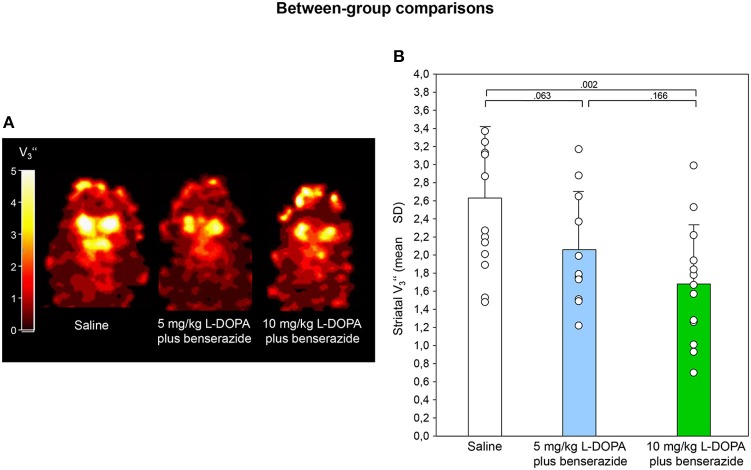
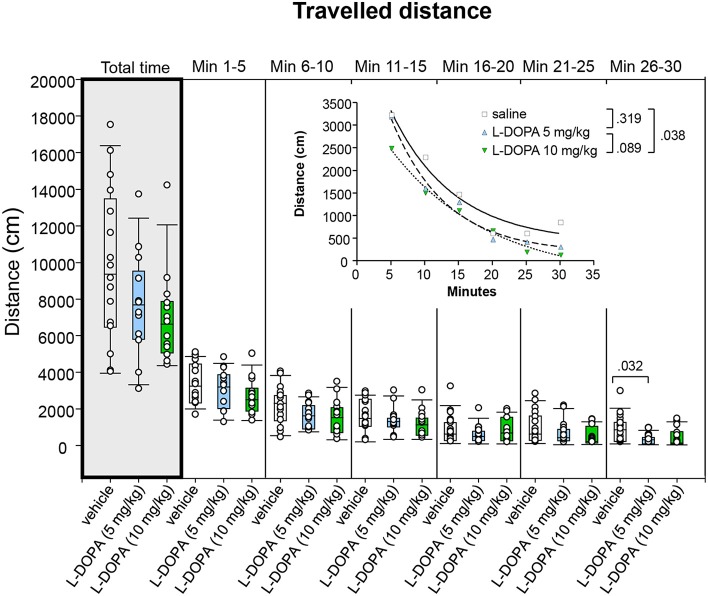
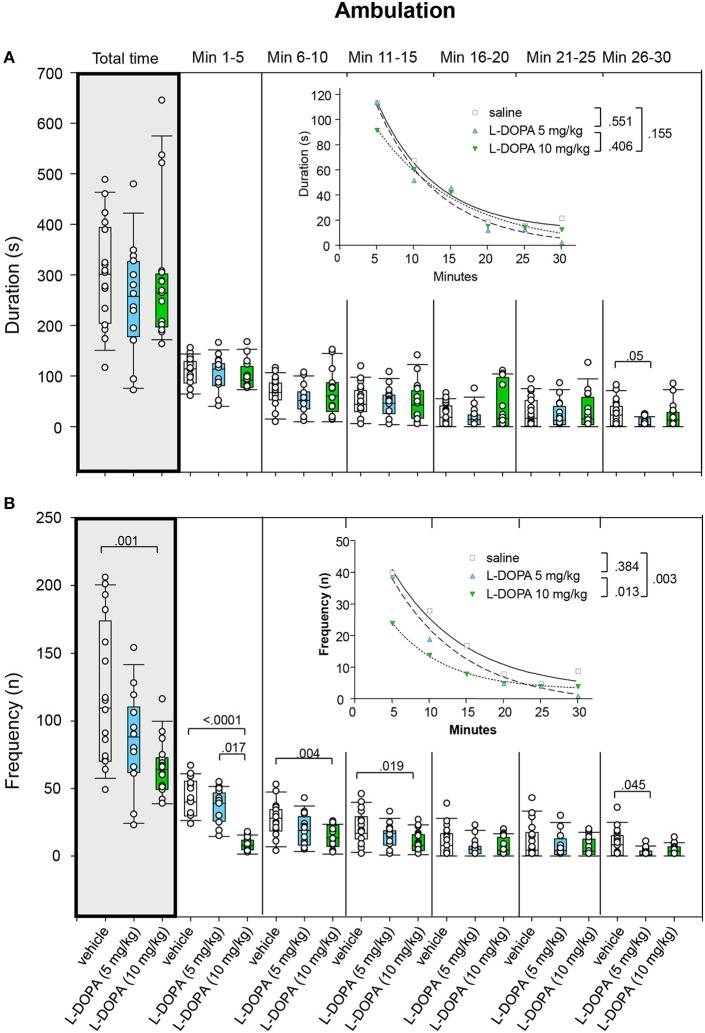
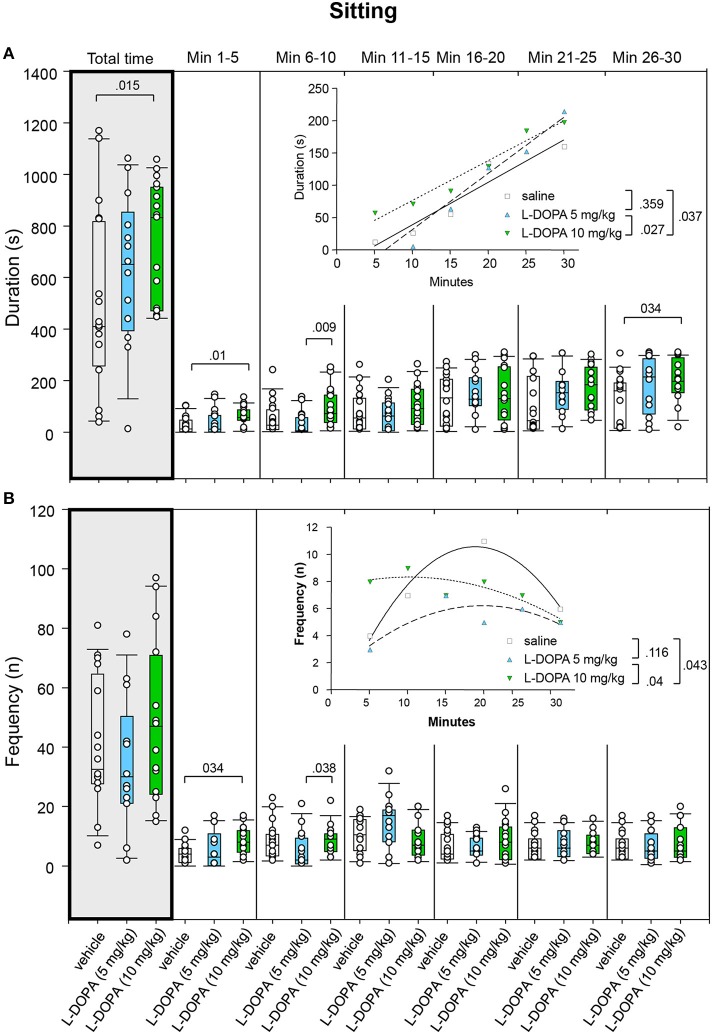
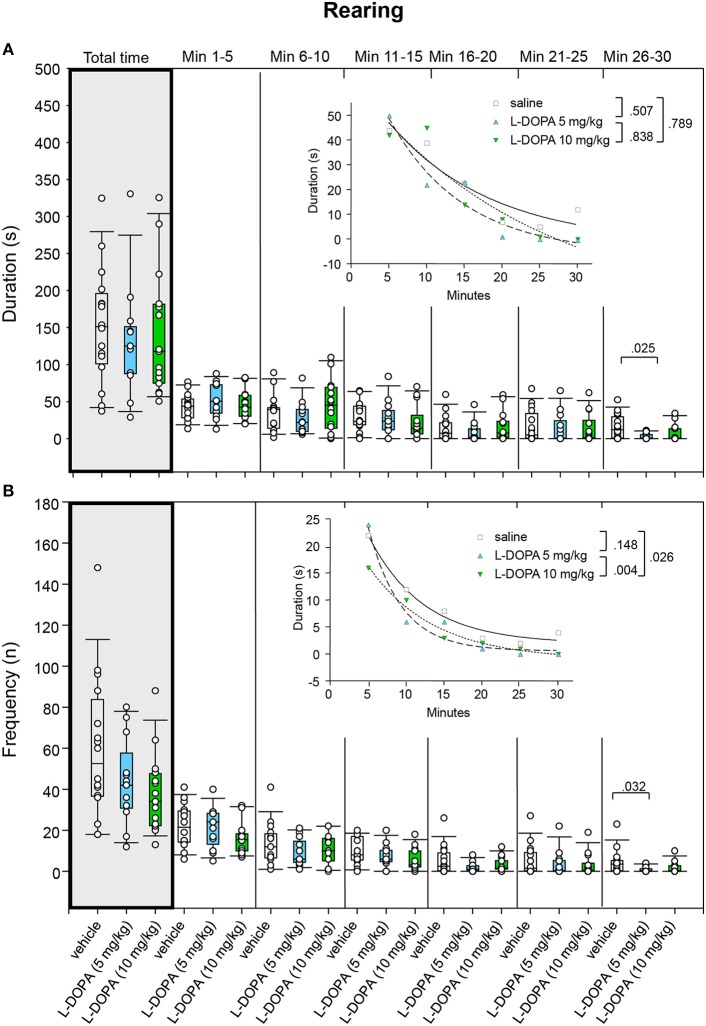
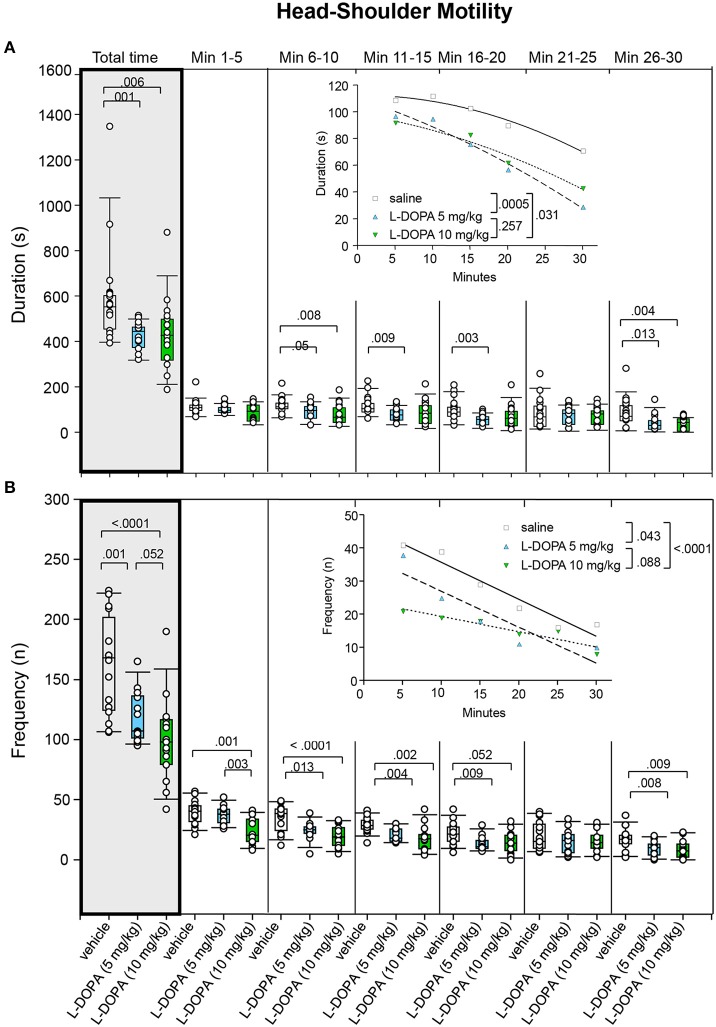
Results: Both L-DOPA doses significantly reduced D2 receptor binding relative to baseline and led to significantly less ambulation, less head-shoulder motility, and more sitting relative to saline. Moreover, 10 mg/kg L-DOPA induced less head-shoulder motility, more sitting, and more grooming than 5 mg/kg L-DOPA. Analysis of time-behavior curves showed that L-DOPA-treated animals relative to saline exhibited a faster rate of decrease of ambulation frequency and a slower rate of decrease of both duration and frequency of head-shoulder motility from a lower maximum level.

Conclusions: The reductions of striatal D2 receptor binding after L-DOPA may be conceived to reflect elevated concentrations of synaptic DA. L-DOPA-treated animals showed less ambulation and less head-shoulder motility than saline-treated animals, indicating an association between less behavioral activity and increased availability of striatal DA. The faster rate of decrease of ambulation frequency and the lower maximum levels of both head-shoulder motility duration and frequency may be interpreted in terms of influence of increased DA availability on behavioral habituation to a novel environment.

Keywords: D2 receptor; L-DOPA methylester; [123I]IBZM; exploratory behavior; habituation; motor behavior; small animal SPECT; time-behavior curves.


Figures

Figure 1
Figure 1
Timeline of experimental procedure.
Figure 2
Figure 2
(A) Coronal [123I]IBZM images of the samt rat in baseline and after challenge with 5 mg/kg L-DOPA/benserazide and benserazide alone. All images show V3-values; it is understood, that the calculation of V3 is only valid for regions with specific radioligand binding such as the rat striatum. Calculations were performed using PMOD (version 3.5, PMOD Technologies Ltd., Zürich, Switzerland). (B) Striatal equilibrium ratios (V3) in baseline and after challenge with 5 mg/kg L-DOPA/benserazide and benserazide alone. Rendered are means and standard deviations of the means. The circles represent the individual animals. For significant differences between conditions the respective p-values are given (two-tailed paired t-test, α = 0.0167 after Bonferroni correction). If the outlier in the benserazide condition (Figure 2B) was excluded, comparison of 5 mg/kg L-DOPA/benserazide and benserazide yielded a p of 0.123.
Figure 3
Figure 3
(A) Coronal [123I]IBZM images of the samt rat in baseline and after challenge with 10 mg/kg L-DOPA/benserazide and benserazide alone. All images show V3-values; it is understood, that the calculation of V3 is only valid for regions with specific radioligand binding such as the rat striatum. Calculations were performed using PMOD (version 3.5, PMOD Technologies Ltd., Zürich, Switzerland). (B) Striatal equilibrium ratios (V3) in baseline and after challenge with 10 mg/kg L-DOPA/benserazide and benserazide alone. Rendered are means and standard deviations of the means. The circles represent the individual animals. For significant differences between conditions the respective p-values are given (two-tailed paired t-test, α = 0.0167 after Bonferroni correction).
Figure 4
Figure 4
(A) Coronal [123I]IBZM images of different rats after challenge with saline, 5 and 10 mg/kg L-DOPA/benserazide. All images show V3 values; it is understood, that the calculation of V3 is only valid for regions with specific radioligand binding such as the rat striatum. Calculations were performed using PMOD (version 3.5, PMOD Technologies Ltd., Zürich, Switzerland). (B) Striatal equilibrium ratios (V3) after challenge with saline, 5 and 10 mg/kg L-DOPA/benserazide. Rendered are means and standard deviations of the means. The circles represent the individual animals. For significant between-group differences the respective p-values are given (two-tailed independent t-test, α = 0.0167 after Bonferroni correction).
Figure 5
Figure 5
Traveled distance (cm) after vehicle (0.9% saline), 5 and 10 mg/kg L-DOPA. The figure shows box and whisker plots of median distances traveled during the whole time of testing (gray shade) and in the individual 5-min time bins. 25-/75-percentiles are given in the boxes, while 5-/95-percentiles are represented by the whiskers. The circles represent the individual animals. For significant between-group differences the respective p-values are given (two-tailed Mann–Whitney U-test, α = 0.0167 after Bonferroni correction). Inset: t–b Curves obtained by plotting median values of traveled distances against time and fitting exponential functions [y(t) = a * exp (−K * x) + plateau with a, value at the time t; -K, rate constant; t, time] to these data. For the comparisons between groups (two-tailed F-test, α = 0.0167 after Bonferroni correction) the respective p-values are given).
Figure 6
Figure 6
Ambulation. (A) Duration (s) and (B) frequency (n) after vehicle (0.9% saline), 5 and 10 mg/kg L-DOPA. The figure shows box and whisker plots of median ambulation durations and frequencies during the whole time of testing (gray shade) and in the individual 5-min time bins. 25-/75-percentiles are given in the boxes, while 5-/95-percentiles are represented by the whiskers. The circles represent the individual animals. For significant between-group differences the respective p-values are given (two-tailed Mann–Whitney U-test, α = 0.0167 after Bonferroni correction). Insets: t–b Curves obtained by plotting median values of ambulation durations (A) and ambulation frequencies (B) against time and fitting exponential functions [y(t) = a * exp (−K * x) + plateau with a, value at the time t; -K, rate constant; t, time] to these data. For the comparisons between treatment groups (two-tailed F-test, α = 0.0167 after Bonferroni correction) the respective p-values are given.
Figure 7
Figure 7
Sitting. (A) Duration (s) and (B) frequency (n) after vehicle (0.9% saline), 5 and 10 mg/kg L-DOPA. The figure shows box and whisker plots of median sitting durations and frequencies during the whole time of testing (gray shade) and in the individual 5-min time bins. 25-/75-percentiles are given in the boxes, while 5-/95-percentiles are represented by the whiskers. The circles represent the individual animals. For significant between-group differences the respective p-values are given (two-tailed Mann–Whitney U-test, α = 0.0167 after Bonferroni correction). Insets: t–b Curves obtained by plotting median values of sitting durations (A) and sitting frequencies (B) against time. Linear functions (y = ax + b with a, slope and b, y-intercept) were fitted to the plots of sitting durations, whereas quadratic functions (y = a + bx + cx2 with a, absolute term; bx, linear term; cx2, quadratic term) were fitted to the plots of sitting frequencies. For the comparisons between treatment groups (two-tailed F-test, α = 0.0167 after Bonferroni correction) the respective p-values are given.
Figure 8
Figure 8
Rearing. (A) Duration (s) and (B) frequency (n) after vehicle (0.9% saline), 5 and 10 mg/kg L-DOPA. The figure shows box and whisker plots of median rearing durations and frequencies during the whole time of testing (gray shade) and in the individual 5-min time bins. 25-/75-percentiles are given in the boxes, while 5-/95-percentiles are represented by the whiskers. The circles represent the individual animals. For significant between-group differences the respective p-values are given (two-tailed Mann–Whitney U-test, α = 0.0167 after Bonferroni correction). Insets: t–b Curves obtained by plotting median values of rearing durations (A) and rearing frequencies (B) against time and fitting exponential functions [y(t) = a * exp (−K * x) + plateau with a, value at the time t; -K, rate constant; t, time] to these data. For the comparisons between treatment groups (two-tailed F-test, α = 0.0167 after Bonferroni correction) the respective p-values are given.
Figure 9
Figure 9
Head-shoulder motility. (A) Duration (s) and (B) frequency (n) after vehicle (0.9% saline), 5 and 10 mg/kg L-DOPA. The figure shows box and whisker plots of median durations and frequencies of head-shoulder motility during the whole time of testing (gray shade) and in the individual 5-min time bins. 5-/75-percentiles are given in the boxes, while 5-/95-percentiles are represented by the whiskers. The circles represent the individual animals. For significant between-group differences the respective p-values are given (two-tailed Mann–Whitney U-test, α = 0.0167 after Bonferroni correction). Insets: t–b Curves obtained by plotting median values of motility durations (A) and frequencies (B) against time. Quadratic functions (y = a + bx + cx2 with a, absolute term; bx, linear term; cx2, quadratic term) were fitted to the plots of motility durations, while linear functions (y = ax + b with a, slope and b, y-intercept) were fitted to the plots of motility frequencies. For the comparisons between grousp (two-tailed F-test, α = 0.0167 after Bonferroni correction) the respective p-values are given.

References

    1. Aspide R., Gironi Carnevale U. A., Sergeant J. A., Sadile A. G. (1998). Non-selective attention and nitric oxide in putative animal models of attention-deficit hyperactivity disorder. Behav. Brain Res. 95, 123–133. 10.1016/S0166-4328(97)00217-9 - DOI - PubMed
    1. Boissier J. R., Simon P. (1966). [On the potentiation of DOPA effects by monoamine oxidase inhibitors]. Psychopharmacologia 8, 428–436. - PubMed
    1. Bryson G., Bischoff F. (1971). A scatter-jump syndrome with gnawing and fighting induced by L-dopa in mice. Res. Commun. Chem. Pathol. Pharmacol. 2, 469–476. - PubMed
    1. Carey R. J., Dai H., Gui J. (1998). Effects of dizocilpine (MK-801) on motor activity and memory. Psychopharmacology (Berl) 137, 241–246. 10.1007/s002130050616 - DOI - PubMed
    1. Cenci M. A., Ohlin K. E., Odin P. (2011). Current options and future possibilities for the treatment of dyskinesia and motor fluctuations in Parkinson's disease. CNS Neurol. Disord. Drug Targets 10, 670–684. 10.2174/187152711797247885 - DOI - PubMed

LinkOut - more resources