

Inflammatory Biomarkers Associated with Lethal Rift Valley Fever Encephalitis in the Lewis Rat Model
- PMID: 26779164
- PMCID: PMC4703790
- DOI: 10.3389/fmicb.2015.01509
Inflammatory Biomarkers Associated with Lethal Rift Valley Fever Encephalitis in the Lewis Rat Model
Abstract
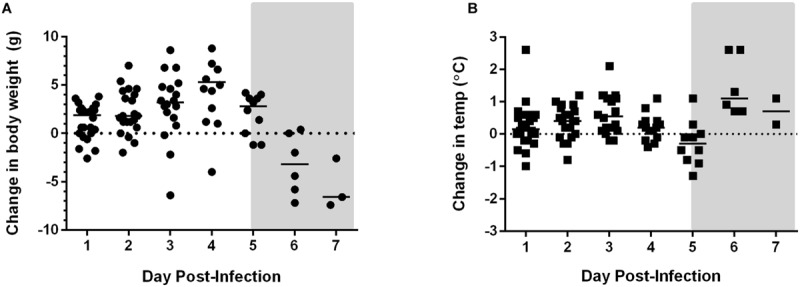
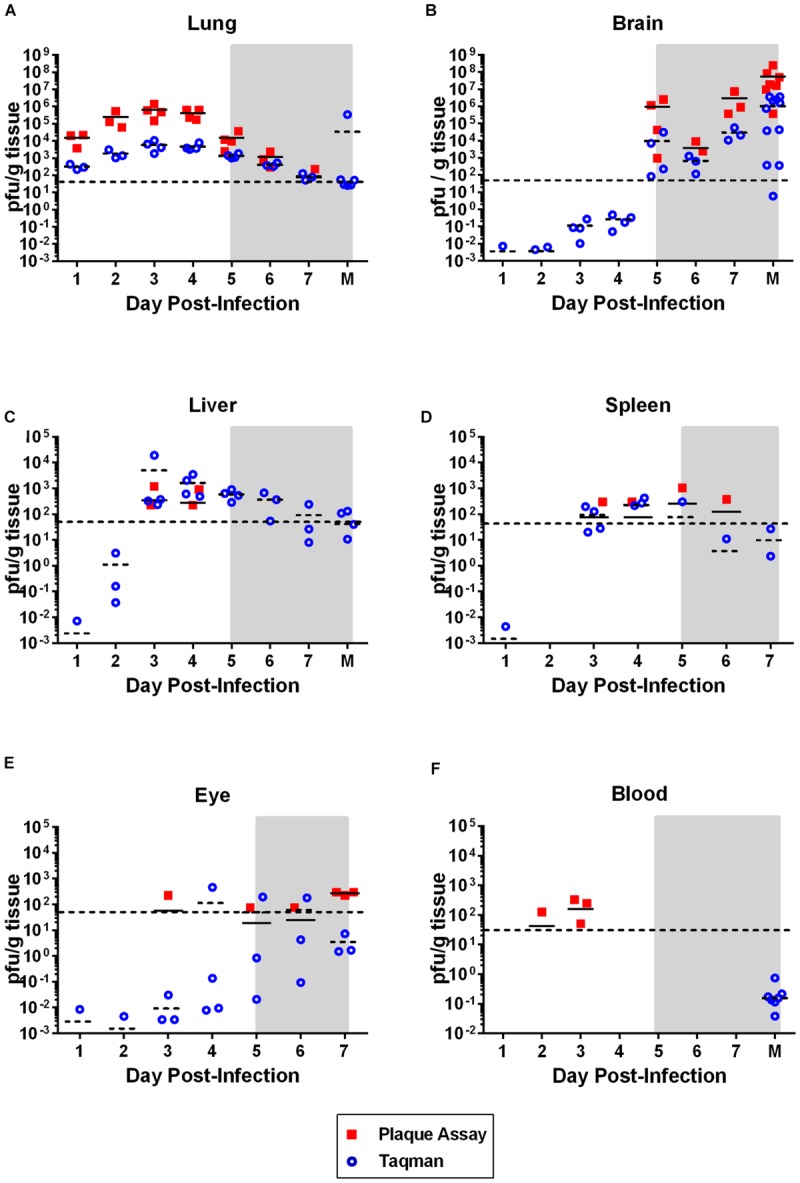
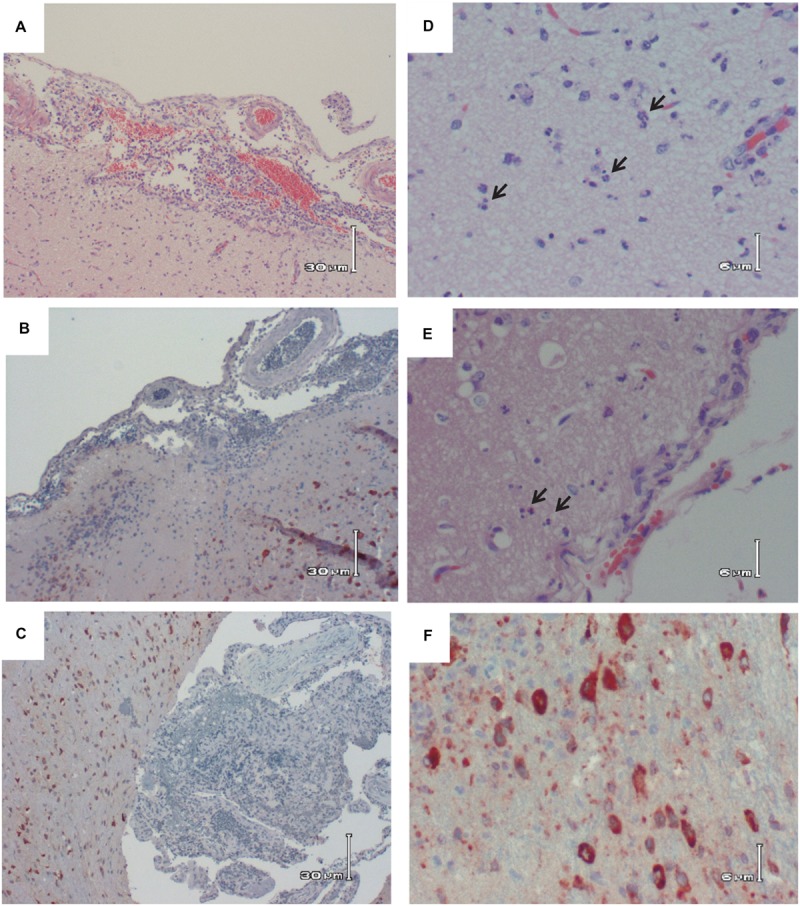
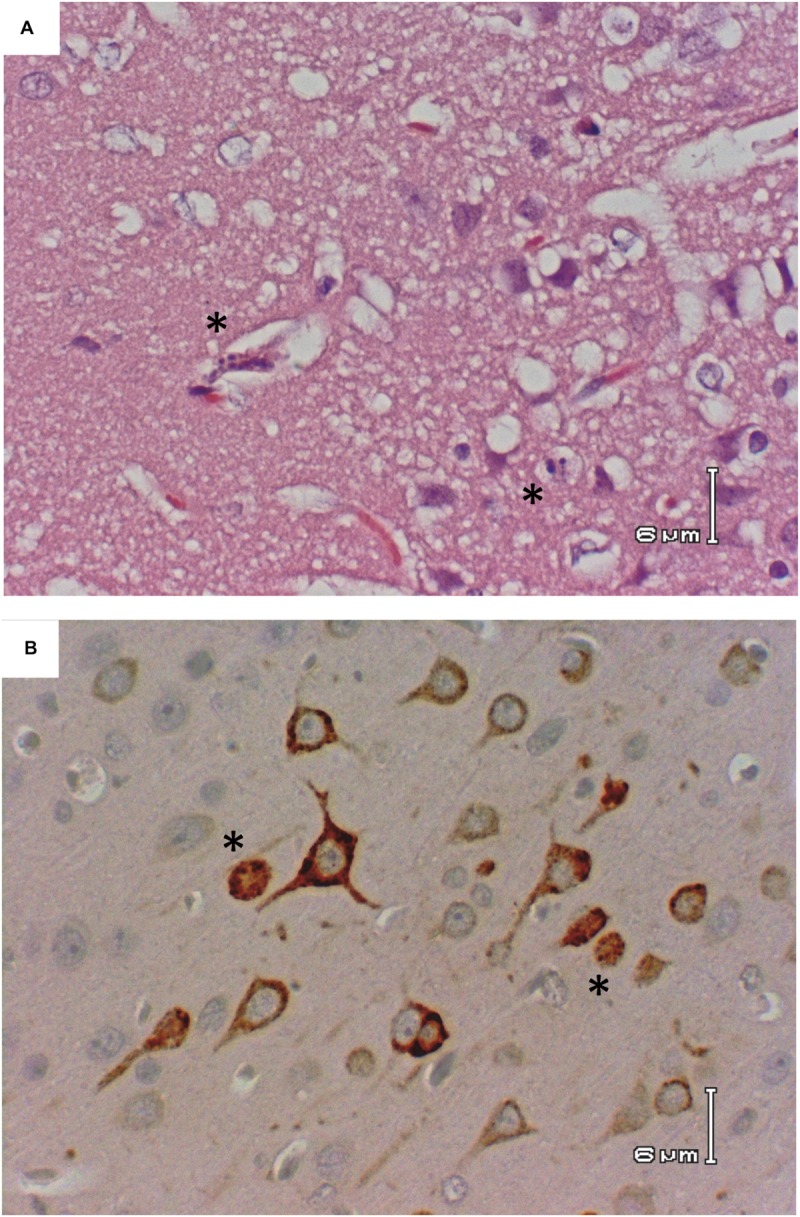
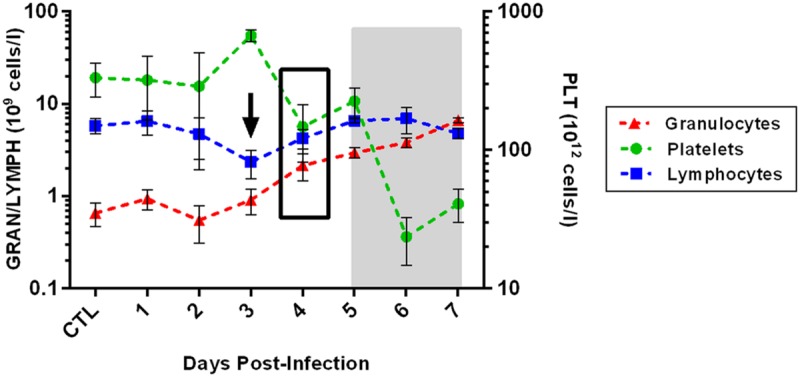
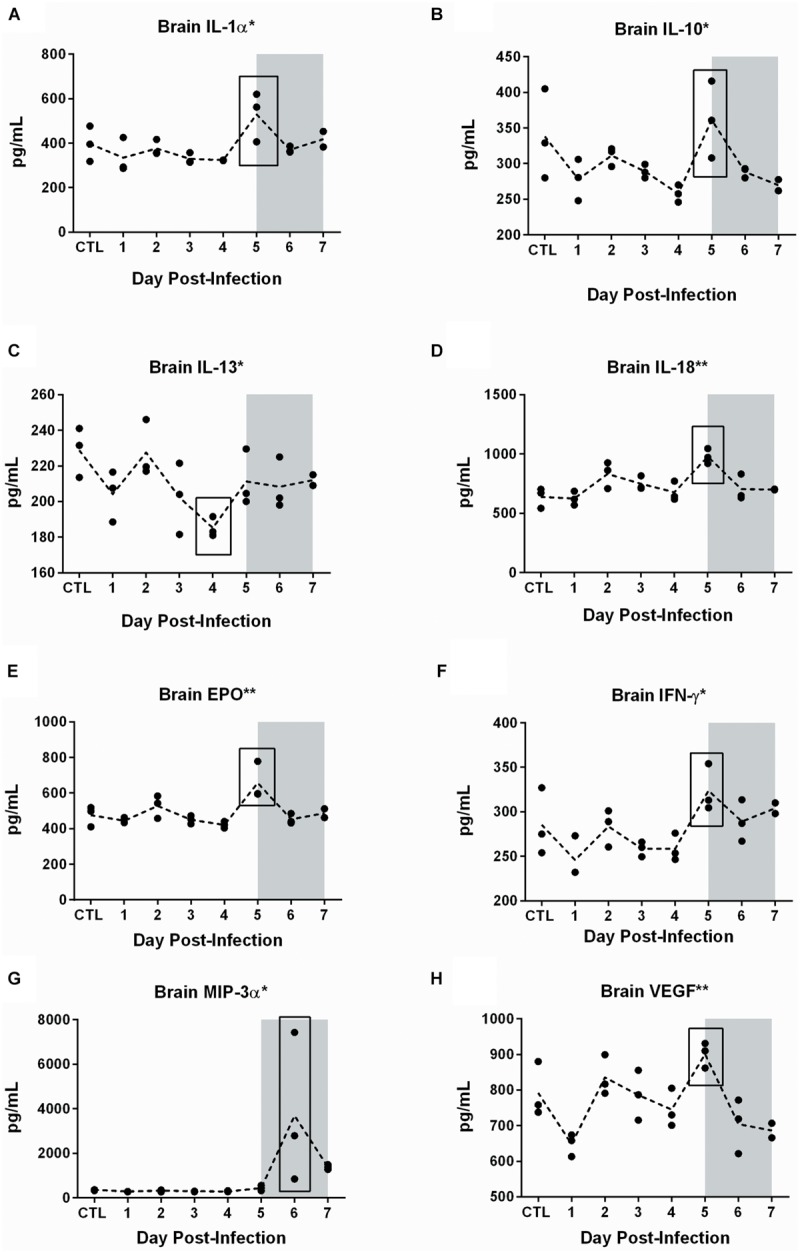
Rift Valley fever (RVF) is an emerging viral disease that causes significant human and veterinary illness in Africa and the Arabian Peninsula. Encephalitis is one of the severe complications arising from RVF virus (RVFV) infection of people, and the pathogenesis of this form of RVF is completely unknown. We use a novel reproducible encephalitic disease model in rats to identify biomarkers of lethal infection. Lewis rats were infected with RVFV strain ZH501 by aerosol exposure, then sacrificed daily to determine the course of infection and evaluation of clinical, virological, and immunological parameters. Weight loss, fever, and clinical signs occurred during the last 1-2 days prior to death. Prior to onset of clinical indications of disease, rats displayed marked granulocytosis and thrombocytopenia. In addition, high levels of inflammatory chemokines (MCP-1, MCS-F, Gro/KC, RANTES, and IL-1β) were detected first in serum (3-5 dpi) followed by brain (5-7 dpi). The results of this study are consistent with clinical data from human RVF patients and validate Lewis rats as an appropriate small animal model for RVF encephalitis. The biomarkers we identified here will be useful in future studies evaluating the efficacy of novel vaccines and therapeutics.
Keywords: Rift Valley fever virus; aerosol exposure; neurological disease; respiratory infection; viral encephalitis.
Figures
Similar articles
-
Genetic diversity of collaborative cross mice enables identification of novel rift valley fever virus encephalitis model.PLoS Pathog. 2022 Jul 14;18(7):e1010649. doi: 10.1371/journal.ppat.1010649. eCollection 2022 Jul. PLoS Pathog. 2022. PMID: 35834486 Free PMC article.
-
Peripheral Blood Biomarkers of Disease Outcome in a Monkey Model of Rift Valley Fever Encephalitis.J Virol. 2018 Jan 17;92(3):e01662-17. doi: 10.1128/JVI.01662-17. Print 2018 Feb 1. J Virol. 2018. PMID: 29118127 Free PMC article.
-
Rift Valley fever virus lacking NSm proteins retains high virulence in vivo and may provide a model of human delayed onset neurologic disease.Virology. 2007 May 25;362(1):10-5. doi: 10.1016/j.virol.2007.01.046. Epub 2007 Apr 6. Virology. 2007. PMID: 17412386
-
Rift Valley fever vaccines: an overview of the safety and efficacy of the live-attenuated MP-12 vaccine candidate.Expert Rev Vaccines. 2017 Jun;16(6):601-611. doi: 10.1080/14760584.2017.1321482. Epub 2017 May 2. Expert Rev Vaccines. 2017. PMID: 28425834 Free PMC article. Review.
-
Single-cycle replicable Rift Valley fever virus mutants as safe vaccine candidates.Virus Res. 2016 May 2;216:55-65. doi: 10.1016/j.virusres.2015.05.012. Epub 2015 May 27. Virus Res. 2016. PMID: 26022573 Free PMC article. Review.
Cited by
-
Vascular permeability in the brain is a late pathogenic event during Rift Valley fever virus encephalitis in rats.Virology. 2019 Jan 2;526:173-179. doi: 10.1016/j.virol.2018.10.021. Epub 2018 Nov 2. Virology. 2019. PMID: 30396029 Free PMC article.
-
Lithium inhibits NF-κB nuclear translocation and modulate inflammation profiles in Rift valley fever virus-infected Raw 264.7 macrophages.Virol J. 2021 Jun 4;18(1):116. doi: 10.1186/s12985-021-01579-z. Virol J. 2021. PMID: 34088327 Free PMC article.
-
Recent advances in treatment and detection of Rift Valley fever virus: a comprehensive overview.Virus Genes. 2025 Aug;61(4):400-411. doi: 10.1007/s11262-025-02164-0. Epub 2025 May 10. Virus Genes. 2025. PMID: 40348846 Review.
-
Genetic diversity of collaborative cross mice enables identification of novel rift valley fever virus encephalitis model.PLoS Pathog. 2022 Jul 14;18(7):e1010649. doi: 10.1371/journal.ppat.1010649. eCollection 2022 Jul. PLoS Pathog. 2022. PMID: 35834486 Free PMC article.
-
The lipopeptide Pam3CSK4 inhibits Rift Valley fever virus infection and protects from encephalitis.PLoS Pathog. 2024 Jun 27;20(6):e1012343. doi: 10.1371/journal.ppat.1012343. eCollection 2024 Jun. PLoS Pathog. 2024. PMID: 38935789 Free PMC article.
References
LinkOut - more resources
Full Text Sources
Other Literature Sources
Research Materials
Miscellaneous