

The Phenotypic and Genetic Underpinnings of Flower Size in Polemoniaceae
- PMID: 26779209
- PMCID: PMC4700140
- DOI: 10.3389/fpls.2015.01144
The Phenotypic and Genetic Underpinnings of Flower Size in Polemoniaceae
Abstract
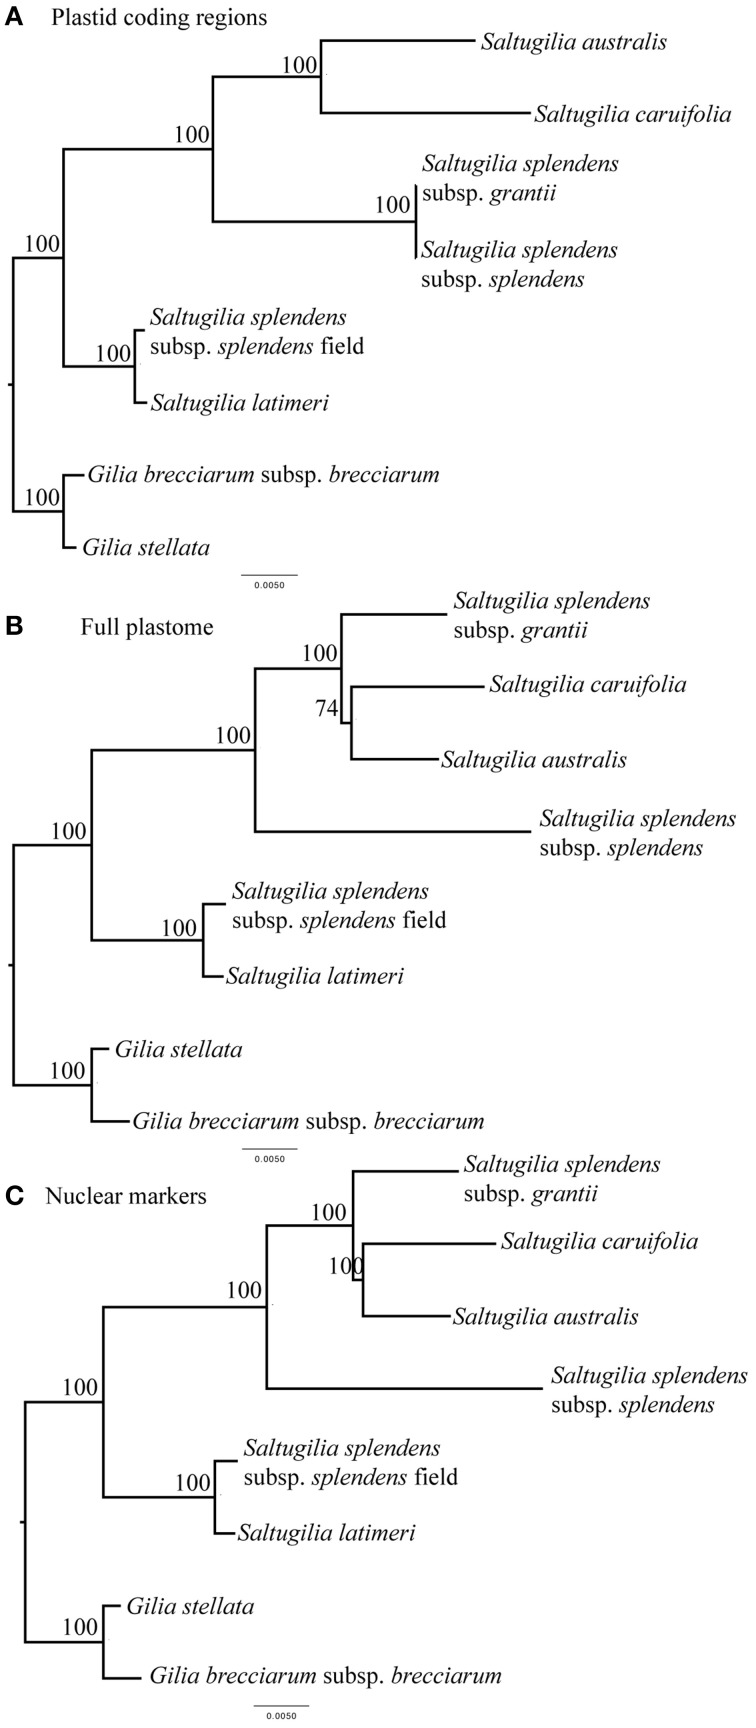
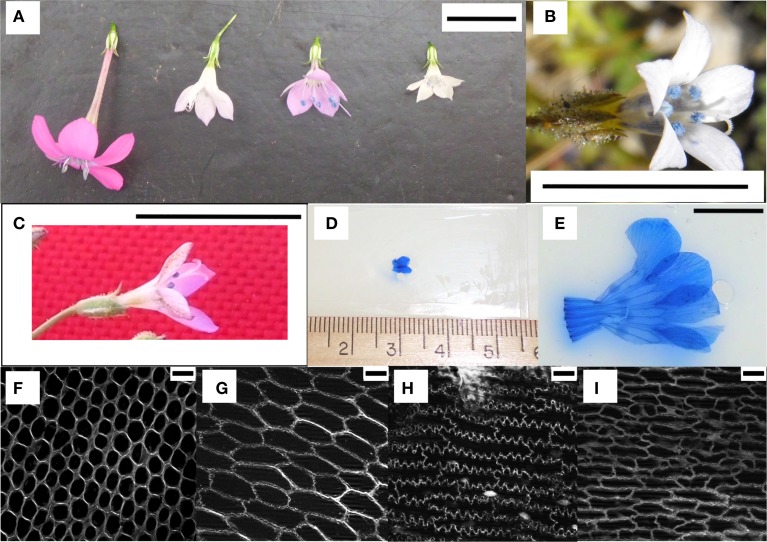
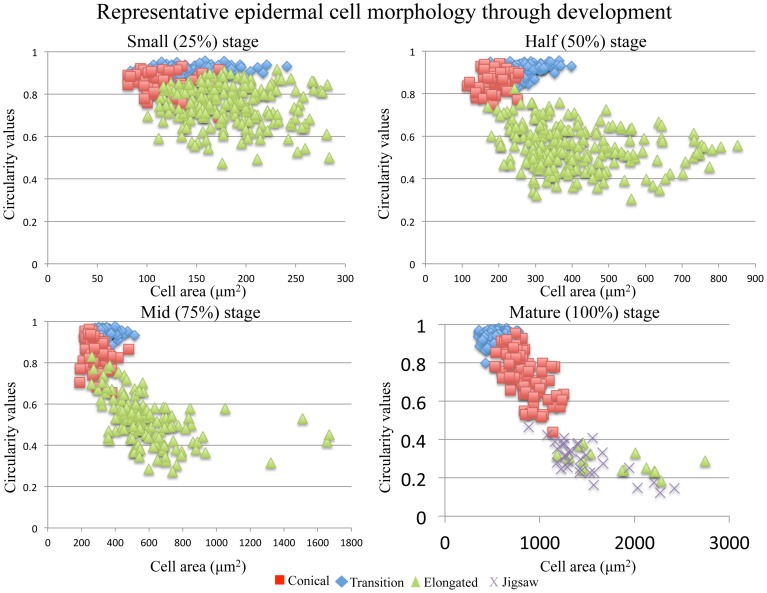
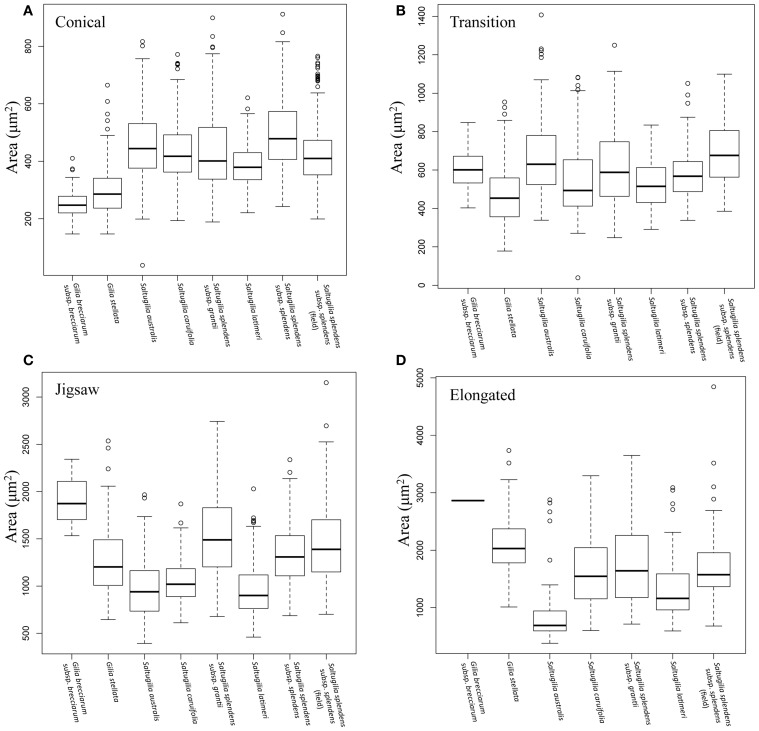
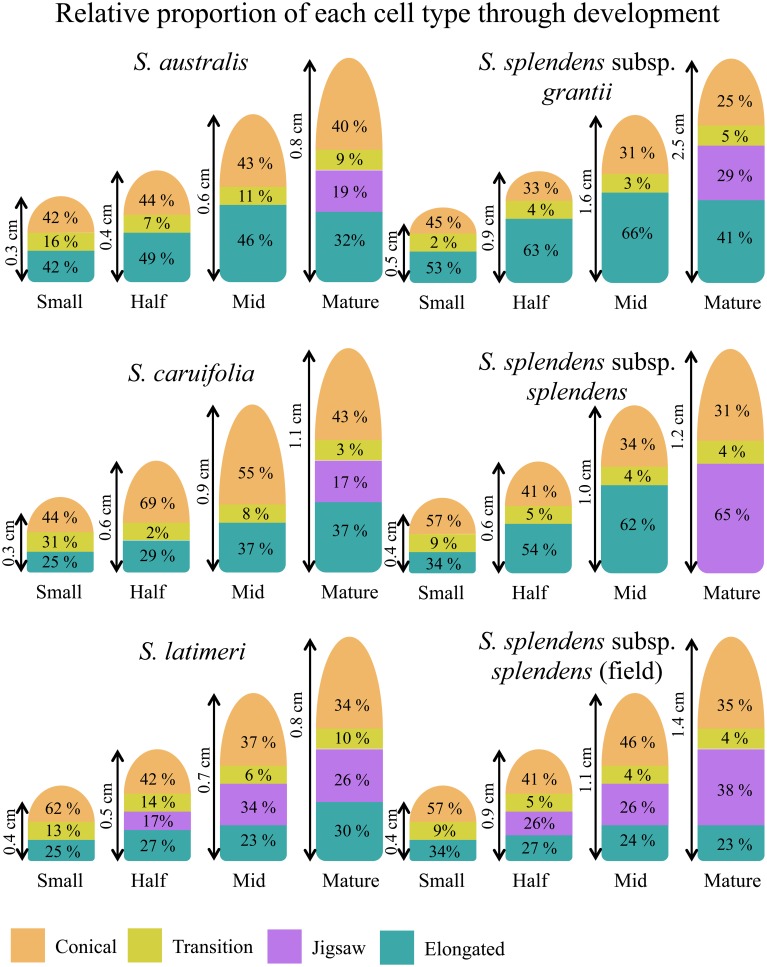
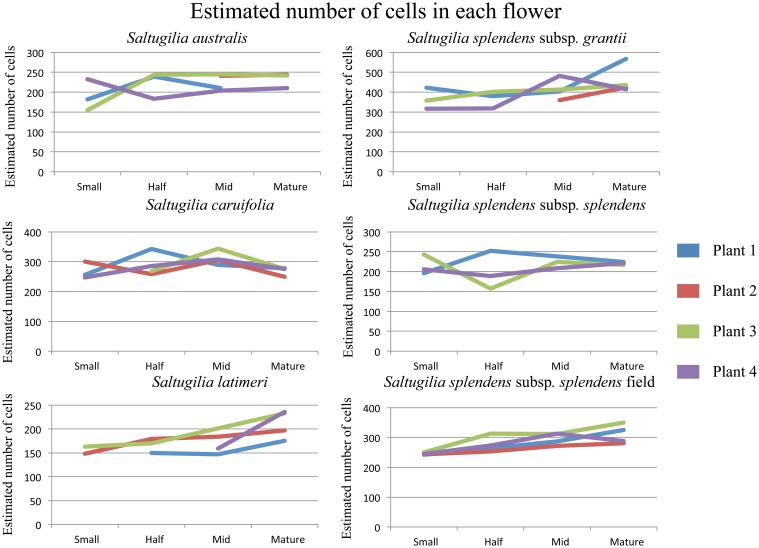
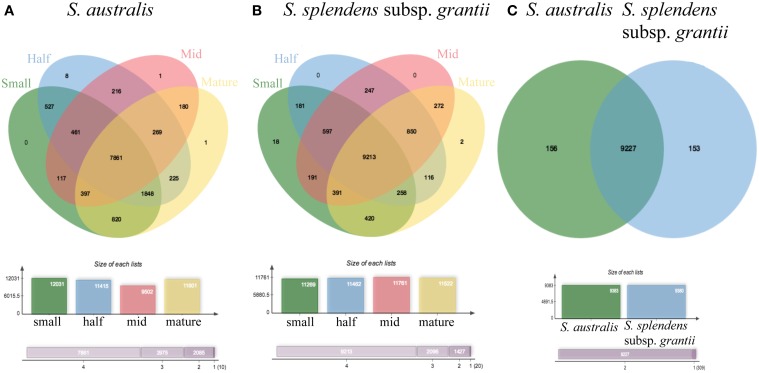
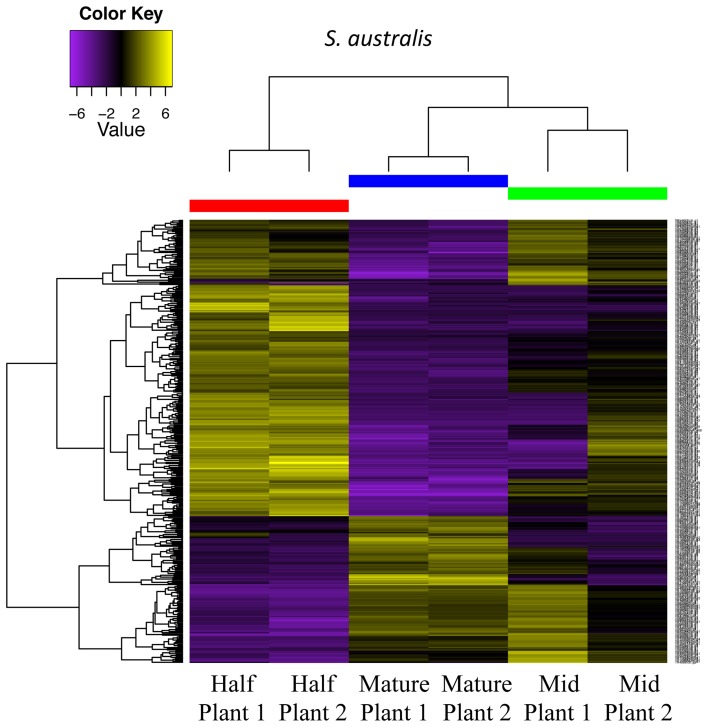
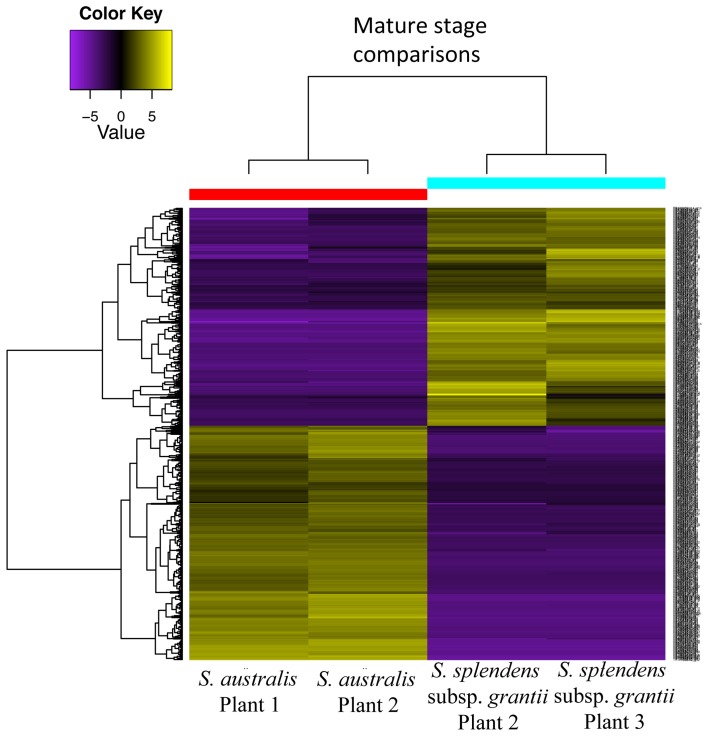
Corolla length is a labile flower feature and has strong implications for pollinator success. However, the phenotypic and genetic bases of corolla elongation are not well known, largely due to a lack of good candidate genes for potential genetic exploration and functional work. We investigate both the cellular phenotypic differences in corolla length, as well as the genetic control of this trait, in Saltugilia (Polemoniaceae). Taxa in this clade exhibit a large range of flower sizes and differ dramatically in pollinator guilds. Flowers of each species were collected from multiple individuals during four stages of flower development to ascertain if cell number or cell size is more important in determining flower size. In Saltugilia, increased flower size during development appears to be driven more by cell size than cell number. Differences in flower size between species are governed by both cell size and cell number, with the large-flowered S. splendens subsp. grantii having nearly twice as many cells as the small-flowered species. Fully mature flowers of all taxa contain jigsaw cells similar to cells seen in sepals and leaves; however, these cells are not typically found in the developing flowers of most species. The proportion of this cell type in mature flowers appears to have substantial implications, comprising 17-68% of the overall flower size. To identify candidate genes responsible for differences in cell area and cell type, transcriptomes were generated for two individuals of the species with the smallest (S. australis) and largest (S. splendens subsp. grantii) flowers across the same four developmental stages visualized with confocal microscopy. Analyses identified genes associated with cell wall formation that are up-regulated in the mature flower stage compared to mid-stage flowers (75% of mature size). This developmental change is associated with the origin of jigsaw cells in the corolla tube of mature flowers. Further comparisons between mature flowers in the two species revealed 354 transcripts that are up-regulated in the large-flowered S. splendens subsp. grantii compared to the small-flowered S. australis. These results are likely broadly applicable to Polemoniaceae, a clade of nearly 400 species, with extensive variation in floral form and shape.
Keywords: Polemoniaceae; Saltugilia; comparative transcriptomics; floral evo-devo; flower epidermal cells; phylogeny; pollinator-mediated selection.
Figures
Similar articles
-
Comparative transcriptomic analysis of the evolution and development of flower size in Saltugilia (Polemoniaceae).BMC Genomics. 2017 Jun 23;18(1):475. doi: 10.1186/s12864-017-3868-2. BMC Genomics. 2017. PMID: 28645249 Free PMC article.
-
Comparative analysis of corolla tube development across three closely related Mimulus species with different pollination syndromes.Evol Dev. 2021 May;23(3):244-255. doi: 10.1111/ede.12368. Epub 2021 Jan 7. Evol Dev. 2021. PMID: 33410592
-
Evolution of floral traits and impact of reproductive mode on diversification in the phlox family (Polemoniaceae).Mol Phylogenet Evol. 2018 Oct;127:878-890. doi: 10.1016/j.ympev.2018.06.035. Epub 2018 Jun 27. Mol Phylogenet Evol. 2018. PMID: 29958983
-
Reproductive assurance weakens pollinator-mediated selection on flower size in an annual mixed-mating species.Ann Bot. 2019 Jun 24;123(6):1067-1077. doi: 10.1093/aob/mcz014. Ann Bot. 2019. PMID: 30778517 Free PMC article.
-
Control of flower size.J Exp Bot. 2013 Apr;64(6):1427-37. doi: 10.1093/jxb/ert025. Epub 2013 Feb 11. J Exp Bot. 2013. PMID: 23404902 Review.
Cited by
-
Differential Gene Expression and Unbalanced Homeolog Expression Bias in 4 Million-Year-Old Allopolyploids of Nicotiana Section Repandae.Genome Biol Evol. 2025 Mar 6;17(3):evaf029. doi: 10.1093/gbe/evaf029. Genome Biol Evol. 2025. PMID: 39973064 Free PMC article.
-
Contrasting lengths of Pelargonium floral nectar tubes result from late differences in rate and duration of growth.Ann Bot. 2018 Mar 5;121(3):549-560. doi: 10.1093/aob/mcx171. Ann Bot. 2018. PMID: 29293992 Free PMC article.
-
Data-driven guidelines for phylogenomic analyses using SNP data.Appl Plant Sci. 2024 Aug 9;12(6):e11611. doi: 10.1002/aps3.11611. eCollection 2024 Nov-Dec. Appl Plant Sci. 2024. PMID: 39628540 Free PMC article.
-
The report of my death was an exaggeration: A review for researchers using microsatellites in the 21st century.Appl Plant Sci. 2016 Jun 16;4(6):apps.1600025. doi: 10.3732/apps.1600025. eCollection 2016 Jun. Appl Plant Sci. 2016. PMID: 27347456 Free PMC article.
-
Developmental mechanisms involved in the diversification of flowers.Nat Plants. 2019 Sep;5(9):917-923. doi: 10.1038/s41477-019-0498-5. Epub 2019 Sep 2. Nat Plants. 2019. PMID: 31477891 Review.
References
-
- Barrett S. C. H. (2008). Major evolutionary transitions in flowering plant reproduction: an overview. Intl. J. Plant Sci. 169, 1–5. 10.1086/522511 - DOI
LinkOut - more resources
Full Text Sources
Other Literature Sources
Molecular Biology Databases