

Development of Follicle-Stimulating Hormone Receptor Binding Probes to Image Ovarian Xenografts
- PMID: 26779384
- PMCID: PMC4712933
- DOI: 10.4172/2155-952X.1000198
Development of Follicle-Stimulating Hormone Receptor Binding Probes to Image Ovarian Xenografts
Abstract
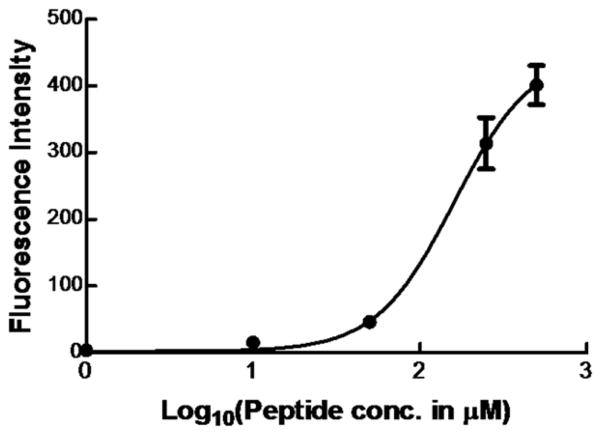
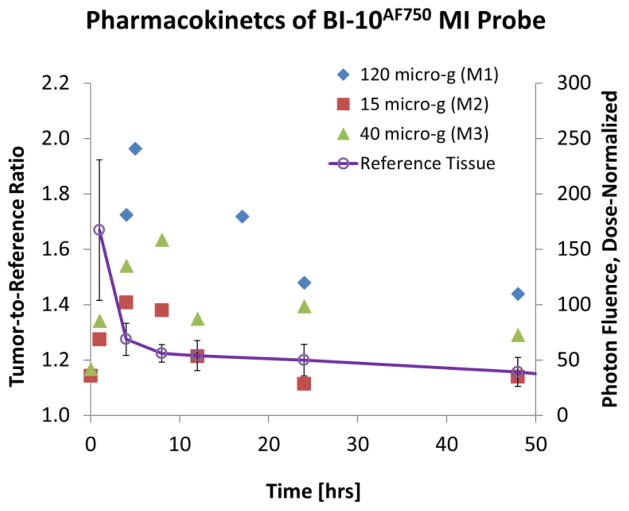
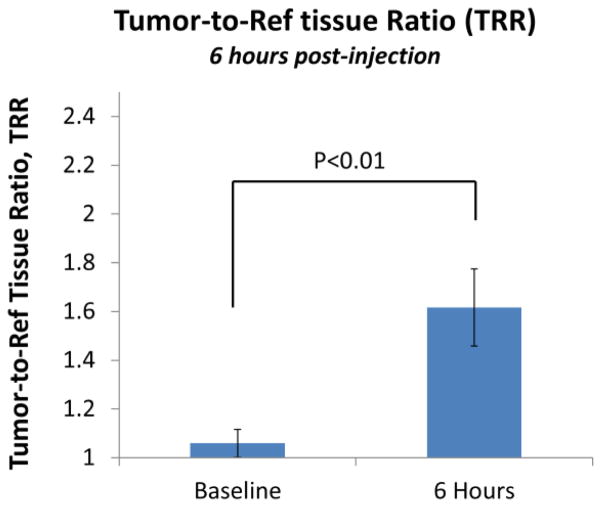
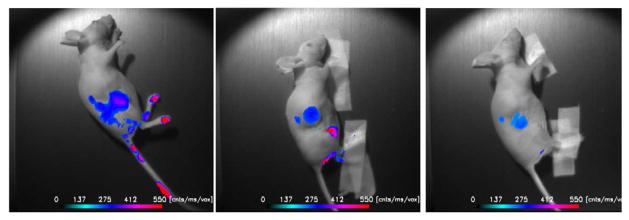
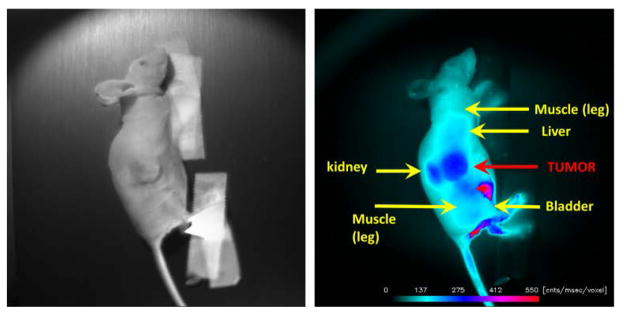
The Follicle-Stimulating Hormone Receptor (FSHR) is used as an imaging biomarker for the detection of ovarian cancer (OC). FSHR is highly expressed on ovarian tumors and involved with cancer development and metastatic signaling pathways. A decapeptide specific to the FSHR extracellular domain is synthesized and conjugated to fluorescent dyes to image OC cells in vitro and tumors xenograft model in vivo. The in vitro binding curve and the average number of FSHR per cell are obtained for OVCAR-3 cells by a high resolution flow cytometer. For the decapeptide, the measured EC50 was 160 μM and the average number of receptors per cell was 1.7 × 10⁷. The decapeptide molecular imaging probe reached a maximum tumor to muscle ratio five hours after intravenous injection and a dose-dependent plateau after 24-48 hours. These results indicate the potential application of a small molecular weight imaging probe specific to ovarian cancer through binding to FSHR. Based on these results, multimeric constructs are being developed to optimize binding to ovarian cells and tumors.
Keywords: Decapeptide; Follicle-stimulating hormone receptor; Multimeric peptide; Near-infrared imaging; Ovarian cancer.
Figures
Similar articles
-
Follicle-Stimulating Hormone Receptor Is Expressed by Most Ovarian Cancer Subtypes and Is a Safe and Effective Immunotherapeutic Target.Clin Cancer Res. 2017 Jan 15;23(2):441-453. doi: 10.1158/1078-0432.CCR-16-0492. Epub 2016 Jul 19. Clin Cancer Res. 2017. PMID: 27435394 Free PMC article.
-
Follicle-stimulating hormone polypeptide modified nanoparticle drug delivery system in the treatment of lymphatic metastasis during ovarian carcinoma therapy.Gynecol Oncol. 2014 Oct;135(1):125-32. doi: 10.1016/j.ygyno.2014.06.030. Epub 2014 Jul 5. Gynecol Oncol. 2014. PMID: 25003656
-
Ovarian epithelial tumor growth promotion by follicle-stimulating hormone and inhibition of the effect by luteinizing hormone.Gynecol Oncol. 2000 Jan;76(1):80-8. doi: 10.1006/gyno.1999.5628. Gynecol Oncol. 2000. PMID: 10620446
-
Expression Levels of Follicle-Stimulating Hormone Receptor and Implication in Diagnostic and Therapeutic Strategy of Ovarian Cancer.Oncol Res Treat. 2018;41(10):651-654. doi: 10.1159/000490810. Epub 2018 Aug 27. Oncol Res Treat. 2018. PMID: 30145593 Review.
-
Follicle stimulating hormone receptor (FSHR) antagonist and epithelial ovarian cancer (EOC).J Exp Ther Oncol. 2007;6(3):201-4. J Exp Ther Oncol. 2007. PMID: 17552360 Review.
Cited by
-
Follicle-Stimulating Hormone Receptor Expression and Its Potential Application for Theranostics in Subtypes of Ovarian Tumors: A Systematic Review.Cancers (Basel). 2024 Mar 13;16(6):1140. doi: 10.3390/cancers16061140. Cancers (Basel). 2024. PMID: 38539473 Free PMC article. Review.
-
Paradigms in Fluorescence Molecular Imaging: Maximizing Measurement of Biological Changes in Disease, Therapeutic Efficacy, and Toxicology/Safety.Mol Imaging Biol. 2019 Aug;21(4):599-611. doi: 10.1007/s11307-018-1273-0. Mol Imaging Biol. 2019. PMID: 30218390 Review.
-
Follicle-stimulating hormone peptide-conjugated nanoparticles for targeted shRNA delivery lead to effective gro-α silencing and antitumor activity against ovarian cancer.Drug Deliv. 2018 Nov;25(1):576-584. doi: 10.1080/10717544.2018.1440667. Epub 2018 Feb 20. Drug Deliv. 2018. PMID: 29461120 Free PMC article.
-
Fluorescent small-molecule agonists as follicle-stimulating hormone receptor imaging tools.RSC Chem Biol. 2020 Aug 3;1(4):263-272. doi: 10.1039/d0cb00068j. eCollection 2020 Oct 1. RSC Chem Biol. 2020. PMID: 34458765 Free PMC article.
-
PET Imaging of FSHR Expression in Tumors with 68Ga-Labeled FSH1 Peptide.Contrast Media Mol Imaging. 2017 Aug 23;2017:2674502. doi: 10.1155/2017/2674502. eCollection 2017. Contrast Media Mol Imaging. 2017. PMID: 29097913 Free PMC article.
References
-
- Jemal A, Siegel R, Ward E, Hao Y, Xu J, et al. Cancer statistics, 2008. CA Cancer J Clin. 2008;58:71–96. - PubMed
-
- Auersperg N, Wong AS, Choi KC, Kang SK, Leung PC. Ovarian surface epithelium: Biology, endocrinology, and pathology. Endocr Rev. 2001;22:255–288. - PubMed
-
- Choi JH, Wong AS, Huang HF, Leung PC. Gonadotropins and ovarian cancer. Endocr Rev. 2007;28:440–461. - PubMed
-
- Casagrande JT, Louie EW, Pike MC, Roy S, Ross RK, et al. “Incessant ovulation” and ovarian cancer. Lancet. 1979;2:170–173. - PubMed
-
- Fathalla MF. Incessant ovulation--a factor in ovarian neoplasia? Lancet. 1971;2:163. - PubMed
Grants and funding
LinkOut - more resources
Full Text Sources