. 2016 Mar;17(3):323-30.
doi: 10.1038/ni.3348. Epub 2016 Jan 18.

Blimp-1 controls plasma cell function through the regulation of immunoglobulin secretion and the unfolded protein response

Affiliations

Blimp-1 controls plasma cell function through the regulation of immunoglobulin secretion and the unfolded protein response

Julie Tellier et al. Nat Immunol. 2016 Mar.

Abstract

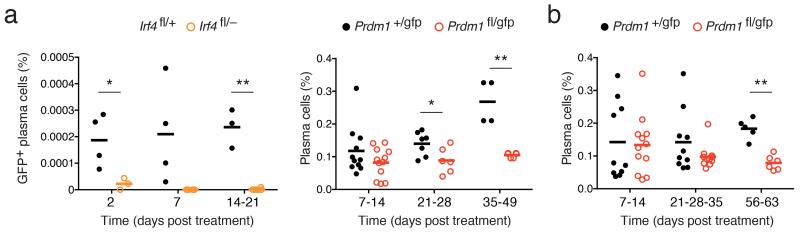
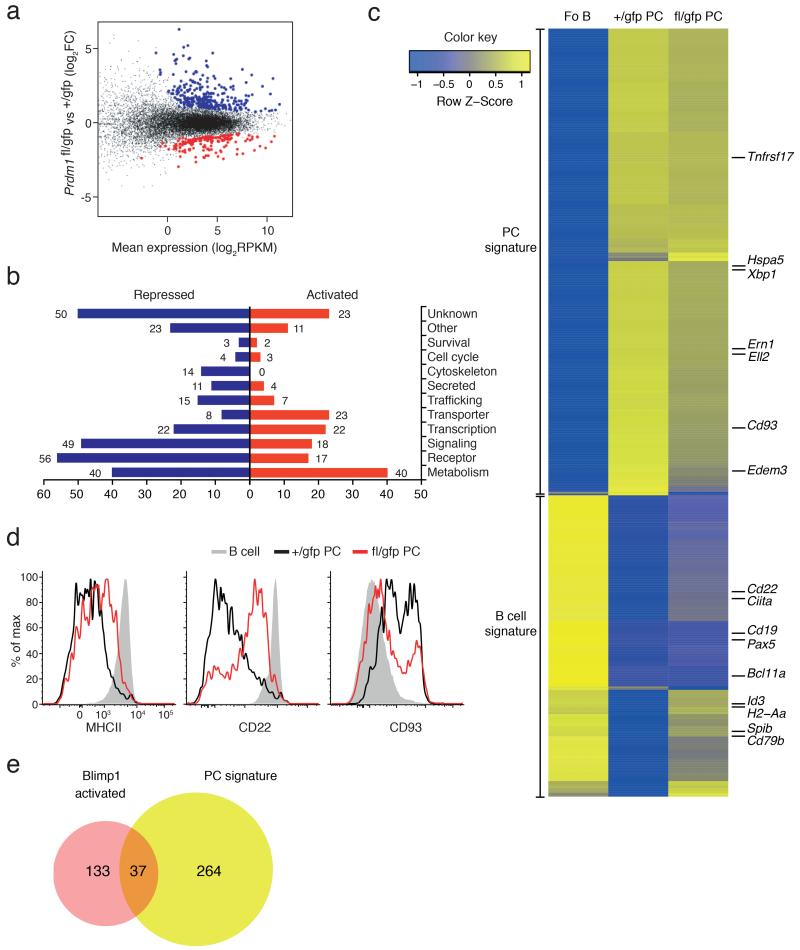
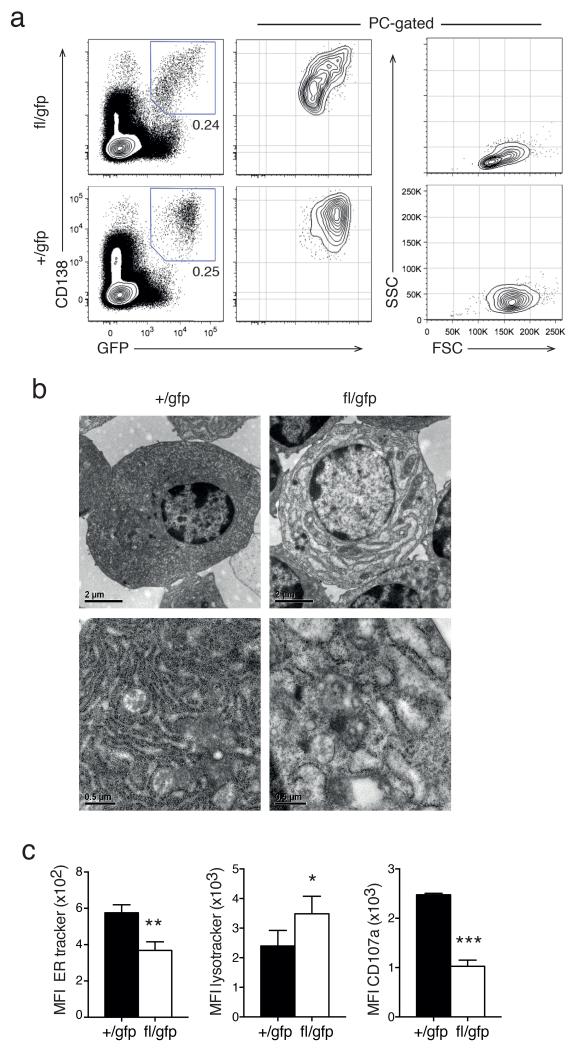
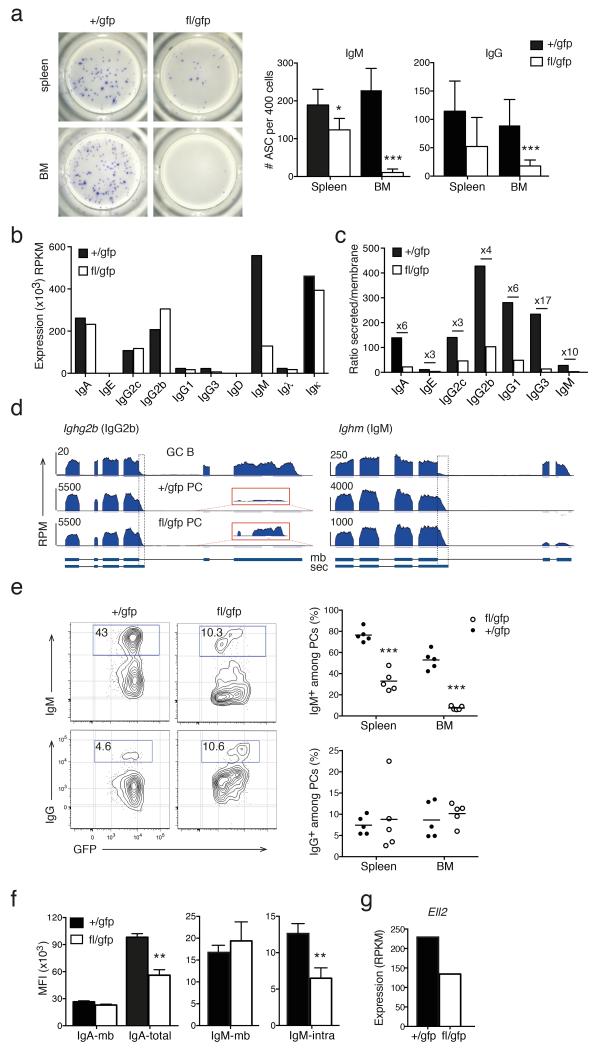
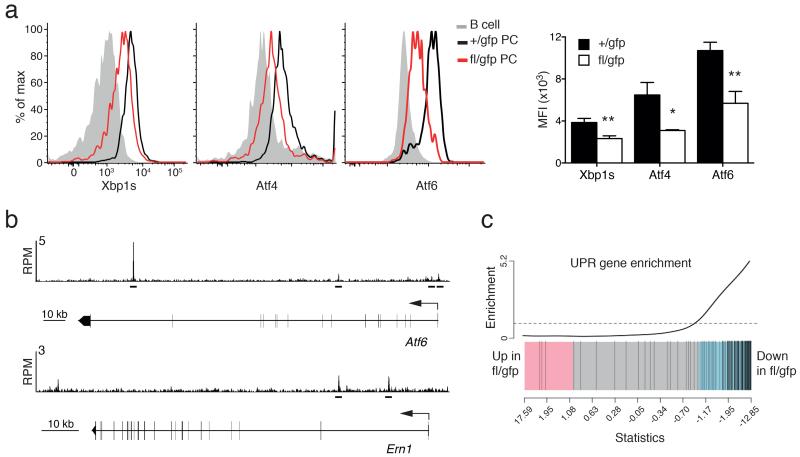
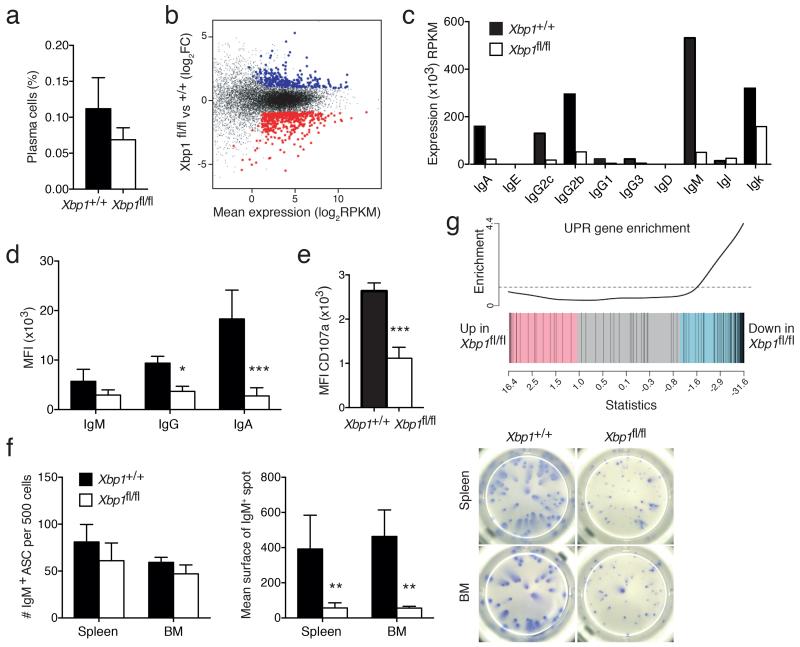
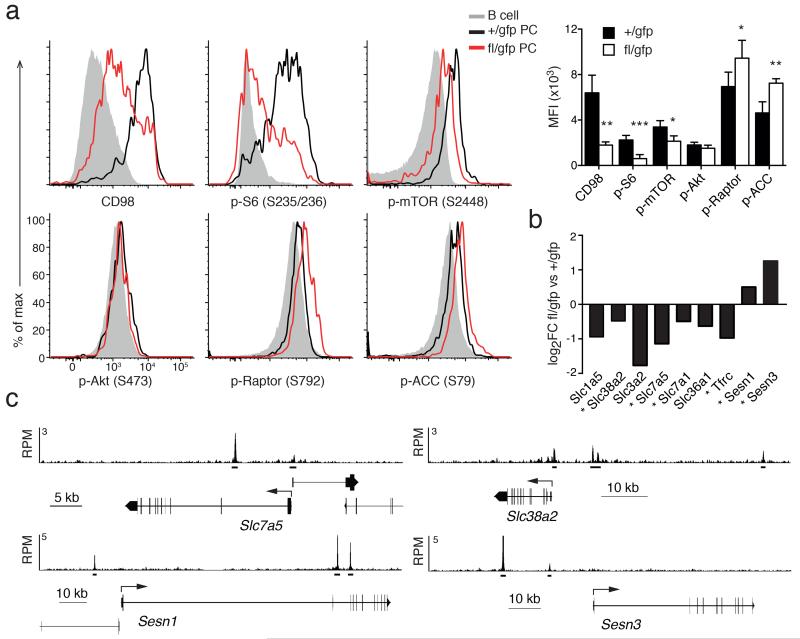
Plasma cell differentiation requires silencing of B cell transcription, while it establishes antibody-secretory function and long-term survival. The transcription factors Blimp-1 and IRF4 are essential for the generation of plasma cells; however, their function in mature plasma cells has remained elusive. We found that while IRF4 was essential for the survival of plasma cells, Blimp-1 was dispensable for this. Blimp-1-deficient plasma cells retained their transcriptional identity but lost the ability to secrete antibody. Blimp-1 regulated many components of the unfolded protein response (UPR), including XBP-1 and ATF6. The overlap in the functions of Blimp-1 and XBP-1 was restricted to that response, with Blimp-1 uniquely regulating activity of the kinase mTOR and the size of plasma cells. Thus, Blimp-1 was required for the unique physiological ability of plasma cells that enables the secretion of protective antibody.


Figures

Figure 1
Figure 1
Inactivation of Irf4 and Prdm1 in plasma cells. (a) Rag1−/− mice transferred with conditional knockout or control B cells were treated with tamoxifen to induce Cre activity and analyzed at the indicated time points, using the experimental plan outlined in Supplementary Fig. 1a. Left, frequency of Irf4fl/+CreERT2 or Irf4fl/−CreERT2 GFP+ PCs (out of total BM cells) was determined at the indicated day after tamoxifen treatment to induce Irf4 inactivation (reported by GFP expression). PCs were identified as CD138+B220lo. Right, frequency of Prdm1+/gfpCreERT2 (+/gfp) or Prdm1fl/gfpCreERT2 (fl/gfp) BM PCs at the indicated day after tamoxifen treatment. PCs were identified as CD138+Blimp-1-GFP+. (b) Frequency of BM PCs from intact Prdm1+/gfpCreERT2 or Prdm1fl/gfpCreERT2 mice at the indicated day after tamoxifen treatment, using the experimental plan outlined in Supplementary Fig. 1b. Each symbol in a,b represent data from a single mouse. Mean value is shown by a horizontal line. P values compare the indicated groups using a paired t-test. * P<0.05, ** P<0.005.
Figure 2
Figure 2
Transcriptional analysis of Blimp-1-deficient plasma cells. (a–c) Whole genome RNA-sequencing analysis on BM PCs, sorted from Prdm1+/gfpCreERT2 (+/gfp) or Prdm1fl/gfpCreERT2 (fl/gfp) mice 21 days after tamoxifen treatment. (a) Scatter plot of differential expression. Genes with significantly increased (Blimp-1-repressed, blue) or decreased (Blimp-1-activated, red) expression in the absence of Blimp-1 (fl/gfp) are indicated (FDR <0.05, normalized average expression ≥4 RPKM in at least one sample). (b) Functional classification and quantification of proteins encoded by repressed (blue) and activated (red) Blimp-1 targets in PCs. (c) Heat map shows the expression of the published gene signatures for follicular B cells (Fo B) and BM PCs from +/gfp and fl/gfp mice. The positions of some genes of interest are highlighted. (d) Flow cytometry profiles of BM mature B cells (B220hiCD19hi) and PCs (CD138+Blimp-1-GFP+) showing Blimp-1–regulated surface molecules after 21 days after tamoxifen treatment. Data is representative of at least 3 experiments. (e) Venn diagram showing overlap and differences between Blimp-1 activated target genes (Supplementary Table 1) and the PC gene signature. Data in a–c, e derive from 2 experiments.
Figure 3
Figure 3
Blimp-1 controls plasma cell size and morphology. (a) Cytometry profiles of Prdm1+/gfpCreERT2 (+/gfp) and Prdm1fl/gfpCreERT2 (fl/gfp) BM cells (left) and gated CD138+Blimp-1-GFP+ PCs (middle and right) 35 days after tamoxifen treatment. Data is representative of 5 experiments. (b) Electron micrograph of isolated +/gfp and fl/gfp BM PCs 21 days after tamoxifen treatment. Data is representative of 2 experiments. (c) Mean fluorescent index (MFI) of organelle specific dyes (left, ER mitotracker and middle, lysotracker) and of surface CD107a expression (right) of +/gfp and fl/gfp BM cells 35 days after tamoxifen treatment. Data is the mean ± S.D. from 3 experiments. P values compare the indicated groups using a paired t-test. * P <0.05, ** P <0.01, *** P <0.005.
Figure 4
Figure 4
Blimp-1 controls immunoglobulin production. (a) ELISPOT assay for IgM and pan-IgG secretion from isolated +/gfp and fl/gfp PCs 14 days after tamoxifen treatment. Left, images of representative wells of an anti-IgM assay. Right, graphs depict mean ± S.D. from a representative of 2 experiments. (b-d) RNA sequencing analysis of Igh transcripts in +/gfp and fl/gfp BM PCs analyzed as described in Fig. 2. (b) Normalized expression in RPKM of Igh and Igl constant regions. (c) Ratio of secreted (sec) / membrane-bound (mb) mRNA for each Igh isotype. Numbers specify the fold change between +/gfp and fl/gfp cells. (d) RNA sequencing tracks of Ighg2b and Ighm in Prdm1+/gfp GC B cells, +/gfp and fl/gfp BM PCs. Boxes with dotted lines delineates the secretion specific sequences. Red boxes show the increased usage of the membrane specific exons of Ighg2b (magnified 85×). (e) Cytometry profiles of +/gfp and fl/gfp BM PCs 28 days after tamoxifen treatment showing intracellular staining of IgM and IgG (left). Right, graphs depict the percentage of IgM+ or IgG+ cells among the Blimp-1-GFP+ PC population in spleen and BM. Symbols show individual mice, horizontal line is the mean. (f) Left, mean fluorescence index (MFI) of plasma membrane (mb) or total (mb and intracellular) expression of IgA, detected by sequential staining with the same Ab, in +/gfp and fl/gfp BM PCs 35 days after tamoxifen treatment. Right, MFI of plasma membrane (mb) or specific intracellular (intra) expression of IgM, detected by separate anti-IgM Abs, in +/gfp and fl/gfp BM PCs 35 days after tamoxifen treatment. Graphs depict mean ± S.D. from ≥2 experiments. (g) RNA sequencing analysis of the expression of Ell2 in +/gfp and fl/gfp BM PCs as described in Fig. 2. P values compare the indicated groups using a paired t-test. * P <0.05, ** P <0.01, *** P <0.005.
Figure 5
Figure 5
Blimp-1 controls the unfolded protein response (UPR). (a) Cytometry profiles of intracellular staining of the expression of the key transcription factors of the UPR pathway: XBP-1s, Atf4 and Atf6, in Prdm1+/gfpCreERT2 (+/gfp) and Prdm1fl/gfpCreERT2 (fl/gfp) BM PCs 35 days after tamoxifen treatment. Graph shows the mean fluorescent index (MFI) of expression in PCs from ≥2 experiments. P values compare the indicated groups using a paired t-test. * P < 0.05, ** P < 0.01. (b) Blimp-1 binding at the Atf6 and Ern1 (encodes for Ire1) genes in LPS stimulated Prdm1Bio/BioRosa26BirA/BirA tagged PBs. Blimp-1 peaks are shown together with the exon-intron structure of the gene and a scale bar in kilobases (kb). RPM, reads per million reads. Bars below the tracks indicate Blimp-1-binding regions identified by MACS peak calling. (c) Gene set enrichment analysis barcode plot comparing differential gene expression in fl/gfp and +/gfp BM PCs after tamoxifen treatment, as in Fig. 2. The differential gene expression dataset is shown as a shaded rectangle with genes horizontally ranked by moderated t statistic. Genes upregulated upon Blimp-1 loss shaded pink (t > 1) and downregulated genes shaded blue (t < −1). The 119 UPR genes, identified by gene annotation and filtered for expression in PCs, are marked on the plot by vertical black lines and enriched for genes downregulated without Blimp-1 (P =0.001).
Figure 6
Figure 6
XBP-1 loss leads to reduced Igh expression and unfolded protein response (UPR) activity. (a-g) Xbp1+/+ Prdm1+/gfpCreERT2 (+/+) or Xbp1fl/fl Prdm1+/gfpCreERT2 (fl/fl) mice were treated with tamoxifen to induce XBP-1 inactivation. PCs were identified as CD138+Blimp-1-GFP+ cells, 21 (b-d, f-g) or 35 (a, e) days later. (a) The proportion of BM PCs in a representative experiment. Graphs depict mean ± S.D. from 1 of 2 experiments. (b) Scatter plot of differential expression. Genes with significantly increased (XBP-1-repressed, blue) or decreased (XBP-1-activated, red) expression in the absence of XBP-1 (fl/fl) are indicated (FDR <0.05, normalized average expression ≥4 RPKM in at least one sample). (c) Normalized expression of the constant exons of the Igh and Igl chain genes in +/+ or fl/fl BM PCs. (d) Intracellular staining for Ig isotypes in +/+ or fl/fl BM PCs. Mean fluorescence index (MFI) for IgM, IgA and IgG was measured on IgAIgG, IgMIgG and IgAIgM cells, respectively. Graphs depict mean ± S.D. from 2 experiments. (e) MFI of CD107a expression at the surface of +/+ or fl/fl BM PCs. Graphs depict mean ± S.D. from 2 experiments. (f) ELISPOT assay for IgM secretion by isolated +/+ or fl/fl PCs. Left, Graphs depict mean number of IgM+ cells ± S.D. per 500 sorted Blimp-1-GFP+CD138+ PCs from 1 of 2 experiments. Middle, mean surface area ± S.D. of the spots identified. Right, pictures show representative wells of an anti-IgM assay. (g) Gene set enrichment plot for the UPR gene expression in +/+ or fl/fl BM PCs after tamoxifen treatment. The differential gene expression dataset is shown as a shaded rectangle with genes horizontally ranked by moderated t statistic. Genes upregulated upon XBP-1 loss shaded pink (t > 1) and downregulated genes shaded blue (t < −1). The 119 UPR genes, identified on the plot by black vertical lines, are enriched for genes downregulated without XBP-1 (P =0.0005). P values compare the indicated groups using a paired t-test. * P < 0.05, ** P < 0.01, *** P < 0.005.
Figure 7
Figure 7
Blimp-1 regulates the mTOR pathway. (a) Cytometry profiles of the expression of key components of the mTOR pathway, including the amino acid carrier CD98, and phosphorylation of mTOR, S6, Akt, Raptor and ACC in mature B cells (B220hiCD19hi) and PCs (CD138+Blimp-1-GFP+) from Prdm1+/gfpCreERT2 (+/gfp) BM and Prdm1fl/gfpCreERT2 (fl/gfp) BM PCs cells, 35 days after tamoxifen treatment. Right, graph shows the mean fluorescent index (MFI) ± S.D. of expression in PCs from 2 or more experiments for each antibody. P values compare the indicated groups using a paired t-test. * P <0.05, ** P <0.01, *** P <0.005. (b) RNA sequencing analysis showing fold changes in key genes upstream of the mTOR pathway in +/gfp and fl/gfp BM PCs analyzed as described in Fig. 2. * Indicates direct Blimp-1 target genes. (c) Blimp-1 binding at the Slc7a5 (encoding a chain of CD98), Slc38a2, Sesn1 and Sesn3 genes in LPS-stimulated Prdm1Bio/BioRosa26BirA/BirA tagged PBs. Blimp-1 peaks are shown together with the exon-intron structure of the gene and a scale bar in kilobases (kb). RPM, reads per million reads. Bars below the tracks indicate Blimp-1–binding regions identified by MACS peak calling.

References

    1. Tarlinton D, Radbruch A, Hiepe F, Dorner T. Plasma cell differentiation and survival. Curr Opin Immunol. 2008;20:162–169. - PubMed
    1. MacLennan IC, et al. Extrafollicular antibody responses. Immunol Rev. 2003;194:8–18. - PubMed
    1. Hammarlund E, et al. Duration of antiviral immunity after smallpox vaccination. Nat Med. 2003;9:1131–1137. - PubMed
    1. Bettigole SE, Glimcher LH. Endoplasmic reticulum stress in immunity. Annu Rev Immunol. 2015;33:107–138. - PubMed
    1. Nutt SL, Hodgkin PD, Tarlinton DM, Corcoran LM. The generation of antibody-secreting plasma cells. Nat Rev Immunol. 2015;15:160–171. - PubMed

Publication types

MeSH terms

Substances