. 2016 Mar;17(3):331-43.
doi: 10.1038/ni.3349. Epub 2016 Jan 18.

Multifunctional role of the transcription factor Blimp-1 in coordinating plasma cell differentiation

Affiliations

Multifunctional role of the transcription factor Blimp-1 in coordinating plasma cell differentiation

Martina Minnich et al. Nat Immunol. 2016 Mar.

Abstract

The transcription factor Blimp-1 is necessary for the generation of plasma cells. Here we studied its functions in plasmablast differentiation by identifying regulated Blimp-1 target genes. Blimp-1 promoted the migration and adhesion of plasmablasts. It directly repressed genes encoding several transcription factors and Aicda (which encodes the cytidine deaminase AID) and thus silenced B cell-specific gene expression, antigen presentation and class-switch recombination in plasmablasts. It directly activated genes, which led to increased expression of the plasma cell regulator IRF4 and proteins involved in immunoglobulin secretion. Blimp-1 induced the transcription of immunoglobulin genes by controlling the 3' enhancers of the loci encoding the immunoglobulin heavy chain (Igh) and κ-light chain (Igk) and, furthermore, regulated the post-transcriptional expression switch from the membrane-bound form of the immunoglobulin heavy chain to its secreted form by activating Ell2 (which encodes the transcription-elongation factor ELL2). Notably, Blimp-1 recruited chromatin-remodeling and histone-modifying complexes to regulate its target genes. Hence, many essential functions of plasma cells are under the control of Blimp-1.


Conflict of interest statement

Competing financial interests

The authors declare no competing financial interests.

Figures
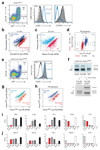
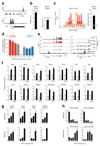
Figure 1
Figure 1. Blimp1-dependent gene expression changes during plasma cell differentiation.
(a) In vitro plasmablast differentiation. B220+ B cells from spleen and lymph nodes of Prdm1Gfp/+ mice were stimulated with LPS for 4 days prior to flow cytometric analysis of activated B cells (Act B; CD138GFP), pre-plasmablasts (pre-PB; CD138GFP+) and plasmablasts (PB; CD138+GFP+). Numbers refer to the percent of cells in the indicated gates. Cell surface expression of CD22 and CXCR4 on the three cell types is shown to the right. (b) Scatter plot of gene expression differences between in vitro differentiated activated B cells and plasmablasts of the Prdm1Gfp/+ genotype, based on two independent RNA-seq experiments for each cell type. The normalized expression data of individual genes in the two cell types were plotted as RPM values. Each symbol represents one gene. Genes with an expression difference of > 3-fold, an adjusted P value of < 0.1 and an RPKM value of > 3 in plasmablasts (up-regulated) or activated B cells (down-regulated) are colored in blue or red, corresponding to up- or down-regulated genes in plasmablasts, respectively. For evaluation of the RNA-seq data, see Online Methods. (c) Gene expression differences between ex vivo sorted Prdm1Gfp/+ plasma cells (B220loCD28+CD138+GFP+Lin) from the bone marrow and wild-type mature B cells (B220+CD19+IgDhi) from lymph nodes. The RNA-seq data were analyzed with the same cutoffs as described in b. Two independent RNA-seq experiments were performed for each cell type. (d) Overlap of the gene expression signatures between in vivo bone marrow plasma cells and in vitro differentiated plasmablasts. The log2 fold expression change observed between in vitro differentiated activated B cells and plasmablasts (x-axis) as well as between ex vivo sorted mature B cells and plasma cells (y-axis) is plotted for each gene. The 648 up-regulated (Up) and 424 down-regulated (Down) genes identified in the activated B cell-to-plasmablast transition (plasmablast signature; b) are indicated as blue and red dots, respectively. (e) In vitro differentiation of mature B cells from the spleen and lymph nodes of Cd23-Cre Prdm1Gfp/fl mice with LPS for 4 days prior to flow cytometric analysis as described in a. (f) PCR genotyping of FACS-sorted activated B cells (Act B; CD138GFP), pre-plasmablasts (pre-PB; CD138GFP+, top row) and plasmablasts (PB; CD138+GFP+). The pre-plasmablasts were further separated into CD22loCD138GFP+ and CD22hiCD138GFP+ cells (bottom row). The positions of the PCR fragments corresponding to the Gfp-tagged, intact floxed (fl) and deleted (Δ) Prdm1 alleles are shown to the left, and their size is indicated in base pairs (bp) to the right. (g) Scatter plot of gene expression differences between experimental Prdm1Gfp/Δ and control Prdm1Gfp/+ pre-plasmablasts, based on two independent RNA-seq experiments for each cell type, as described in b. (h) Overlap of Blimp1-regulated genes with the plasmablast signature. Genes, which correspond to up-regulated (blue) or down-regulated (red) genes identified in the B cell-to-plasmablast transition (plasmablast signature; b), are indicated in the scatter plot of gene expression differences between Prdm1Gfp/Δ and Prdm1Gfp/+ pre-plasmablasts. Numbers refer to Blimp1-regulated genes, which are > 3 fold up- or down-regulated in the plasmablast transition. (i) Expression of Blimp1-dependent cell surface receptor genes during LPS-induced plasmablast differentiation and in ex vivo sorted mature B cells (Mat B) and plasma cells (PC). The expression of each gene is shown as normalized gene-expression RPKM value with SEM, based on two RNA-seq experiments for each cell type. PPB, pre-plasmablasts; KO PPB, Prdm1Gfp/ΔPPB. (j) Expression of Blimp1-independent genes during LPS-induced plasmablast differentiation as well as in mature B and plasma cells. Blimp1-independent genes were defined by a < 1.6-fold expression difference between Prdm1Gfp/Δ and control Prdm1Gfp/+ pre-plasmablasts (shown in grey in h). RPM, reads per gene per million mapped sequence reads; RPKM, reads per kilobase of exon per million mapped sequence reads.
Figure 2
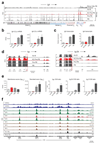
Figure 2. Identification of regulated Blimp1 target genes.
(a) Blimp1 binding at the Cd22 and Tlr9 genes in plasmablasts. B220+ mature B cells from the spleen and lymph nodes of Prdm1Bio/Bio Rosa26BirA/BirA mice were stimulated for 4 days with LPS prior to Bio-ChIP-sequencing. Blimp1 peaks are shown together with the exon-intron structure of the gene and a scale bar shown in kilobases (kb). Bars below the ChIP-seq track indicate Blimp1-binding regions identified by MACS peak calling. (b) Identification of 8,742 Blimp1 peaks in plasmablasts with a stringent P value of < 10-10, as determined by MACS peak calling. Peak-to-gene assignment identified 4,899 Blimp1 target genes in plasmablasts. (c) Consensus Blimp1 recognition sequence identified by the de novo motif discovery program MEME-ChIP. The Blimp1-binding motif with an E-value of 3x10-356 was detected at 70% of all Blimp1 peaks in plasmablasts (right). The same motif was found in random DNA sequences at a frequency of 20% (indicated by a white line). (d) Identification of activated and repressed Blimp1 target genes in pre-plasmablasts. The number and percentage of Blimp1 target genes are shown for the indicated fold gene expression differences between experimental Prdm1Gfp/Δ and control Prdm1Gfp/+ pre-plasmablasts, as defined in Fig. 1h. Activated and repressed genes were selected for an RPKM value of > 3 in control Prdm1Gfp/+ pre-plasmablasts (activated) or experimental Prdm1Gfp/Δ pre-plasmablasts (repressed), respectively. ND, not determined. (e) Expression of the regulated Blimp1 target genes Aicda and Il10 in Prdm1Gfp/Δ (KO) pre-plasmablasts and activated B cells, pre-plasmablasts and plasmablasts of the control Prdm1Gfp/+ genotype, as shown by RNA-seq analysis. Blimp1 peaks were identified in plasmablasts by Bio-ChIP-seq, as described in a. (f) Direct activation of target genes by Blimp1-ERT2 in the absence of protein synthesis. Where indicated, the WEHI-231 B cells expressing the Blimp1-estrogen receptor (ERT2) fusion protein were pre-incubated with cycloheximide (CHX; 25 μg/ml) for 30 min prior to the addition of 4-hydroxytamoxifen (OHT; 1 μM) for 6 h, which was followed by RNA isolation and RT-qPCR analysis of nascent transcripts of the indicated genes, as described in the Online Methods. The transcript value of each gene was normalized to the corresponding value of the Tbp gene coding for the TATA box-binding protein. The normalized value was set to 1 for the cells that were not treated with OHT. Average values with SEM are shown for three independent experiments. No PCR signal was observed, if the reverse transcriptase was omitted. (g) Induction of active chromatin at Blimp1-binding sites of activated target genes. WEHI-Blimp1-ERT2 cells were treated with OHT (1 μM) for up to 6 h prior to ChIP analysis with H3K4me2- or H3K27ac-specific antibodies. Input and precipitated DNA were quantified by real-time PCR with primer pairs amplifying the Blimp1-binding regions of the indicated genes and the promoter of the ubiquitously expressed control Tbp gene. The amount of precipitated DNA was determined as percentage relative to input DNA for each region analyzed and is shown as relative enrichment at the target site compared to the Tbp promoter by dividing the percentage of precipitated DNA at the Blimp1-binding site (target ChIP/target input) by the percentage of precipitated DNA at the Tbp promoter (Tbp ChIP/Tbp input). The normalized value was set to 1 for the time point 0. Average values with SEM are shown for two independent experiments. DE, distal element. (h) Abundance of the active H3K27ac and repressive H3K27me3 histone marks at Blimp1-binding sites of repressed target genes in OHT-stimulated WEHI-Blimp1-ERT2 cells. The data of two independent ChIP experiments were evaluated and normalized as described in g.
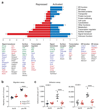
Figure 3
Figure 3. Function of activated and repressed Blimp1 target genes in plasmablasts.
(a) Functional classification and quantification (numbers) of the proteins encoded by activated and repressed Blimp1 target genes in pre-plasmablasts. Regulated Blimp1 target genes of selected functional classes are shown below and ranked according to their fold expression changes observed between Prdm1Gfp/Δ and Prdm1Gfp/+ pre-plasmablasts (Fig. 2d). The color code refers to >10-fold (green), 5-10-fold (blue), 4-5-fold (red) and 3-4-fold (black). Genes with low expression in bone marrow plasma cells compared to LPS-stimulated plasmablasts are indicated by an asterisk. (b) Transwell migration assay. LPS-stimulated activated B cells (Act B) and pre-plasmablasts of the indicated genotypes in IMDM medium were placed in the upper compartment, whereas IMDM medium containing 400 ng/ml CXCL12 (SDF-1α) was present in the lower compartment of a transwell chamber separated by a filter of 5 μm-pore size. Cells migrating into the lower chamber after a 2-hour incubation at 37°C were measured in a Casy cell counter and are indicated as percentage of the total cells per well. The average percentage and SEM of one of four independent experiments are shown. Each symbol represents the cell count of one well. (c) Adhesion assay. LPS-stimulated activated B cells and pre-plasmablasts of the indicated genotypes were allowed to adhere to ICAM1-Fc- or VCAM1-Fc-coated glass slides in the presence of CXCL12 for 6 hours in DMEM medium, washed 2 times and fixed in 4% paraformaldehyde (see Online Methods). Individual wells (represented by symbols) were evaluated by automatic cell counting, and the average cell density with SEM is shown for one of four (ICAM-1) or two (VCAM-1) independent experiments. Each symbol represents the result of one well. **** P < 0.0001 (two-way analysis of variance (ANOVA) with Bonferroni’s post-test).
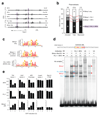
Figure 4
Figure 4. Mutually exclusive binding of Blimp1 and the PU.1-IRF4 complex to a common recognition motif in plasmablasts.
(a) Binding patterns of IRF4, PU.1 and Blimp1 in CD138+ plasmablasts at day 4 of LPS stimulation. The binding of IRF4 was analyzed by ChIP-seq with an IRF4 antibody, whereas PU.1 (Spi1) binding was determined by Bio-ChIP-seq of plasmablasts from Spi1Bio/Bio Rosa26BirA/BirA mice (Supplementary Fig. 4d). IRF4 and PU.1 peaks were called with a stringent P value of 10-10. (b) Colocalization of Blimp1 peaks with binding sites of IRF4 and PU.1 in plasmablasts, as determined by multiple overlap analysis of the respective ChIP-seq data. The overlap of binding sites is shown as percentage relative to the total Blimp1-binding sites (Fig. 2b) or Blimp1-binding sites present at activated and repressed Blimp1 target genes (Fig. 2d). (c) Consensus motif of the common binding sites for Blimp1 and the PU.1-IRF4 complex (middle). The common binding sites were bioinformatically identified by the strict colocalization of the Blimp1-binding and EICE motifs in the 3,806 peaks characterized by overlapping Blimp1, IRF4 and PU.1 binding (Supplementary Fig. 4a). For comparison, the Blimp1-only and EICE motifs (Supplementary Fig. 4a) are shown together with their deviation from the common motif, which is indicated by black (Blimp1-only) and red (EICE) asterisks. (d) Mutually exclusive binding of Blimp1 and the PU.1-IRF4 complex to a common binding site present in the second intron of the repressed Blimp1 target gene Vrk2. The Blimp1-Bio (V5), IRF4 and PU.1 proteins were individually expressed in transfected HEK-293T cells and analyzed by electromobility shift assay (EMSA) for binding to the common binding site probe of the Vrk2 gene. Anti-PU.1, anti-IRF4 and anti-V5 antibody (Ab) were added to the binding reaction, where indicated. The different protein-DNA and Ab complexes are indicated. (e) Displacement of IRF4 and PU.1 from common binding sites by Blimp1-ER. WEHI-Blimp1-ERT2 B cells were treated with OHT (1 μM) for 1 or 2 h prior to ChIP analysis with anti-IRF4, anti-PU.1 or anti-ER antibodies. Input and precipitated DNA were quantified by real-time PCR with primer pairs amplifying the common-binding regions of the indicated genes shown in Supplementary Fig. 4c. The amount of precipitated DNA was determined as percentage relative to input DNA for each region analyzed, and the relative enrichment was set to 1 for the time point 0. Average values with SEM are shown for three independent experiments. DE, distal element.
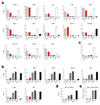
Figure 5
Figure 5. Blimp1-dependent regulation of transcription factor genes in plasmablasts.
(a,b) Expression of the repressed (a) and activated (b) Blimp1 target genes coding for transcriptional regulators. The expression of the indicated genes was determined by RNA-sequencing of LPS-stimulated Prdm1Gfp/Δ pre-plasmablasts (KO PPB, red) and activated B cells (Act B, light grey), pre-plasmablasts (PPB, grey) and plasmablasts (PB, dark grey) of the control Prdm1Gfp/+ genotype as well as ex vivo sorted wild-type lymph node B cells (Mat B, white) and bone marrow plasma cells (PC, black). Gene expression is shown as normalized expression value (RPKM) with SEM, based on two independent RNA-seq experiments for each cell type. (c,d) Expression of Bcl6 (c) and the Blimp1-activated Xbp1 gene (d) during plasma cell differentiation. (e) RT-qPCR analysis of nascent Xbp1 transcripts in the indicated cell types. The amount of nascent Xbp1 transcripts (intron 2) was normalized to the amount of nascent Tbp transcripts (intron 1).
Figure 6
Figure 6. Blimp1-dependent activation of immunoglobulin gene transcription in plasmablasts.
(a) Blimp1 binding and transcript abundance at the Igh locus. The binding of the Blimp1-Bio protein (determined by ChIP-seq; top row) in plasmablasts (PB) and the abundance of the Igh gene transcripts (determined by RNA-seq) are shown for LPS-stimulated Prdm1Gfp/Δ pre-plasmablasts (KO Pre-PB, red) as well as for activated B cells (Act B, light grey), pre-plasmablasts (Pre-PB, grey) and plasmablasts (PB, black) of the control Prdm1Gfp/+ genotype. The annotation of the C57BL/6 Igh locus (below) indicates the distinct VH gene families (different colors) in the distal, middle and proximal VH gene regions as well as the DH (grey), CH (blue) elements and Eμ and 3’RR enhancers (red) in the 3’ proximal Igh domain. (b) Normalized expression (RPKM) of the Igμ and Igk constant exons in the indicated cell types. (c) RT-qPCR analysis of nascent Igh and Igk transcripts in the indicated cell types. The amount of nascent transcripts of the rearranged Igh (Igμ intron 2) and Igk (intron 1) genes was normalized to the amount of nascent Tbp transcripts (intron 1). (d) RNA abundance at the Igμ and Igγ2b genes, as described in a. (e) The RPKM expression values for the membrane (Igμm) and secreted (Igμs) exons are shown for the different cell types together with the Igμs / Igμm, Igγ2bs / Igγ2bm and Igγ3s / Igγ3m mRNA ratios (S:M). (f) Chromatin changes and transcription factor binding at the 3’ regulatory region (3’RR) of the Igh locus during the transition from activated B cells to plasmablasts. DHS sites were determined by ATAC-seq, the active histone mark H3K9ac and IRF4 binding by ChIP-seq and the binding of PU.1-Bio and Blimp1-Bio by Bio-ChIP-seq. The enhancers (HS3A, HS1/2, HS3B, HS4) of the 3’ RR are shown below together with the 3’ CTCF-binding element (3’CBE) region (HS5, HS6, HS7).
Figure 7
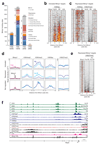
Figure 7. Chromatin changes at regulated Blimp1 target genes in plasmablasts.
(a) Overlap of Blimp1-binding sites with the regulatory landscape of plasmablasts. ‘Active’ promoters were defined by DHS sites (identified by ATAC-seq) overlapping with an mm9-annotated transcription start site (TSS). ‘Active’ distal elements were identified by the presence of a DHS site lacking a TSS. Regions of active, poised, bivalent and repressive chromatin were defined by the indicated combinations of active (H3K4me2, H3K4me3, H3K9ac) and repressive (H3K27me3) histone modifications, which were determined by ChIP-seq analysis in plasmablasts (Supplementary Fig. 7b). (b,c) Presence of H3K9ac or H3K27me3 in activated B cells (Act B) and plasmablasts (PB) at Blimp1-binding sites of activated (b) or repressed (c) target genes, respectively. The densities of Blimp1 binding, H3K9ac, H3K27me3 and CpG islands (CGI, blood) are displayed as heat maps that are shown for a region extending from -2.5 kb to +2.5 kb relative to the Blimp1 peak summit and were sorted according to the increasing density of H3K9ac (b) or H3K27me3 (c) in plasmablasts. Density scale; low (grey), intermediate (red), high (yellow). (d) The average density of Blimp1-binding (black, plasmablasts) and CpG islands (CGI; red, blood cells) as well as of the indicated histone marks in activated B cells (light blue) and plasmablasts (dark blue) are shown for a region extending from -2.5 kb to +2.5 kb relative to the Blimp1-binding sites present of activated (>3x), repressed (>3x) and not regulated (1-1.25x) Blimp1 target genes. (e) Absence of H3K27me3 at repressed Blimp1 target genes in Blimp1-deficient pre-plasmablasts. H3K27me3 was mapped by ChIP-seq analysis of Prdm1Gfp/Δ pre-plasmablasts (KO pre-PB; CD138GFP+CD22+) and control Prdm1Gfp/+ pre-plasmablasts (pre-PB; CD138GFP+CD22), which were isolated by flow cytometric sorting after 4 days of LPS stimulation. The densities of H3K27me3 at Blimp1-binding sites of repressed target genes are shown as a heat map (sorted according to increasing density in the control pre-plasmablasts). (f) Presence of active (H3K4me3, H3K9ac) and repressive (H3K27me3) histone marks, DHS sites, CpG islands (CGI) and Blimp1-binding sites at the Pax5 locus in activated B cells (Act B), pre-plasmablasts (pre-PB) and plasmablasts (PB). KO, Knock-out (Prdm1Gfp/Δ).
Figure 8
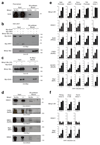
Figure 8. Blimp1-dependent recruitment of chromatin modifiers and remodelers to target genes.
(a) Co-precipitation of endogenous Ezh2 with Blimp1-Bio by streptavidin (SA) pulldown of extracts prepared from Prdm1Bio/Bio Rosa26BirA/+ plasmablasts after 4 days of LPS stimulation. The input (1/1000) and streptavidin-bound precipitate were analyzed by immunoblotting with an anti-Ezh2 antibody. The size of marker proteins is indicated in kilodaltons to the right. (b,c) Interaction of Blimp1 with PRC2 in HEK-293T cells that were transiently transfected with the expression vectors pCMV-Blimp1-Bio-IRES-BirA and pCMV-Myc-Ezh2 or pCMV-Myc-IRF4. (b) The Myc-tagged Ezh2 or IRF4 proteins were co-precipitated with the biotinylated Blimp1-Bio protein by streptavidin (SA) pulldown of nuclear extracts prepared from HEK-293T cells that were transfected with the indicated expression vectors. The input corresponds to 1/1000 of the nuclear extract used. (c) Blimp1-Bio was co-immunoprecipitated with the Myc-Ezh2 protein with an anti-Myc antibody. The input (1/300) and bound fraction were analyzed by immunoblotting with an anti-Myc or anti-V5 antibody to detect the Myc-tagged Ezh2 and IRF4 proteins or the V5-tagged Blimp1-Bio protein, respectively. (d) Co-precipitation of endogenous HDAC1, CHD4, MBD3, Brg1 or SIN3A with Blimp1-Bio by streptavidin pulldown of extracts prepared from LPS-stimulated Prdm1Bio/Bio Rosa26BirA/+ plasmablasts. The input (1/1000) and streptavidin-bound precipitate were analyzed by immunoblotting with the indicated antibodies. (e,f). Rapid recruitment of histone-modifying and chromatin-remodeling complexes to repressed (e) and activated (f) Blimp1 target genes. WEHI-Blimp1-ERT2 B cells were treated for up to 2 h with 4-hydroxytamoxifen (OHT, 1 μM) prior to ChIP with antibodies precipitating the subunits of the indicated complexes. Input and precipitated DNA were quantified by real-time PCR with primer pairs amplifying the Blimp1-binding regions of the indicated genes and the control Tbp promoter. The enrichment of precipitated DNA at the target sites relative to the Tbp promoter was determined as described in the legend of Fig. 2g. The relative enrichment at time point 0 was set to 1. The average values and standard deviations of two (Blimp1-ER, Ezh2) or three (others) independent experiments are shown. DE, distal element.

References

    1. Nutt SL, Hodgkin PD, Tarlinton DM, Corcoran LM. The generation of antibody-secreting plasma cells. Nat Rev Immunol. 2015;15:160–171. - PubMed
    1. Shi W, et al. Transcriptional profiling of mouse B cell terminal differentiation defines a signature for antibody-secreting plasma cells. Nat Immunol. 2015;16:663–673. - PubMed
    1. Yoshida H, Matsui T, Yamamoto A, Okada T, Mori K. XBP1 mRNA is induced by ATF6 and spliced by IRE1 in reponse to ER stress to produce a highly active transcription factor. Cell. 2001;107:881–891. - PubMed
    1. Shaffer AL, et al. XBP1, downstream of Blimp-1, expands the secretory apparatus and other organelles, and increases protein synthesis in plasma cell differentiation. Immunity. 2004;21:81–93. - PubMed
    1. Reimold AM, et al. Plasma cell differentiation requires the transcription factor XBP-1. Nature. 2001;412:300–307. - PubMed

Online Methods References

    1. Ohinata Y, et al. Blimp1 is a critical determinant of the germ cell lineage in mice. Nature. 2005;436:207–213. - PubMed
    1. Kallies A, et al. Plasma cell ontogeny defined by quantitative changes in Blimp-1 expression. J Exp Med. 2004;200:967–977. - PMC - PubMed
    1. Tallquist MD, Soriano P. Epiblast-restricted Cre expression in MORE mice: a tool to distinguish embryonic vs. extra-embryonic gene function. Genesis. 2000;26:113–115. - PubMed
    1. Rodriguez CI, et al. High-efficiency deleter mice show that FLPe is an alternative to Cre-loxP. Nat Genet. 2000;25:139–140. - PubMed
    1. Kwon K, et al. Instructive role of the transcription factor E2A in early B lymphopoiesis and germinal center B cell development. Immunity. 2008;28:751–762. - PubMed

Publication types

MeSH terms

Substances