. 2016 Jan 18:5:e12345.
doi: 10.7554/eLife.12345.

A chemical proteomic atlas of brain serine hydrolases identifies cell type-specific pathways regulating neuroinflammation

Affiliations

A chemical proteomic atlas of brain serine hydrolases identifies cell type-specific pathways regulating neuroinflammation

Andreu Viader et al. Elife. .

Abstract

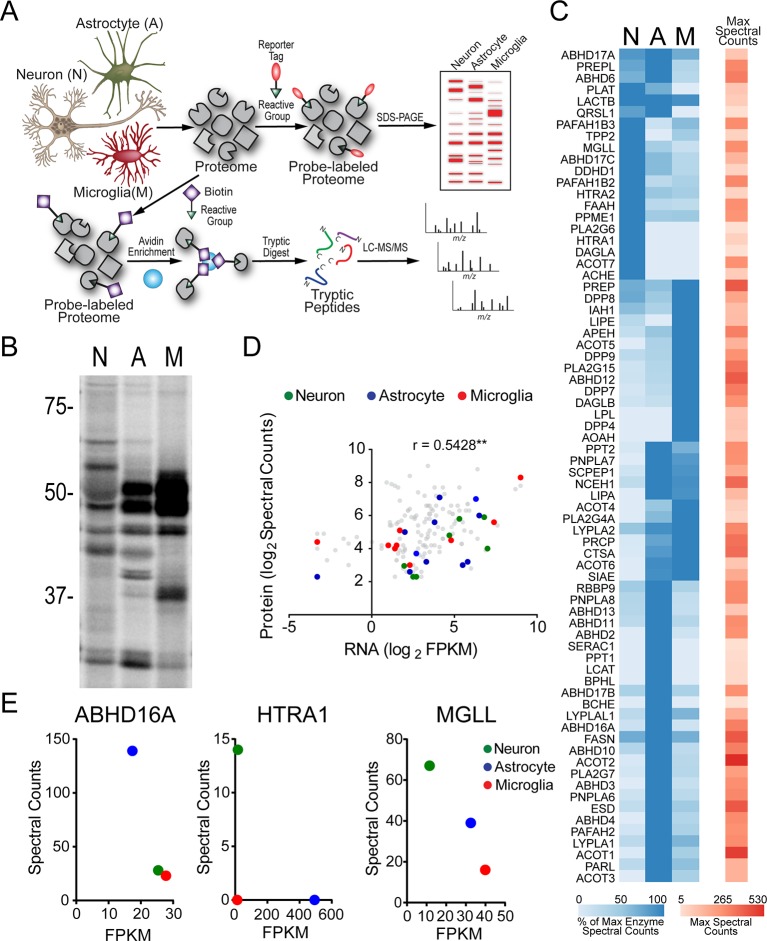
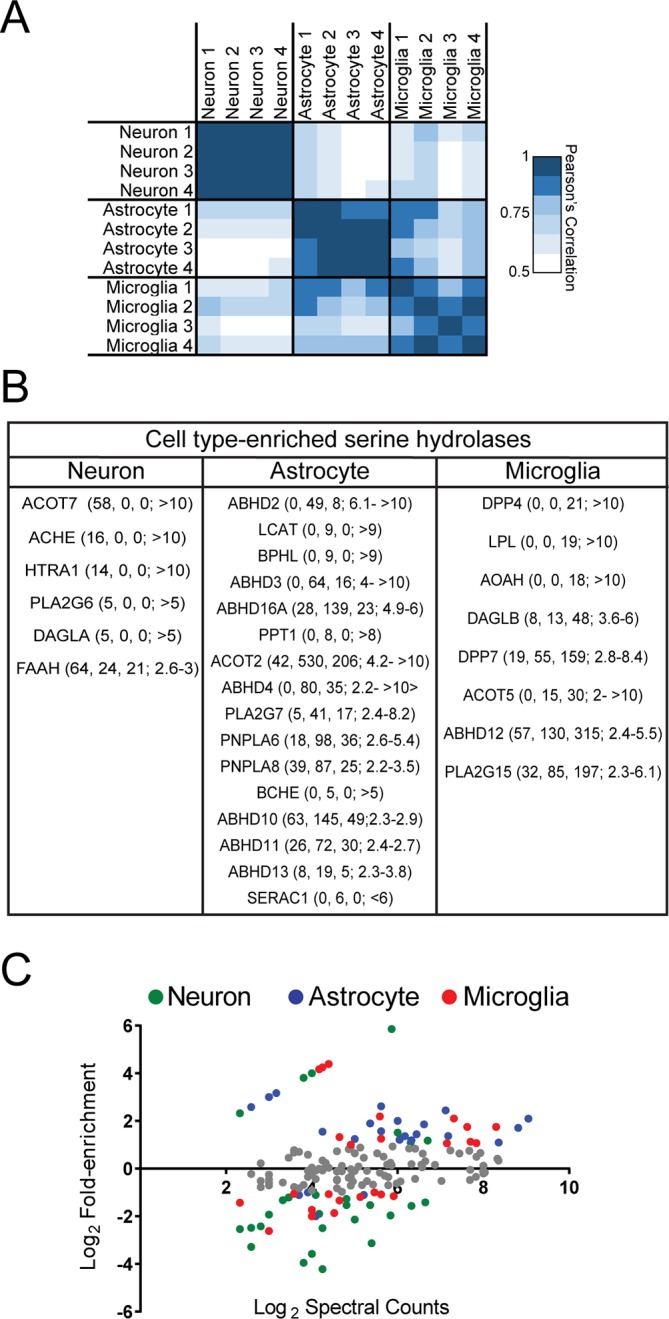
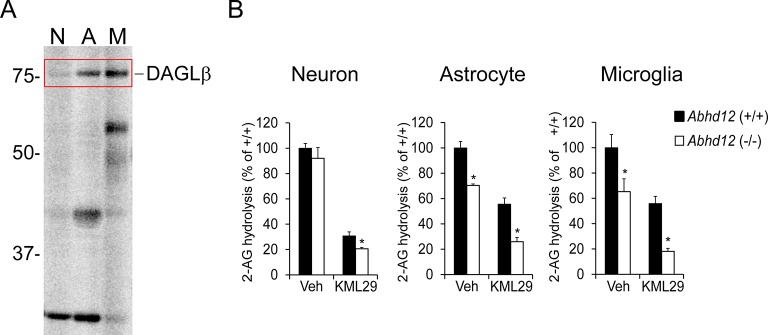
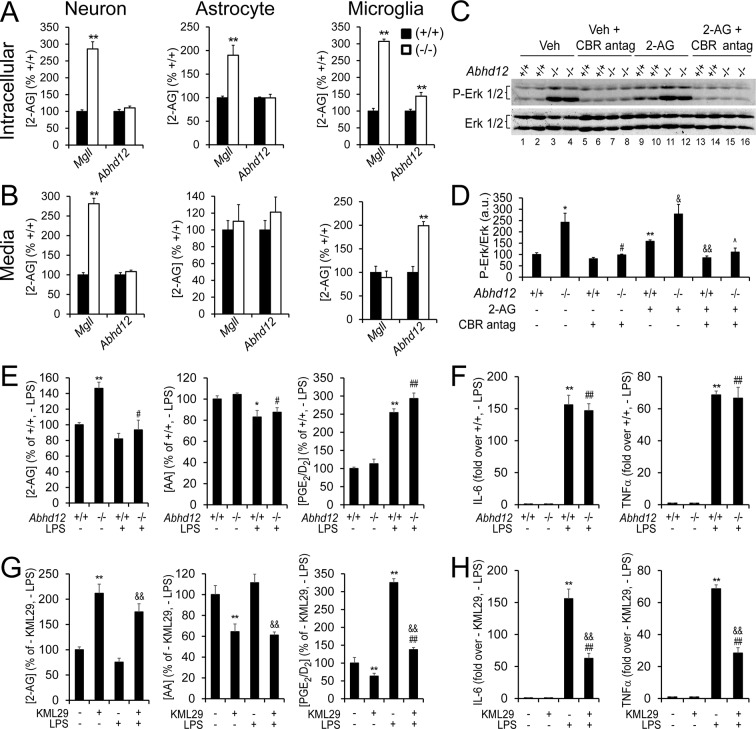
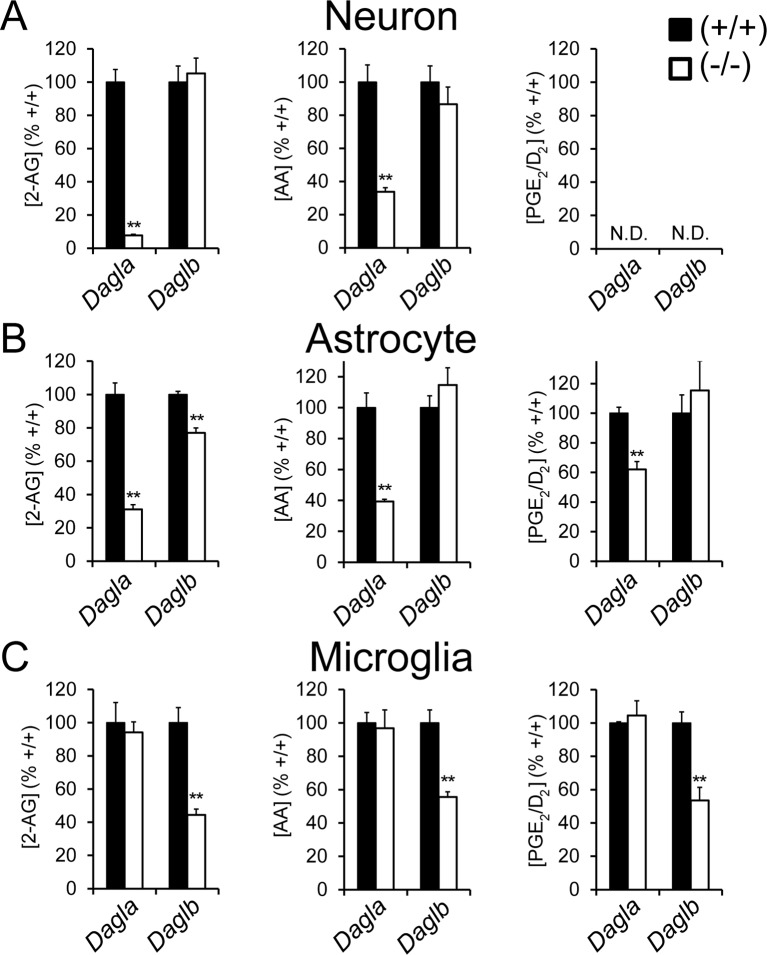
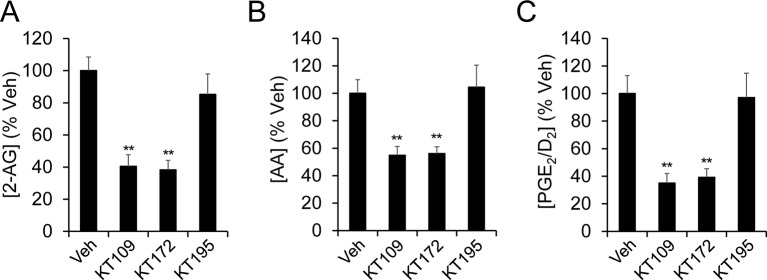
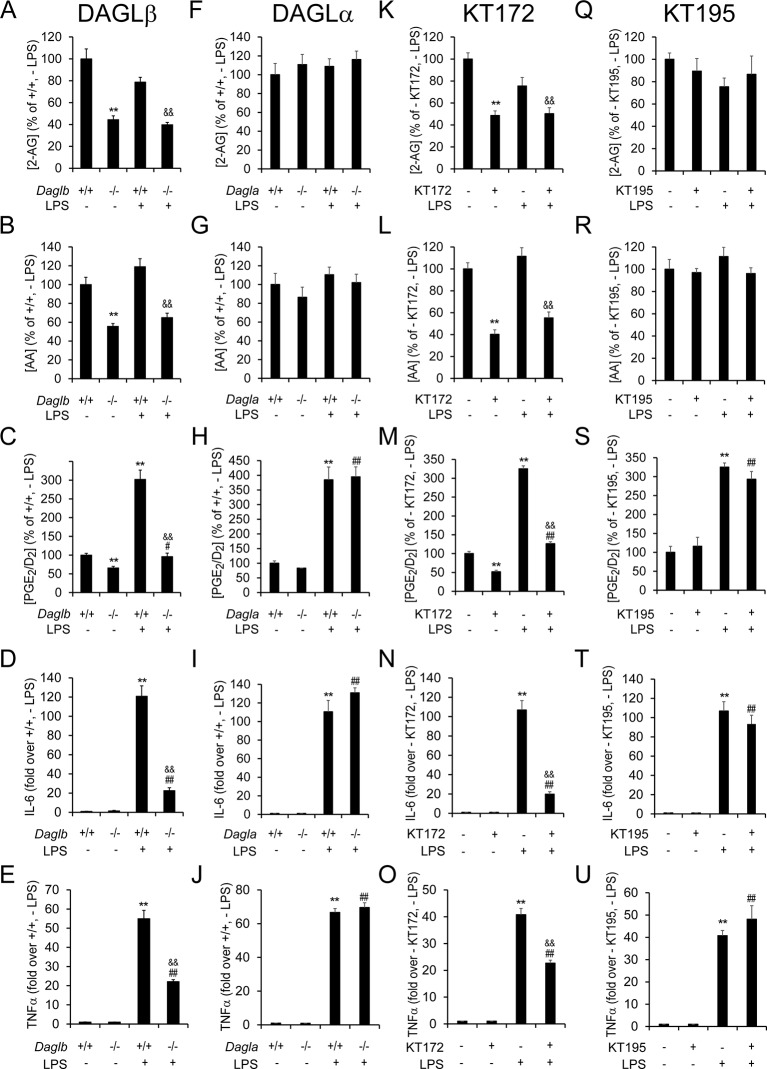
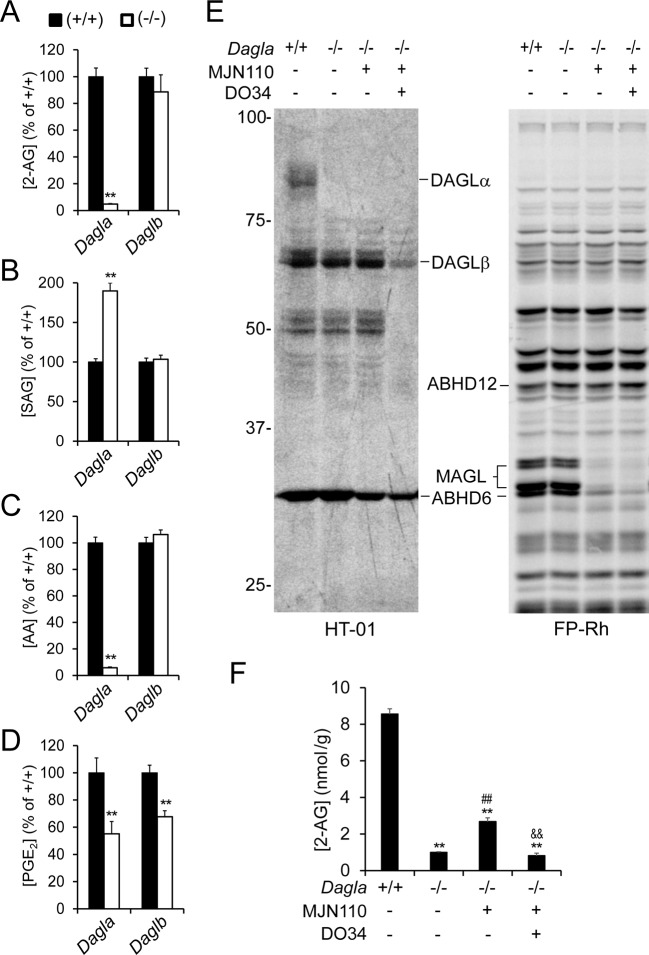
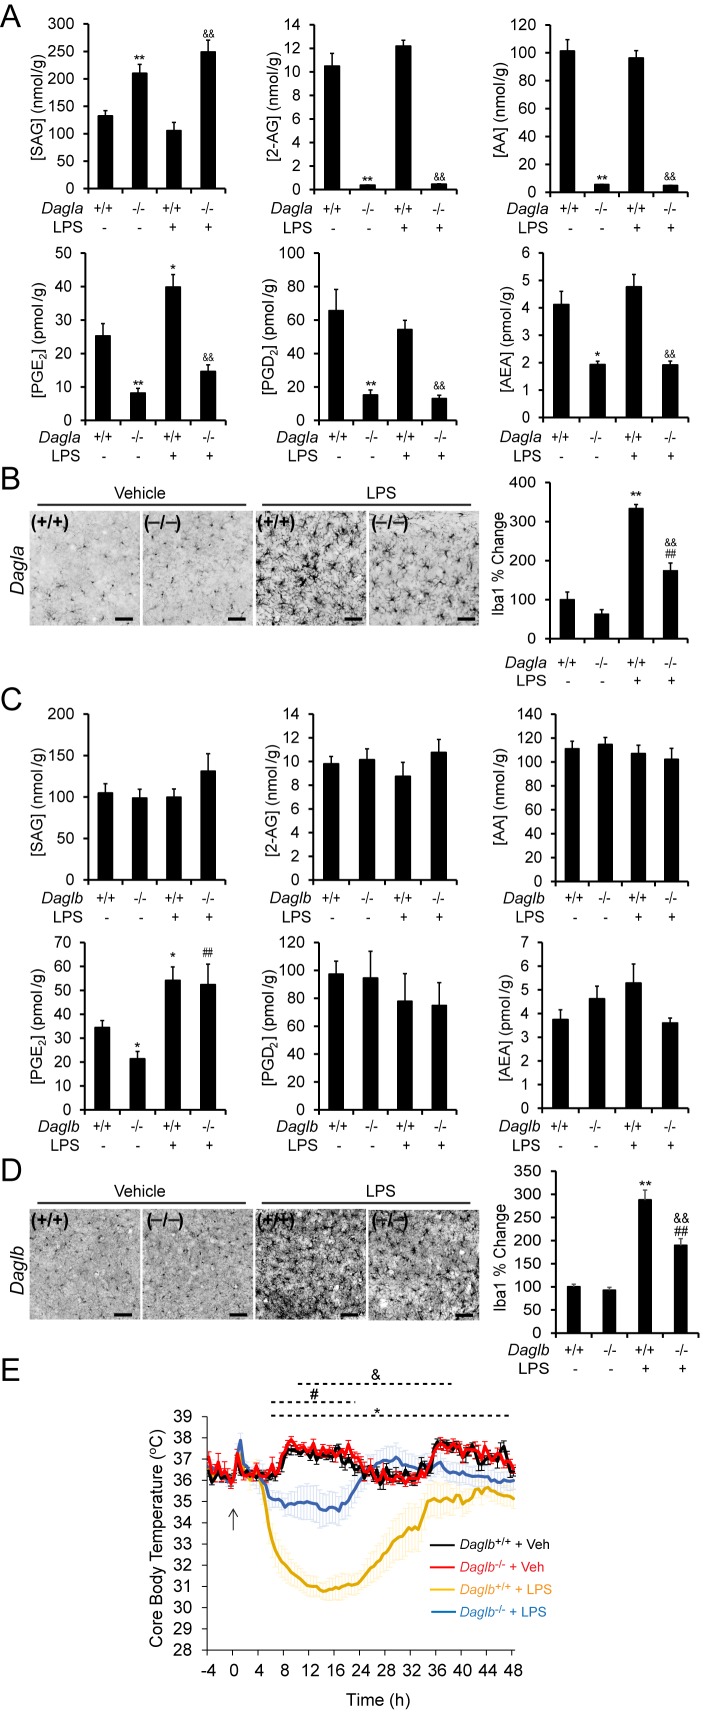
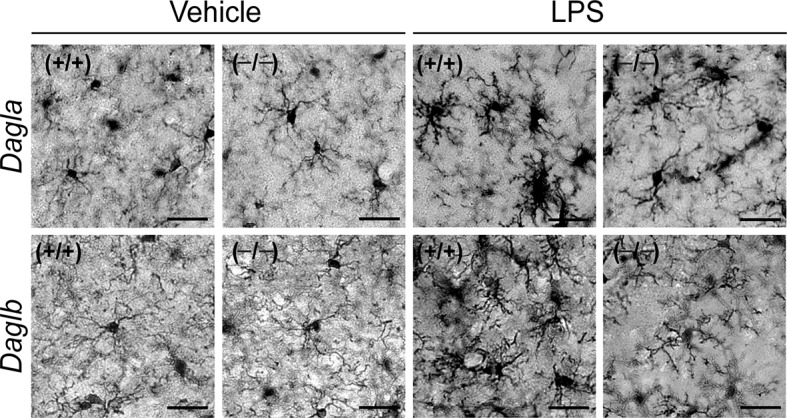
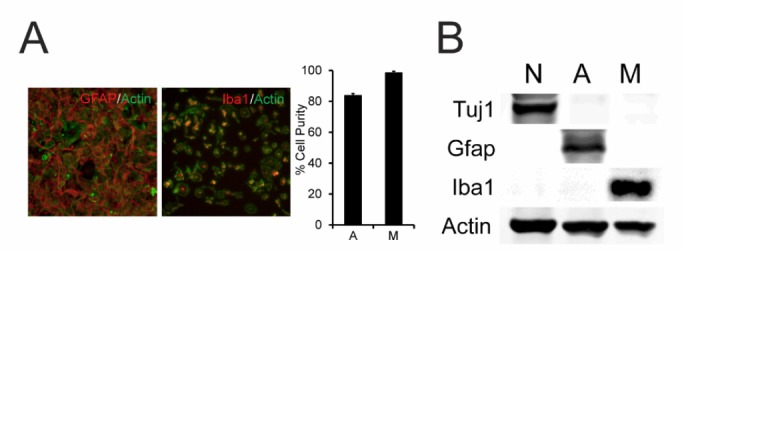
Metabolic specialization among major brain cell types is central to nervous system function and determined in large part by the cellular distribution of enzymes. Serine hydrolases are a diverse enzyme class that plays fundamental roles in CNS metabolism and signaling. Here, we perform an activity-based proteomic analysis of primary mouse neurons, astrocytes, and microglia to furnish a global portrait of the cellular anatomy of serine hydrolases in the brain. We uncover compelling evidence for the cellular compartmentalization of key chemical transmission pathways, including the functional segregation of endocannabinoid (eCB) biosynthetic enzymes diacylglycerol lipase-alpha (DAGLα) and -beta (DAGLβ) to neurons and microglia, respectively. Disruption of DAGLβ perturbed eCB-eicosanoid crosstalk specifically in microglia and suppressed neuroinflammatory events in vivo independently of broader effects on eCB content. Mapping the cellular distribution of metabolic enzymes thus identifies pathways for regulating specialized inflammatory responses in the brain while avoiding global alterations in CNS function.

Keywords: 2-arachidonoylglycerol; biochemistry; chemical proteomics; endocannabinoids; microglia; neuroinflammation; neuroscience.


Conflict of interest statement

BFC: Reviewing editor, eLife.

The other authors declares that no competing interests exist.

Figures

Figure 1.
Figure 1.. Serine hydrolase activity profiles of mouse brain cell types.
(A) Cartoon scheme of gel- and MS-based activity-based protein profiling (ABPP) methods used to measure serine hydrolase activities in primary mouse neurons, astrocytes, and microglia. For gel-based ABPP, a fluorophosphonate (FP) reactive group conjugated to a rhodamine reporter tag (red oval; FP-Rh) is used (Patricelli et al., 2001). For MS-based ABPP (ABPP-MudPIT), an FP reactive group conjugated to a biotin reporter tag (purple diamond; FP-biotin) is used (Liu et al., 1999). (B) Gel-based ABPP of membrane proteomes from different brain cell types. (C) Hierarchically clustered heatmap of ABPP-MudPIT data (left) for serine hydrolases detected in neurons (N), astrocytes (A) and microglia (M). Data represent the mean spectral count values for each serine hydrolase (from four independent experiments) expressed as % of cell type with maximum number of spectral counts (right heatmap shows the maximum spectral counts among cell types for each serine hydrolase). (D) Relationship between serine hydrolase activities, as measured by ABPP-MudPIT, and previously reported mRNA expression for these enzymes, as measured by RNA-Seq (Zhang et al., 2014), in neurons, astrocytes, and microglia. Serine hydrolases showing ≥ three-fold enrichment in activity in a specific cell type as measured by ABPP-MudPIT are shown as filled colored circles and a Pearson’s correlation reported for the aggregate correlation between their ABPP and RNAseq profiles (r = 0.54; p < 0.01). (E) Examples of serine hydrolases where activity and mRNA expression measurements were uncorrelated (ABHD16A, HTRA1) or anti-correlated (MGLL). DOI: http://dx.doi.org/10.7554/eLife.12345.003
Figure 1—figure supplement 1.
Figure 1—figure supplement 1.. Serine hydrolase activity profiles of mouse brain cell types.
(A) Heat map of Pearson’s correlation between spectral count values for serine hydrolases in biologically independent replicates of ABPP-MudPIT experiments performed on mouse primary neurons, astrocytes, and microglia. Each replicate consists of cells derived from 5-10 pooled brains. (B) Cell type enriched serine hydrolases displaying at least two-fold greater number of spectral counts in one cell type compared to the other two. Average spectral counts for neurons, astrocytes, and microglia, as well as fold-enrichment are reported from left to right in the table. (C) Relationship between fold-enrichment and average activity measurements for serine hydrolases in specific cell types. Fold-enrichment values were defined as spectral counts for a serine hydrolase in a given cell type divided by the average spectral count number for that serine hydrolase in all three cell types. Average activity measurements correspond to the mean spectral count for each serine hydrolase within a given cell type (from four replicates). Enzymes that did not meet a two-fold enrichment cutoff for cell type-specific expression are shown in grey. DOI: http://dx.doi.org/10.7554/eLife.12345.005
Figure 1—figure supplement 2.
Figure 1—figure supplement 2.. DAGLβ and ABHD12 activities are enriched in microglia.
(A) Gel-based ABPP analysis of membrane proteomes from different brain cell types using a DAGL-directed probe (HT01) (Hsu et al., 2012) shows enriched DAGLβ activity in microglia. (B) 2-AG hydrolytic activities of neuron, astrocyte, and microglia membrane proteomes derived from Abhd12+/+ and Abhd12–/– mice basally or following pre-treatment with the MGLL inhibitor KML29 (250 nM, 1 hr). While MGLL was found to be the major 2-AG hydrolase in all three brain cell types, the proportion of ABHD12-dependent 2-AG hydrolysis was greater in astrocytes and, in particular, microglia compared to neurons. Data represent average values ± SEM; N = 5 per cell type, genotype, and treatment. *p < 0.05 and **p < 0.01 for Abhd12–/– groups vs corresponding Abhd12+/+ groups. DOI: http://dx.doi.org/10.7554/eLife.12345.006
Figure 2.
Figure 2.. ABHD12 modulates 2-AG content and CBR activation, but not eCB-eicosanoid crosstalk in microglia.
(A,B) Intracellular (A) and secreted (B) 2-AG content in cultured wild type, Abhd12–/– and Mgll–/– neurons, astrocytes, and microglia. Data represent average values ± SEM; N = 4-6 per genotype. **p < 0.01 for Abhd12–/– or Mgll–/– cells vs corresponding wild-type cells. (C,D) Immunoblot (C) and quantification of band density (D) for Erk1/2 phosphorylation, which increases upon 2-AG-mediated activation of CBRs (Walter et al., 2003), in wild-type and Abhd12–/– microglia. Abhd12–/– microglia display hyperphosphorylation of Erk1/2 (lanes 1-4), which can be partially mimicked in Abhd12+/+ cells by addition of exogenous 2-AG (1 μM, 15 min; lanes 9–12) and fully blocked by pre-treatment with CBR1 and CBR2 antagonists (rimonabant and AM630, respectively) (5 µM each, 1 hr pre-treatment; lanes 5-8 and 13-16). N = 4 per genotype and treatment. Immunoblot shows two representative replicate experiments for each group. Data represent average values ± SEM; N = 4 per genotype and treatment; *p < 0.05 and **p < 0.01 for vehicle-treated Abhd12–/– group and 2-AG-treated Abhd12+/+ group vs vehicle-treated Abhd12+/+ group; #p < 0.05 for CBR antagonist-treated Abhd12–/– group vs vehicle-treated Abhd12–/– group; &p < 0.05 and &&p < 0.01 for 2-AG-treated Abhd12–/– or 2-AG/CBR antagonist-treated Abhd12+/+ groups vs 2-AG-treated Abhd12+/+ group; ^p < 0.05 for 2-AG/CBR antagonist-treated Abhd12–/– group vs 2-AG-treated Abhd12–/– group. (E,G) 2-AG, AA, and PGE2/D2 content basally and following exposure to the pro-inflammatory agent LPS (100 ng/mL for 4 hr) in Abhd12–/– and Abhd12+/+ microglia (E) or in wild-type microglia pre-treated with the MGLL inhibitor KML29 (250 nM, 3 hr prior to LPS; G). Data represent average values ± SEM; N = 5 per genotype and treatment. *p < 0.05 and **p < 0.01 for vehicle-treated Abhd12–/– microglia and LPS-treated Abhd12+/+ microglia groups (E) or KML29-treated wild-type microglia and LPS-treated wild type microglia groups (G) vs vehicle-treated Abhd12+/+ microglia or vehicle-treated wild-type microglia groups, respectively; #p < 0.05 and ##p < 0.01 for LPS-treated Abhd12–/– microglia (E) or KML29-treated, LPS-treated wild-type microglia (G) groups vs vehicle-treated Abhd12+/+ microglia or KML29-treated wild-type microglia groups, respectively; &&p < 0.01 for KML29-treated, LPS-treated wild-type microglia group vs LPS-treated wild-type microglia group. (F,H) Cytokine production basally and following exposure to LPS (100 ng/mL for 4 hr) as measured by ELISA in Abhd12–/– and Abhd12+/+ microglia (F) or in wild-type microglia pre-treated with KML29 (250 nM, 3 hr prior to LPS; H). Data represent average values ± SEM; N = 5 per genotype and treatment; **p < 0.01 for LPS-treated Abhd12+/+ microglia (F) or LPS-treated wild-type microglia (H) groups vs vehicle-treated Abhd12+/+ microglia or vehicle-treated wild-type microglia groups, respectively; ##p < 0.01 for LPS-treated Abhd12–/– microglia (F) or KML29-treated, LPS-treated wild-type microglia (G) groups vs vehicle-treated Abhd12–/– or KML29-treated wild-type microglia groups, respectively; &&p < 0.01 for KML29-treated, LPS-treated wild-type microglia group vs LPS-treated wild-type microglia group. DOI: http://dx.doi.org/10.7554/eLife.12345.007
Figure 3.
Figure 3.. DAGLβ is a principal 2-AG biosynthetic enzyme in microglia.
(A–C) 2-AG, AA, and PGE2/D2 content in primary neurons (A), astrocytes (B), and microglia (C) derived from Dagla–/–, Daglb–/– and corresponding wild-type mice. Data represent average values ± SEM; N = 5–8 per genotype. **p < 0.01 for Dagla–/– or Daglb–/– groups vs corresponding wild-type groups. DOI: http://dx.doi.org/10.7554/eLife.12345.008
Figure 3—figure supplement 1.
Figure 3—figure supplement 1.. Pharmacological blockade of DAGLβ modulates eCB/eicosanoid metabolism in microglia.
(A–C) 2-AG (A), AA (B), and PGE2/D2 (C) content in wild-type microglia treated with vehicle, the DAGLβ inhibitors KT109 (500 nM, 4 hr) or KT172 (500 nM, 4 hr), or the inactive control compound (KT195, 500 nM, 4 hr). Data represent average values ± SEM; N = 5 per treatment. **p < 0.01 for inhibitor-treated groups vs corresponding vehicle-treated groups. DOI: http://dx.doi.org/10.7554/eLife.12345.009
Figure 4.
Figure 4.. Genetic or pharmacologic inactivation of DAGLβ impairs LPS-induced eCB-eicosanoid crosstalk and cytokine production in microglia.
(A–C, F–H, K–M, Q–S) 2-AG, AA, and PGE2/D2 content basally and following exposure to LPS (100 ng/mL for 4 hr) in Daglb–/– (A-C), Dagla–/– (F–H) and corresponding wild-type microglia, or in wild-type microglia treated with the DAGL inhibitor-treated KT172 (500 nM, 3 hr prior to LPS; K–M) or an inactive control compound (KT195, 500 nM, 3 hr prior to LPS; Q–S). Data represent average values ± SEM; N = 5 per genotype and treatment. (D,E,I,J,N,O,T,U) Cytokine production basally and following exposure to LPS (100 ng/mL for 4 hr) as measured by ELISA in Daglb–/– (D,E), Dagla/– (I,J) and corresponding wild-type microglia, or in wild-type microglia treated with KT172 (500 nM, 3 hr prior to LPS; N, O) or a KT195 (500 nM, 3 hr prior to LPS; T, U). Data represent average values ± SEM; N = 5 per genotype and treatment. For A–U, **p < 0.01 for Daglb–/– or KT172-treated wild-type microglia or LPS-treated Daglb+/+, Dagla+/+, and wild-type microglia groups vs corresponding vehicle-treated wild-type microglia groups; #p < 0.05 and ##p < 0.01 for LPS-treated Dagl/– or inhibitor (KT172 or KT195)-treated groups vs corresponding vehicle-treated Dagl–/– or inhibitor (KT172 or KT195)-treated groups; &&p < 0.01 for LPS-treated Daglb–/– or LPS-treated, KT172-treated groups vs corresponding LPS-treated Daglb+/+ or LPS-treated, vehicle-treated groups. DOI: http://dx.doi.org/10.7554/eLife.12345.010
Figure 5.
Figure 5.. DAGLβ modulates discrete brain 2-AG pools in vivo.
(A–D) 2-AG (A), SAG (B), AA (C), and PGE2 (D) content in brain tissue from Dagla–/–, Daglb–/– mice and their corresponding wild-type littermates. Data represent average values ± SEM; N = 6-8 mice per genotype. **p < 0.01 for Dagla–/– or Daglb–/– mice vs corresponding wild-type mice. (E) Gel-based ABPP analysis of brain membrane proteomes from Dagla–/– mice following treatment with the MGLL inhibitor MJN110 (i.p. 10 mg/kg, 3 hr) the DAGL inhibitor DO34 (i.p. 100 mg/kg, 2 hr), or sequentially with both inhibitors (DO34, 2 hr; followed by MJN110, 3 hr) using a DAGL-directed probe (HT-01, left) (Hsu et al., 2012) or the broad-spectrum serine hydrolase probe FP-Rh (E, right) (Patricelli et al., 2001). Fluorescent gels are shown in grayscale and 2-AG metabolic enzymes are labeled. (F) Brain 2-AG content from Dagla–/– mice following treatment with the MGLL inhibitor MJN110 (i.p. 10 mg/kg, 3 hr) or sequentially with the DAGL inhibitor DO34 (i.p. 100 mg/kg, 2 hr) and MJN110 (DO34, 2 hr; followed by MJN110, 3 hr). Data represent average values ± SEM; N = 5 per genotype and treatment. **p<0.01 for Dagla–/– groups vs vehicle-treated Dagla+/+ group; ##p < 0.01 for MJN110-treated for Dagla–/– group vs vehicle-treated Dagla–/– group; &&p < 0.01 for DO34 + MJN110-treated Dagla–/– group vs MJN100-treated Dagla–/– group. DOI: http://dx.doi.org/10.7554/eLife.12345.011
Figure 6.
Figure 6.. DAGL blockade attenuates microglial neuroinflammatory responses in vivo.
(A) SAG, 2-AG, AA, PGE2, PGD2 and AEA content in brain tissue from Dagla–/– mice and wild-type littermates basally and following exposure to LPS (i.p., 1 mg/kg once per day for 4 days). Data represent average values ± SEM; N = 5-6 per genotype and treatment. *p < 0.05 and **p < 0.01 for vehicle-treated Dagla–/– group or LPS-treated Dagla+/+ group vs vehicle-treated Dagla+/+ group; &&p < 0.01 LPS-treated Dagla–/– group vs LPS-treated Dagla+/+ group. (B) Representative pictures and quantification of microglial activation assessed by Iba-1 staining (a microglia marker that becomes upregulated during inflammatory activation of these cells) in hippocampal regions from Dagla–/– mice and wild-type littermates basally and following exposure to LPS (i.p., 1 mg/kg once per day for 4 days). Scale bar, 50 µm. Data represent average values ± SEM; N = 6 per genotype and treatment. **p < 0.01 for LPS-treated Dagla+/+ group vs vehicle-treated Dagla+/+ group; ##p < 0.01 for LPS-treated Dagla–/– group vs vehicle-treated Dagla–/– group; &&p < 0.01 for LPS-treated Dagla–/– group vs LPS-treated Dagla+/+ group. (C) SAG, 2-AG, AA, PGE2, PGD2 and AEA content in brain tissue from Daglb–/– mice and wild-type littermates basally and following exposure to LPS (i.p., 1 mg/kg once per day for 4 days). Data represent average values ± SEM; N = 5-6 per genotype and treatment. *p < 0.05 for vehicle-treated Daglb–/– group or LPS-treated Daglb+/+ group vs vehicle-treated Daglb+/+ group; ##p < 0.01 for LPS-treated Daglb–/– group vs vehicle-treated Daglb–/– group. (D) Representative pictures and quantification of microglial activation assessed by Iba-1 staining (a microglia marker that becomes upregulated during inflammatory activation of these cells) in hippocampal regions from Daglb–/– mice and wild-type littermates basally and following exposure to LPS (i.p., 1 mg/kg once per day for 4 days). Scale bar, 50 µm. Data represent average values ± SEM; N = 6 per genotype and treatment. **p < 0.01 for LPS-treated Daglb+/+ group vs vehicle-treated Daglb+/+ group; ##p < 0.01 for LPS-treated Daglb–/– group vs vehicle-treated Daglb–/– group; &&p < 0.01 for LPS-treated Daglb–/– group vs LPS-treated Daglb+/+ group. (E) Time course of body temperature changes in Daglb+/+ and Daglb–/– mice following LPS (10 mg/kg, i.p.)-induced anapyrexia. Data represent average values ± SEM; N = 6 mice per genotype and treatment. *p < 0.05 for Daglb+/+ + Veh vs Daglb+/+ + LPS groups; #p < 0.05 for Daglb–/– + Veh vs Daglb–/– + LPS groups; &p < 0.05 for Daglb+/+ + LPS vs Daglb–/– + LPS groups. DOI: http://dx.doi.org/10.7554/eLife.12345.012
Figure 6—figure supplement 1.
Figure 6—figure supplement 1.. DAGL inactivation attenuates LPS-induced microglial activation.
Representative pictures of microglial activation assessed by Iba-1 staining (a microglia marker that becomes upregulated during inflammatory activation of these cells) in hippocampal regions from Dagla–/–, Daglb–/– and wild-type mice basally and following exposure to LPS (i.p., 1 mg/kg once per day for 4 days). Scale bar, 20 µm. DOI: http://dx.doi.org/10.7554/eLife.12345.013
Author response image 1.
DOI: http://dx.doi.org/10.7554/eLife.12345.015

Similar articles

Cited by

References

    1. Aguzzi A, Barres BA, Bennett ML. Microglia: scapegoat, saboteur, or something else? Science. 2013;339:156–161. doi: 10.1126/science.1227901. - DOI - PMC - PubMed
    1. Barres BA. The mystery and magic of glia: a perspective on their roles in health and disease. Neuron. 2008;60:430–440. doi: 10.1016/j.neuron.2008.10.013. - DOI - PubMed
    1. Bélanger M, Allaman I, Magistretti PJ. Brain energy metabolism: focus on astrocyte-neuron metabolic cooperation. Cell Metabolism. 2011;14:724–738. doi: 10.1016/j.cmet.2011.08.016. - DOI - PubMed
    1. Bell-Temin H, Barber DS, Zhang P, Liu B, Stevens SM. Proteomic analysis of rat microglia establishes a high-confidence reference data set of over 3000 proteins. PROTEOMICS. 2012;12:246–250. doi: 10.1002/pmic.201100398. - DOI - PubMed
    1. Beutner C, Linnartz-Gerlach B, Schmidt SV, Beyer M, Mallmann MR, Staratschek-Jox A, Schultze JL, Neumann H. Unique transcriptome signature of mouse microglia. Glia. 2013;61:1429–1442. doi: 10.1002/glia.22524. - DOI - PubMed

Publication types