. 2016 Feb;22(2):146-53.
doi: 10.1038/nm.4027. Epub 2016 Jan 18.

Neutrophil extracellular traps enriched in oxidized mitochondrial DNA are interferogenic and contribute to lupus-like disease

Affiliations

Neutrophil extracellular traps enriched in oxidized mitochondrial DNA are interferogenic and contribute to lupus-like disease

Christian Lood et al. Nat Med. 2016 Feb.

Abstract

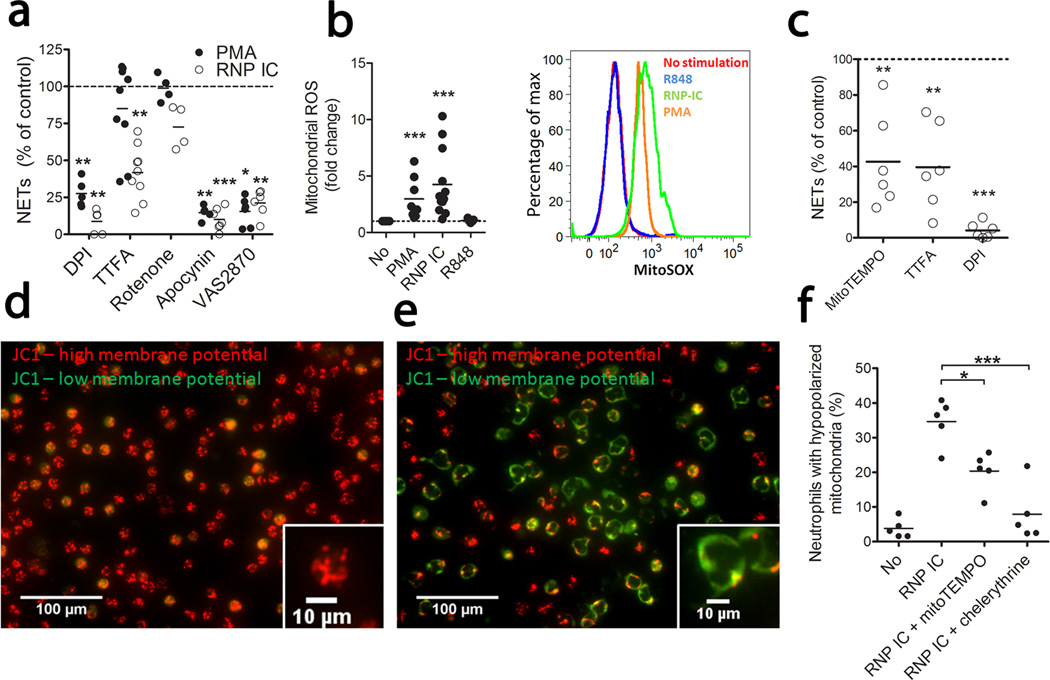
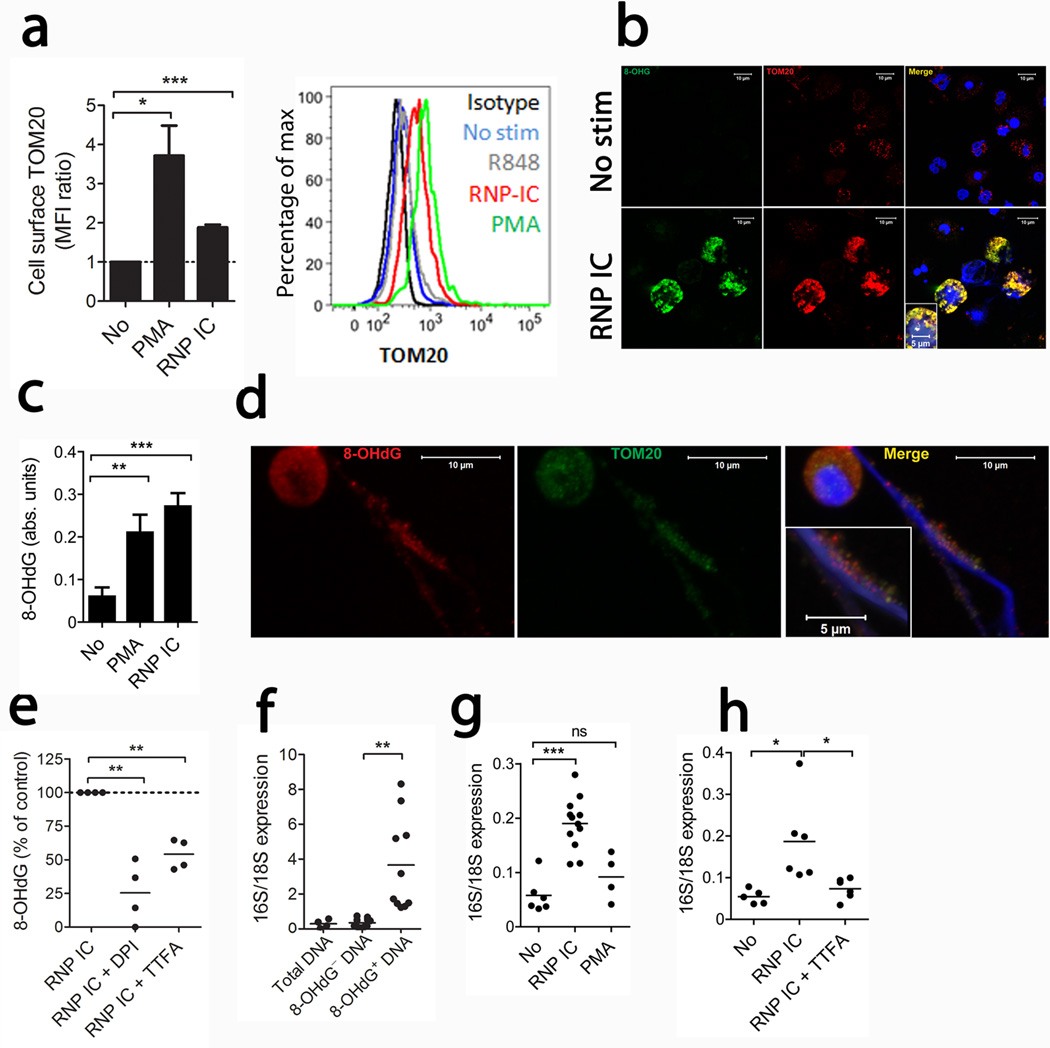
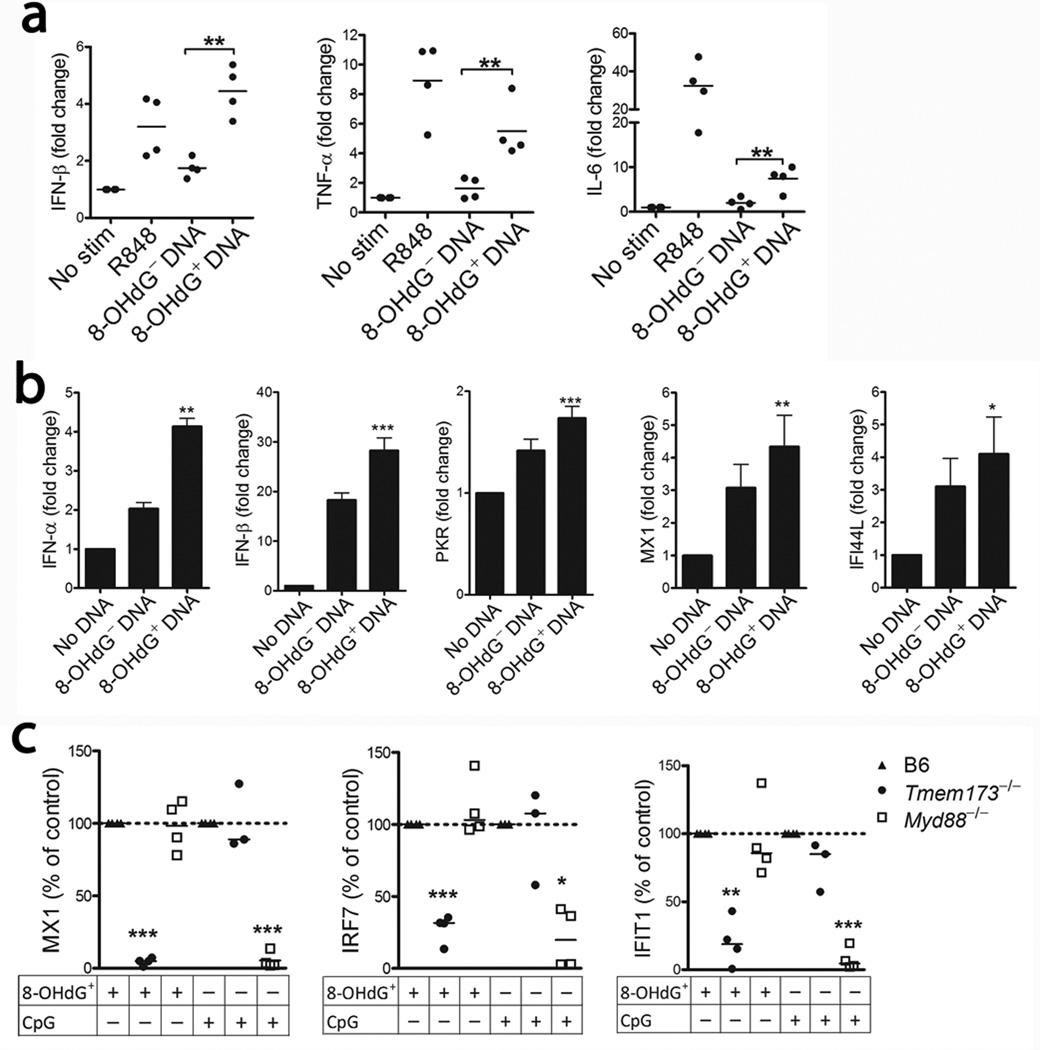
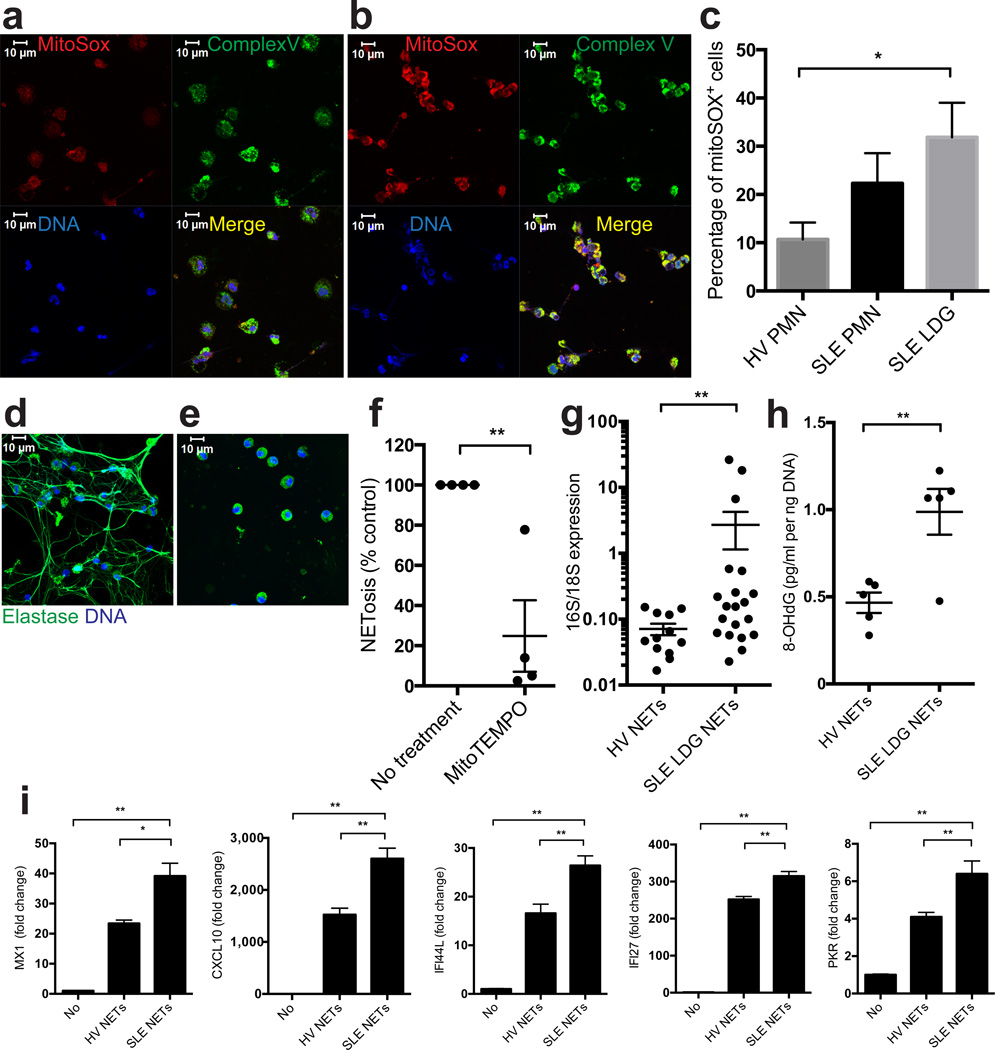
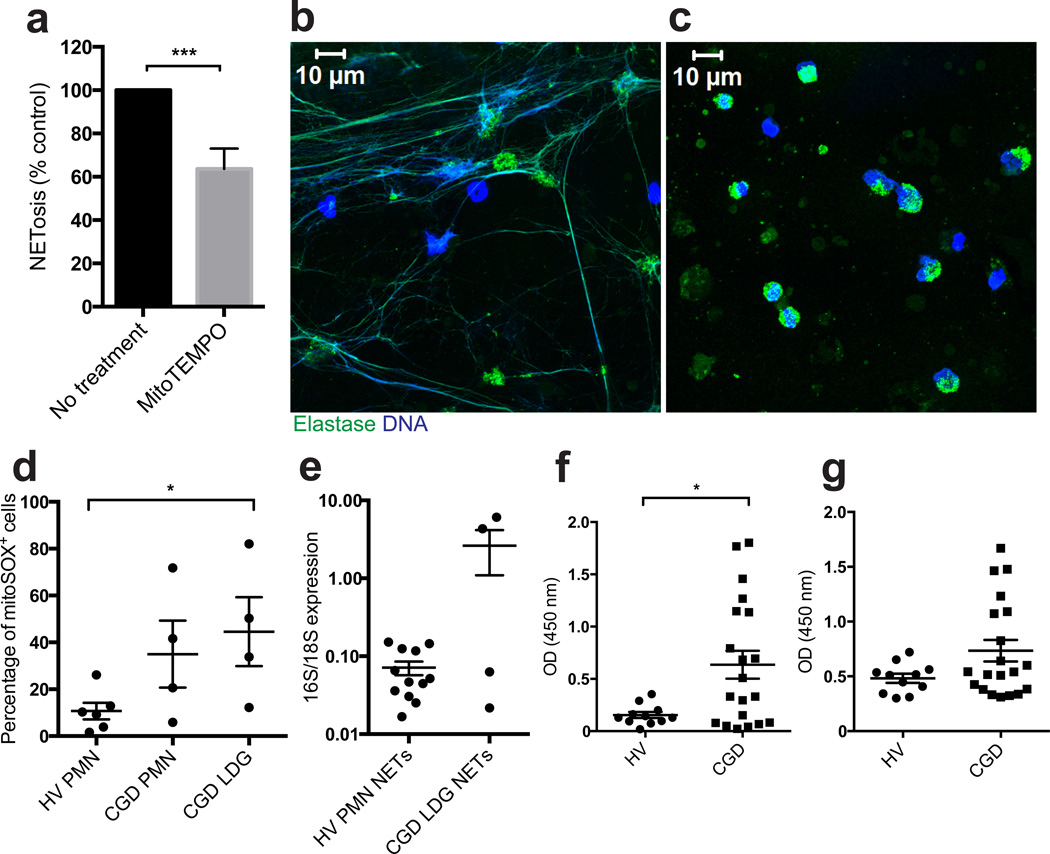
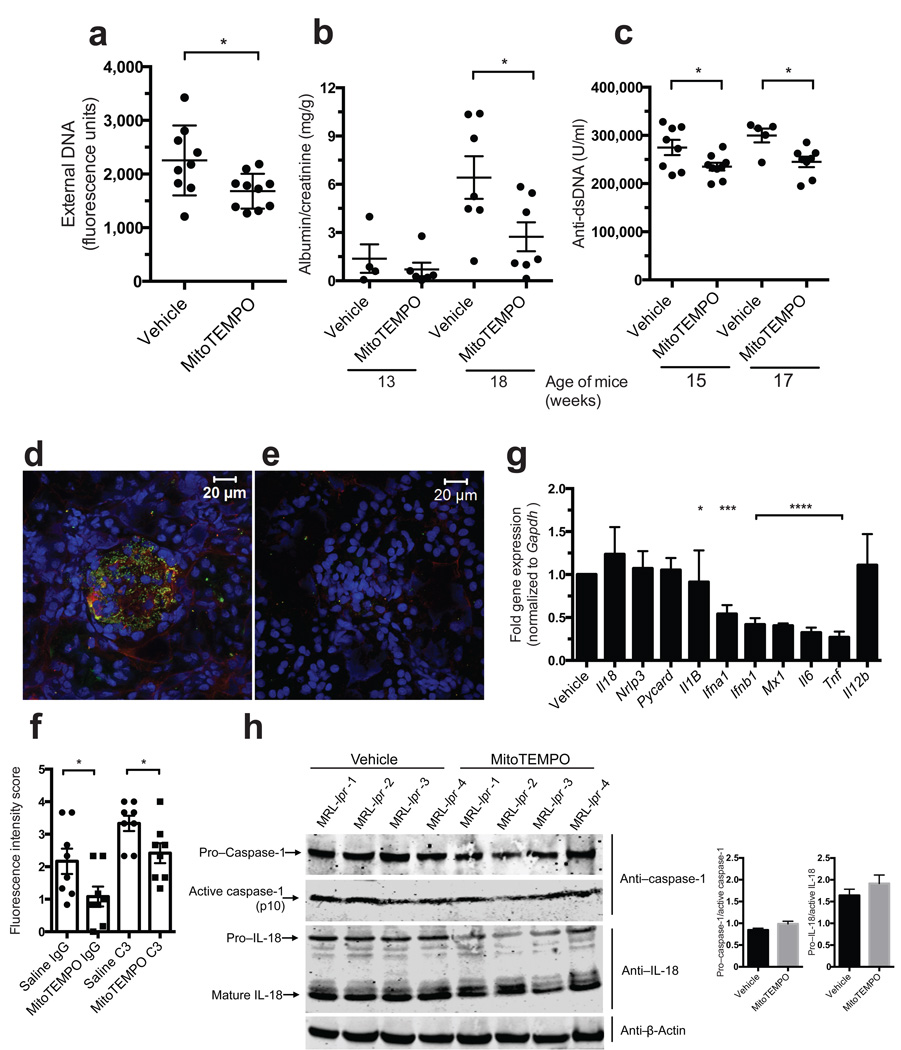
Neutrophil extracellular traps (NETs) are implicated in autoimmunity, but how they are generated and their roles in sterile inflammation remain unclear. Ribonucleoprotein immune complexes (RNP ICs), inducers of NETosis, require mitochondrial reactive oxygen species (ROS) for maximal NET stimulation. After RNP IC stimulation of neutrophils, mitochondria become hypopolarized and translocate to the cell surface. Extracellular release of oxidized mitochondrial DNA is proinflammatory in vitro, and when this DNA is injected into mice, it stimulates type I interferon (IFN) signaling through a pathway dependent on the DNA sensor STING. Mitochondrial ROS are also necessary for spontaneous NETosis of low-density granulocytes from individuals with systemic lupus erythematosus. This was also observed in individuals with chronic granulomatous disease, who lack NADPH oxidase activity but still develop autoimmunity and type I IFN signatures. Mitochondrial ROS inhibition in vivo reduces disease severity and type I IFN responses in a mouse model of lupus. Together, these findings highlight a role for mitochondria in the generation not only of NETs but also of pro-inflammatory oxidized mitochondrial DNA in autoimmune diseases.


Conflict of interest statement

The authors have declared that no conflicts of interest exist.

Figures

Figure 1
Figure 1. Mitochondrial ROS supports RNP IC-mediated NETosis
(a) Quantification of neutrophil DNA release upon activation with PMA or RNP ICs with or without shown inhibitors added. Results are expressed as DNA release as compared to no inhibitor added (100%) and displayed as median of 4 (Rotenone), 5 (DPI, apocynin), 6 (VAS2870) or 9 (TTFA) independent experiments. (b) Mitochondrial ROS (MitoSOX) following activation of neutrophils with the stimuli shown (fold change left panel and histogram right panel) of 8 (PMA), 12 (RNP IC) and 5 (R848) independent experiments as compared to non-stimulated neutrophils. (c) Neutrophils from SLE subjects (n = 6) were stimulated with RNP ICs in the presence of indicated ROS inhibitor. Results are expressed as in (a). Mitochondrial membrane potential (MMP) in (d) non-activated or (e) RNP IC-activated neutrophils from healthy individuals. The figures are representative of 3 independent experiments. (f) Hypopolarized neutrophils (JC-1 green+/JC-1 red) upon RNP IC activation in presence of the ROS scavenger MitoTEMPO or the PKC inhibitor chelerythrine chloride. The results are the mean of 5 (No), 3 (R848), or 5 (RNP IC, and RNP IC with MitoTEMPO or Chelerythrine) independent experiments. For statistical analyses, a 2-sided paired t-test was used where * P< 0.05, **P < 0.01 and *** P < 0.001. P-values are adjusted for multiple comparisons; five for (a), three for (c) and two for (f), using Bonferroni correction.
Figure 2
Figure 2. RNP ICs induce mitochondria mobilization and release of oxidized DNA
(a) Cell surface staining of TOM20 in non-fixed cells is shown expressed as TOM20 mean fluorescence intensity (MFI) ratio as compared to non-stimulated neutrophils (n = 7 in each group, statistics by paired t-test). (b) Representative immunofluorescence images of non-permeabilized neutrophils stimulated with or without RNP ICs stained for cell surface expression of TOM20 (red), 8-OHdG (green) and Hoechst (blue) to detect DNA. The images are representative of 3 independent experiments. (c) Quantification of 8-OHdG content in NETs by ELISA with results expressed as absorbance units (n= 8, 5 and 6 for no, PMA and RNP ICs, respectively, statistics by t-test). (d) Confocal microscopy of RNP IC-induced NETs stained with TOM20 (green), 8-OHdG (red) and Hoechst (blue). The images are representative of 3 independent experiments. (e) Quantification of 8-OHdG content in neutrophils in presence of ROS inhibitors. Results are presented as % of control from 4 independent experiments and analyzed by paired t-test. (f) Quantification of 16S and 18S mRNA from immunoprecipitated DNA. The results are reported as the mean of the 16S/18S expression from 4 (total DNA) and 10 independent experiments and analyzed by paired t-test. (g) Quantification of NET-derived 16S and 18S DNA from 6 (No), 12 (RNP IC) and 4 (PMA) and (h) 5 (No), 6 (RNP IC) and 7 (RNP IC+TTFA) independent experiments analyzed by t-test with *P < 0.05, **P < 0.01 and *** P < 0.001.
Figure 3
Figure 3. Oxidized DNA enhances the inflammatory response in a STING-dependent manner
Cytokine mRNA levels upon incubation of 8-OHdG+ or 8-OHdG DNA with (a) human PBMCs or (b) THP1 cells. The results are expressed as the mean of 4 (a) or mean ± SEM of 5 (b) independent experiments. The 8-OHdG+ DNA is compared to the 8-OHdG DNA and analyzed by paired t-test. (c) Analysis of splenic ISG expression in B6 (n = 7), Tmem173−/− (n = 7), and Myd88−/− mice (n = 8) injected with DNA-DOTAP complex. The data are from two independent experiments and results expressed as median of the relative ISG induction as compared to WT mice within each experiment with *P<0.05, **P<0.01 and *** P<0.001.
Figure 4
Figure 4. SLE LDGs release oxidized mitDNA in a mitochondrial superoxide-dependent manner
(a–c) Mitochondrial ROS synthesis is enhanced in SLE LDGs. Non-stimulated NDGs from (a) healthy control or (b) SLE LDGs stained with MitoSOX (red), mitochondrial complex-V subunit D (green) and DNA (Hoechst 33342). Results are representative of 3 independent experiments. (c) Mitochondrial ROS quantification (MitoSOX) by flow cytometry in non-stimulated healthy control NDGs (n = 6) and SLE NDGs and LDGs (n= 7/group). (d–f) LDG NETosis is inhibited by mitochondrial ROS scavengers. Representative images of 5 independent experiments depict maximum intensity projections of a z scan of lupus LDGs incubated for 90 min in the absence (d) or presence (e) of MitoTEMPO. Green represents HNE and blue represents DNA (Hoechst). (f) Spontaneous NET formation in lupus LDGs (n=4) in the presence or absence of MitoTEMPO and TTFA. (g) Relative mitochondrial (16S)/chromosomal (18S) ratio in NET DNA (n = 12 for control NDGs, n = 20 for lupus LDGs). (h) 8-OHdG content in NET DNA (n = 5 in each group). (i) ISG mRNA levels at 20 hours in THP-1 cells transfected with DNA purified from SLE LDGs NETs (SLE NETs, n = 3) or from healthy control NDGs NETs induced by A23187 (HV NETs, n = 2). Results are the mean ± SEM of at least 3 independent experiments. For the statistical analyses, 2-sided unpaired t-test (c,h) and Mann Whitney U test (f–i), were used; * P< 0.05; ** P < 0.01.
Figure 5
Figure 5. LDGs from CGD individuals release NETs in a mitochondrial superoxide-dependent manner
NETosis in CGD LDGs (n = 5) is inhibited by MitoTEMPO as assessed (a) by the Sytox Orange/PicoGreen ratio and (b–c) by fluorescence microscopy. Green is HNE and blue is DNA (Hoechst). Results are representative of 5 individuals. (d) Mitochondrial superoxide production is increased in CGD LDGs. Results are expressed as % positive cells (mean ± SEM, n = 6 and 4 for healthy controls and CGD individuals, respectively). (e) Mitochondrial (16S) / chromosomal (18S) ratio is increased in NET DNA isolated from CGD individuals (n = 4) compared to healthy controls (n = 12). (f) DNA-MPO complexes and (g) DNA-HNE complexes are increased in plasma from CGD individuals (n=20) compared to healthy volunteers (HV, n=11). For statistical analyses, Mann-Whitney test (a, d and e) and unpaired t-test (f) were used; * P < 0.05, ***P < 0.001.
Figure 6
Figure 6. In vivo administration of a mito-ROS scavenger attenuates lupus-like disease in mice
Effect of 7-week continuous, systemic administration of MitoTEMPO versus vehicle on the phenotype of female MRL/lpr mice (n = 10/ group). (a) Spontaneous NETosis in bone marrow neutrophils at euthanasia quantified by Sytox plate assay in triplicate. (b) Albumin: creatinine ratio at 13 and 17 weeks of age. (c) Anti-dsDNA levels quantified at 15 and 17 weeks of age. IgG (red) and complement C3 (green) deposition in glomeruli of (d) vehicle and (e) MitoTEMPO treated mice harvested at euthanasia. Nuclei were stained blue with Hoechst. (f) Fluorescence intensity scored in renal tissue sections from 8 vehicle- and 8 MitoTEMPO-treated mice. (g) Gene expression in MRL/lpr splenocytes at euthanasia. Results represent mean ± SEM of 10 mice / group and bar graph results represent downregulation adjusted for results found in vehicle-treated mice (normalized to a value of 1). (h) Total and active caspase-1 and IL-18 in renal protein extracts; beta-actin is loading control. Each line depicts an individual mouse treated with either saline or MitoTEMPO as indicated in the figure. Bar graphs show densitometry data for caspase-1 and IL-18 activation ratios. For statistical analysis, unpaired t-test (a, c, f), Mann-Whitney (g, f); * P < 0.05, *** P < 0.001, ****P < 0.0001.

Comment in

Similar articles

Cited by

References

    1. Nathan C. Neutrophils and immunity: challenges and opportunities. Nat Rev Immunol. 2006;6:173–182. - PubMed
    1. Kolaczkowska E, Kubes P. Neutrophil recruitment and function in health and inflammation. Nat Rev Immunol. 2013;13:159–175. - PubMed
    1. Brinkmann V, et al. Neutrophil extracellular traps kill bacteria. Science. 2004;303:1532–1535. - PubMed
    1. Garcia-Romo GS, et al. Netting neutrophils are major inducers of type I IFN production in pediatric systemic lupus erythematosus. Sci Transl Med. 2011;3:73ra20. - PMC - PubMed
    1. Villanueva E, et al. Netting neutrophils induce endothelial damage, infiltrate tissues, and expose immunostimulatory molecules in systemic lupus erythematosus. J Immunol. 2011;187:538–552. - PMC - PubMed

Methods-only references

    1. Tan EM, et al. The 1982 revised criteria for the classification of systemic lupus erythematosus. Arthritis Rheum. 1982;25:1271–1277. - PubMed
    1. Kuhns DB, et al. Residual NADPH oxidase and survival in chronic granulomatous disease. N Engl J Med. 2010;363:2600–2610. - PMC - PubMed
    1. Olferiev M, Lliguicota M, Kirou KA, Crow MK. Measuring interferon alpha and other cytokines in SLE. Methods Mol Biol. 2014;1134:131–150. - PubMed
    1. Ahmad S, Ghosh A, Nair DL, Seshadri M. Simultaneous extraction of nuclear and mitochondrial DNA from human blood. Genes Genet Syst. 2007;82:429–432. - PubMed
    1. Ishikawa H, Ma Z, Barber GN. STING regulates intracellular DNA-mediated, type I interferon-dependent innate immunity. Nature. 2009;461:788–792. - PMC - PubMed

Publication types

MeSH terms