. 2016 Apr;25(4):926-32.
doi: 10.1002/pro.2883. Epub 2016 Feb 8.

On the reliability of peptide nonplanarity seen in ultra-high resolution crystal structures

Affiliations

On the reliability of peptide nonplanarity seen in ultra-high resolution crystal structures

Andrew E Brereton et al. Protein Sci. 2016 Apr.

Abstract

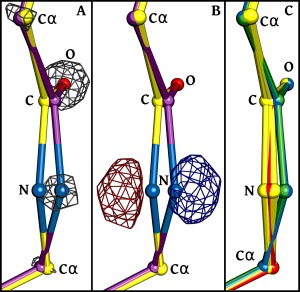
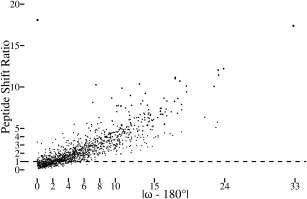
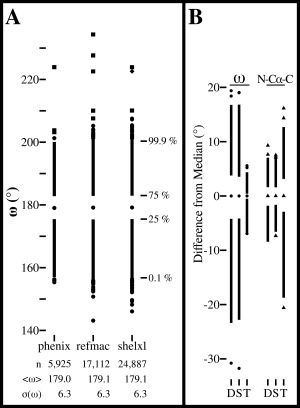
Ultra-high resolution protein crystal structures have been considered as relatively reliable sources for defining details of protein geometry, such as the extent to which the peptide unit deviates from planarity. Chellapa and Rose (Proteins 2015; 83:1687) recently called this into question, reporting that for a dozen representative protein structures determined at ∼ 1 Å resolution, the diffraction data could be equally well fit with models restrained to have highly planar peptides, i.e. having a standard deviation of the ω torsion angles of only ∼ 1° instead of the typically observed value of ∼ 6°. Here, we document both conceptual and practical shortcomings of that study and show that the more tightly restrained models are demonstrably incorrect and do not fit the diffraction data equally well. We emphasize the importance of inspecting electron density maps when investigating the agreement between a model and its experimental data. Overall, this report reinforces that modern standard refinement protocols have been well-conceived and that ultra-high resolution protein crystal structures, when evaluated carefully and used with an awareness of their levels of coordinate uncertainty, are powerful sources of information for providing reliable information about the details of protein geometry.

Keywords: atomic resolution; model validation; peptide nonplanarity; phenix refinement; protein crystallography; protein geometry.


Figures

Figure 1
Figure 1
Evidence from electron density that tight ω‐restraints lead to incorrect models. Backbone atoms (labeled C, N, O, and Cα) of the peptide unit between residues 189 and 190 of PDB‐ID 2CWS are shown for multiple models, using atom coloring (oxygen—red; nitrogen—blue; carbon—as defined for each model). (A) The model resulting from refinement using tight ω‐restraints (yellow carbons; ω = 175.6°) is shown along with its 2Fo‐Fc electron density (grey mesh; contoured at 7.5 × ρ rms), revealing that the N‐atom is clearly placed incorrectly. Additionally shown is the model resulting from refinement using standard ω‐restraints (purple carbons; ω = 147.2°) which does fit the electron density well. (B) The same structures are shown with the Fo‐Fc difference electron density also calculated using the tightly‐restrained model. Negative (red mesh) and positive (blue mesh) density are contoured at ±7.5 × ρ rms. (C) Shown are the models from 10 pairs of independent refinements done either using tight ω‐restraints (yellow) or standard ω‐restraints (blue). The deposited model (green) and the model refined by CR21 (red) are also shown.
Figure 2
Figure 2
Significant atomic shifts are caused by tight ω restraints. Plotted for each peptide in the dozen test structures is the peptide shift ratio (defined below) as a function of the degree to which ω deviates from 180° in the standard refinement. For each atom in a structure refined using standard restraints, the standard uncertainty in the position of each atom4 was estimated using the Online_DPI webserver.26 Also, the shift for each atom between the standard vs. tight ω refined structures was calculated. Noting that the tight restraints often lead mostly to shifts in the central C, O, and N atoms of a peptide (e.g. Fig. 1), we defined a “peptide shift ratio” for each peptide as the rms of the shifts of the three central atoms in the peptide (i.e. Oi‐1, Ci‐1, and Ni) divided by the rms of the estimated standard uncertainties of the same three atoms. A value of 1 means that the rms shift in the atom positions is equal to the uncertainty in the positions of those atoms. The most nonplanar residue in the dataset is the 2CWS 189‐190 peptide shown in Figure 1. The one outlier in the plot is the 179 to 180 peptide from PDB entry 3QL9 with an ω angle in the standard refinement that is only 0.1° from planar but for which the backbone oxygen shifts ∼0.4 Å to yield a peptide shift ratio of ∼18. This can be rationalized in that this peptide oxygen has high anisotropy and that the method used to estimate the positional uncertainty does not take the anisotropy into account.26
Figure 3
Figure 3
ω‐angle distributions from three refinement programs and distortion of the N‐Cα‐C angle caused by the tight ω restraints. (A) ω‐angle distributions for 40, 92, and 137 structures identified by CR21 as having been refined at ≤1 Å resolution by Phenix, Refmac and SHELX, respectively (lists provided in Supporting Information files). For each refinement package (identified by name), the number of refined residues, the mean and standard deviation of ω, and a Tufte boxplot27 are shown. In each boxplot, the central dot marks the median, the upper line extends from the 75th percentile to the 99.9th percentile, the lower line extends from the 25th to the 0.1st percentile and the most extreme 0.1% of observations at each end are shown as individual circles, squares or diamonds. For each distribution, observations were manually checked for the quality of the fit to their electron density starting with the furthest outlier and continuing until a reliably modeled example was found. Observations were categorized as incorrect (squares), unable to be assessed due to unavailable data (diamonds), or reliable (circles). (B). Tufte boxplots27 showing the distributions of the ω (circles) and N‐Cα‐C (triangles) angles relative to their median values for residues in the dozen test structures. The left plots show ω for the structures as deposited (D), and re‐refined using standard (S) or tight (T) ω‐restraints, and the right plots similarly show the N‐Cα‐C angles. Standard deviations for the ω distributions are: 6.5°, 6.5°, and 1.0°. For the N‐Cα‐C angle distributions the standard deviations are 2.5°, 2.3°, and 4.6°.

Comment in

  • How planar are planar peptide bonds?
    Matthews BW. Matthews BW. Protein Sci. 2016 Apr;25(4):776-7. doi: 10.1002/pro.2901. Epub 2016 Mar 1. Protein Sci. 2016. PMID: 26888078 Free PMC article. No abstract available.

References

    1. Dauter Z, Lamzin VS, Wilson KS (1995) Proteins at atomic resolution. Curr Opin Struct Biol 5:784–790. - PubMed
    1. Wlodawer A, Minor W, Dauter Z, Jaskolski M (2008) Protein crystallography for non‐crystallographers, or how to get the best (but not more) from published macromolecular structures. FEBS J 275:1–21. - PMC - PubMed
    1. Dauter Z, Lamzin VS, Wilson KS (1997) The benefits of atomic resolution. Curr Opin Struct Biol 7:681–688. - PubMed
    1. Cruickshank DWJ (1999) Remarks about protein structure precision. Acta Crystallogr D55:583–601. - PubMed
    1. Wilson K, Butterworth S, Dauter Z, Lamzin V, Walsh M, Wodak S, Pontius J, Richelle J, Vaguine A, Sander C, Hooft RWW, Vriend G, Thornton JM, Laskowski RA, MacArthur MW, Dodson EJ, Murshudov G, Oldfield TJ, Kaptein R, Rullmann JAC (1998) Who checks the checkers? Four validation tools applied to eight atomic resolution structures. J Mol Biol 276:417–436. - PubMed

Publication types

LinkOut - more resources