. 2016 Feb;34(2):184-191.
doi: 10.1038/nbt.3437. Epub 2016 Jan 18.

Optimized sgRNA design to maximize activity and minimize off-target effects of CRISPR-Cas9

Affiliations

Optimized sgRNA design to maximize activity and minimize off-target effects of CRISPR-Cas9

John G Doench et al. Nat Biotechnol. 2016 Feb.

Abstract

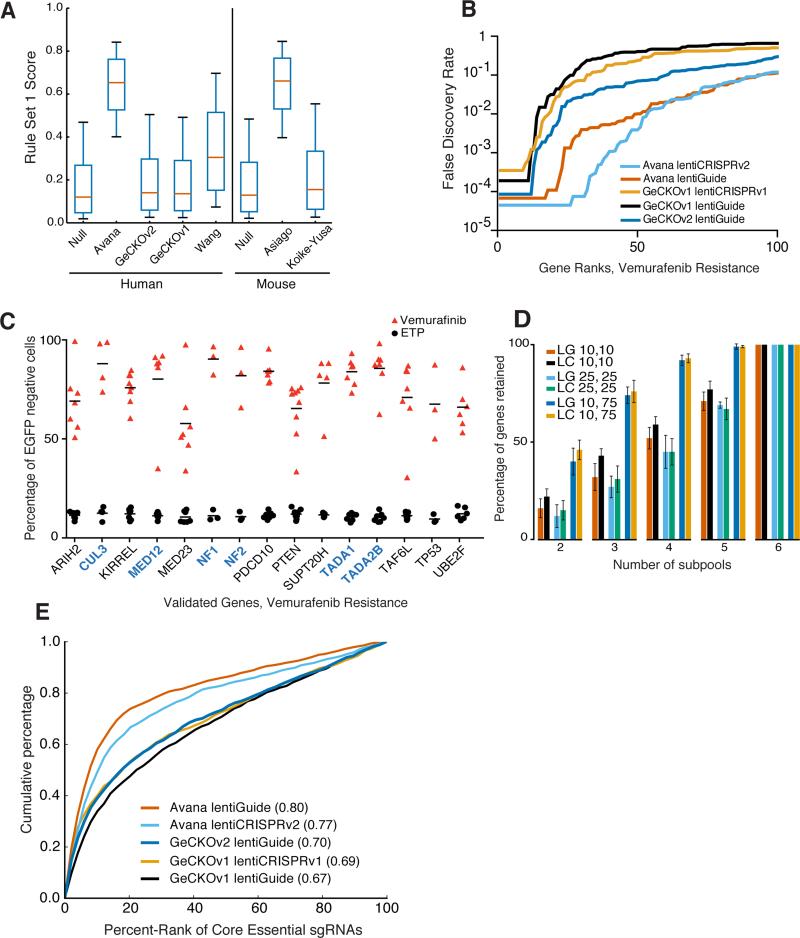
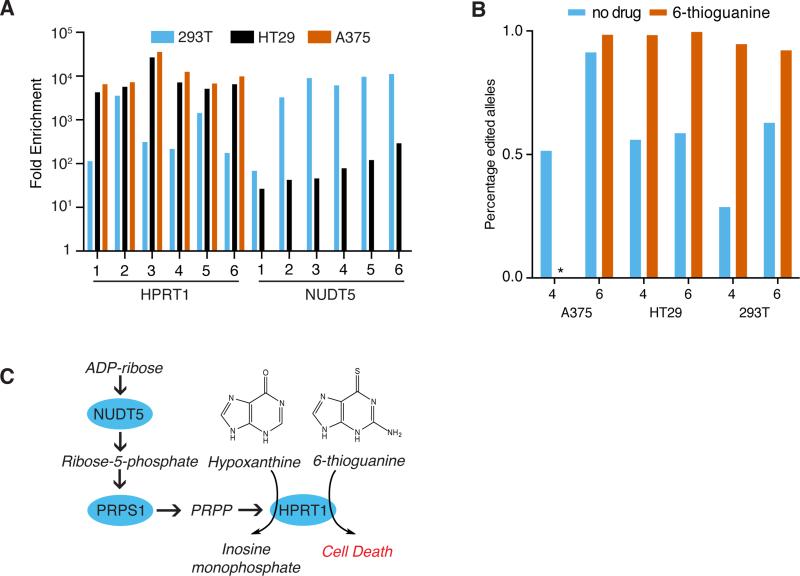
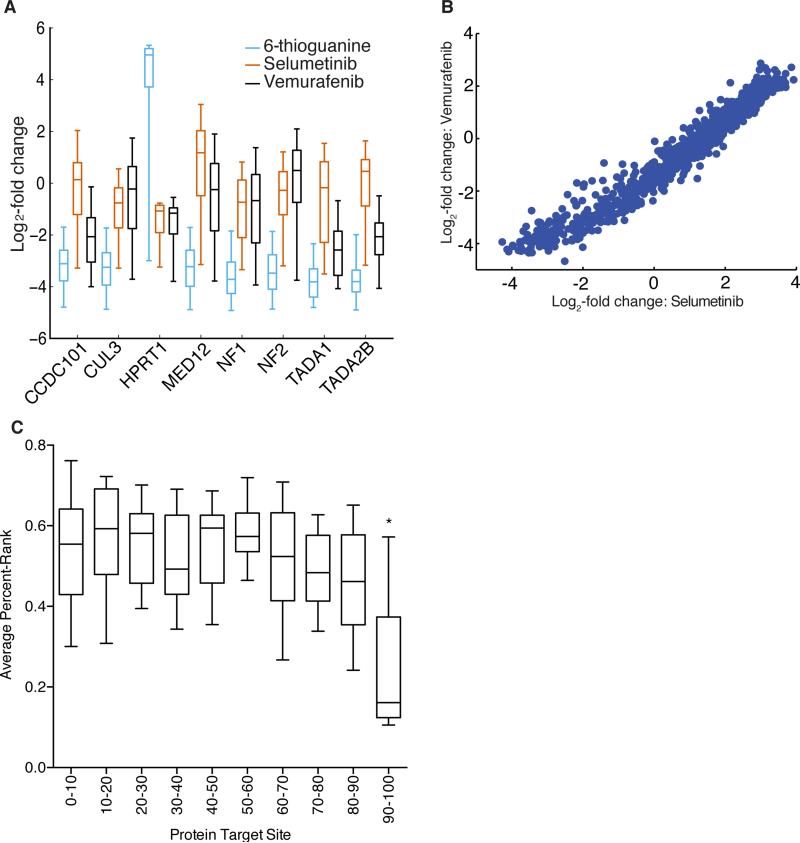
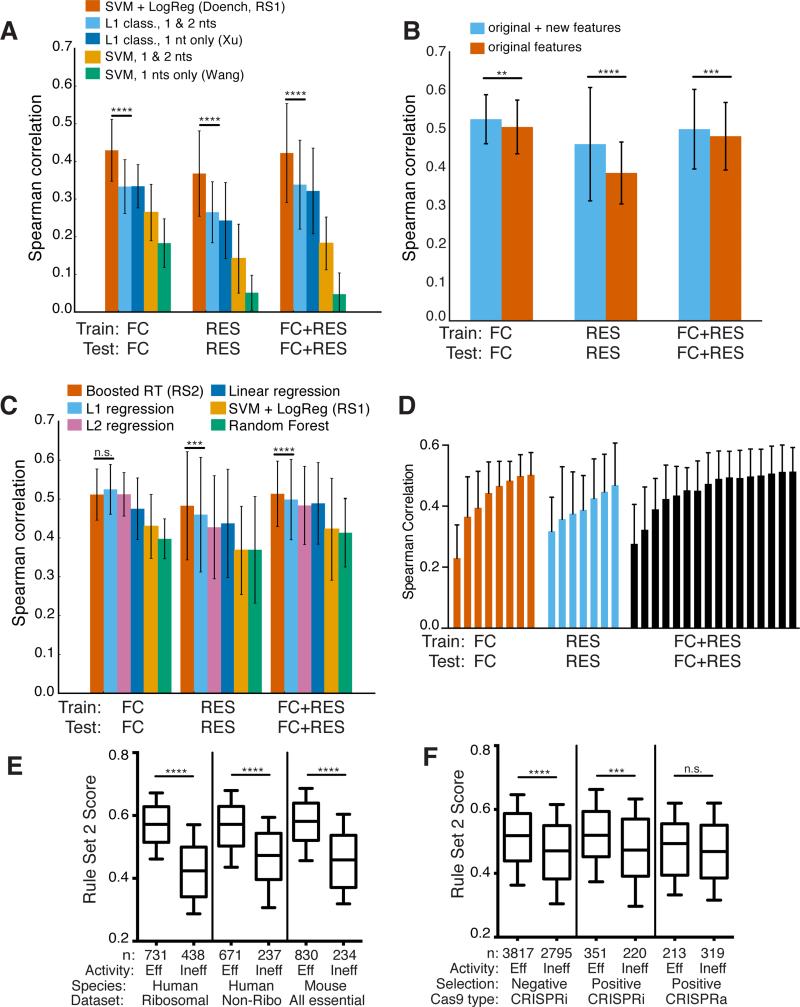
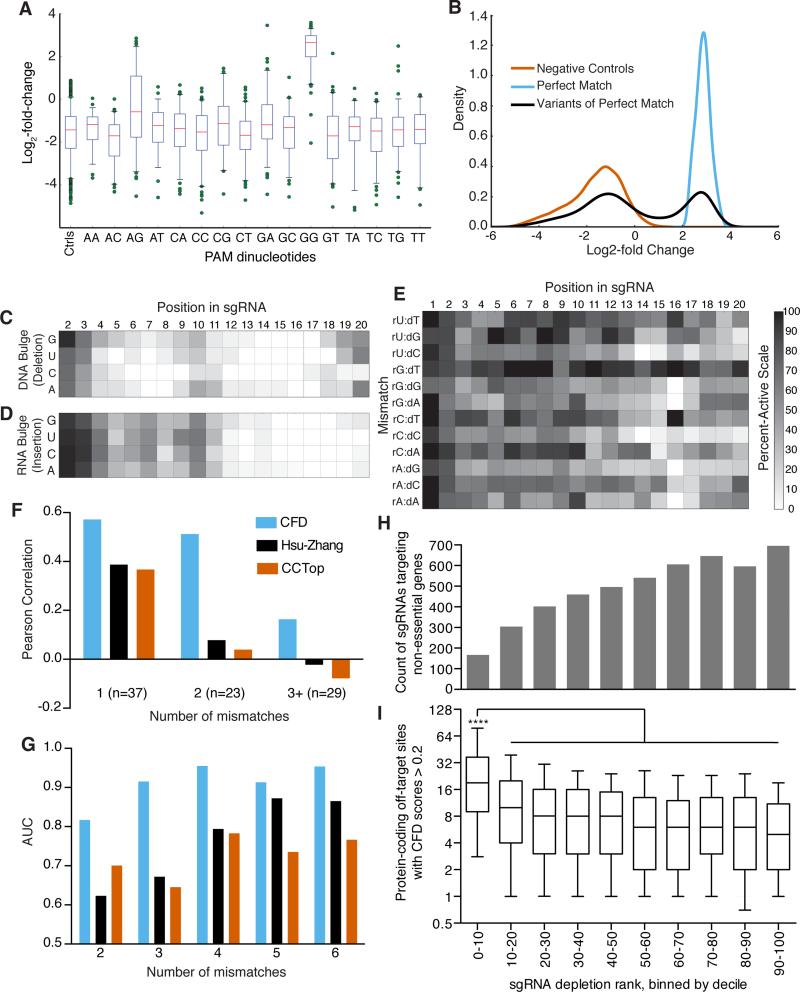
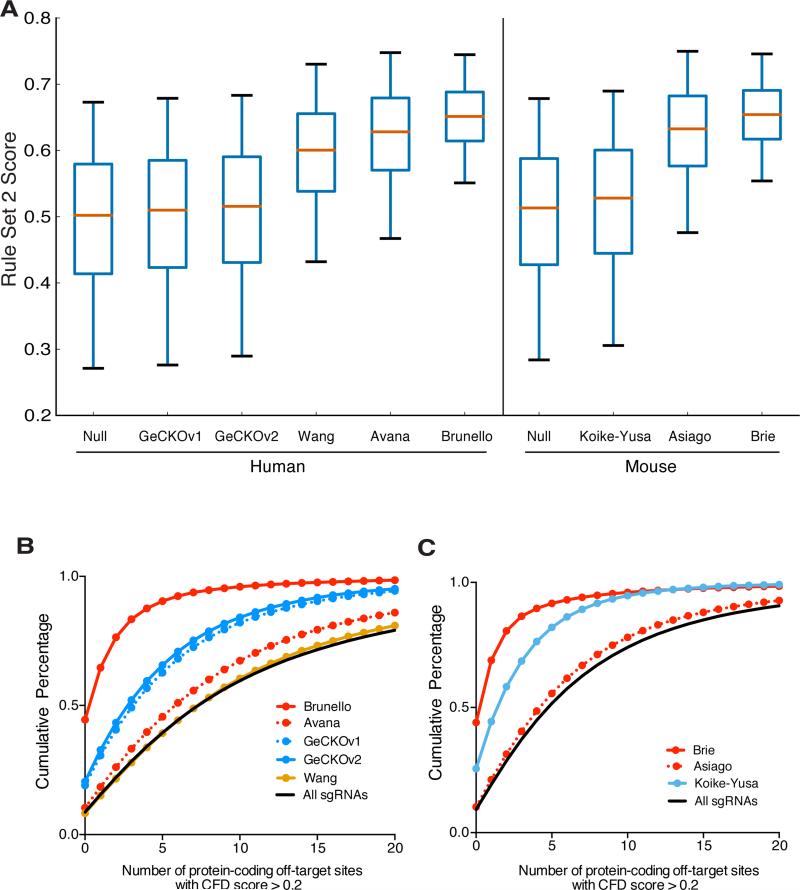
CRISPR-Cas9-based genetic screens are a powerful new tool in biology. By simply altering the sequence of the single-guide RNA (sgRNA), one can reprogram Cas9 to target different sites in the genome with relative ease, but the on-target activity and off-target effects of individual sgRNAs can vary widely. Here, we use recently devised sgRNA design rules to create human and mouse genome-wide libraries, perform positive and negative selection screens and observe that the use of these rules produced improved results. Additionally, we profile the off-target activity of thousands of sgRNAs and develop a metric to predict off-target sites. We incorporate these findings from large-scale, empirical data to improve our computational design rules and create optimized sgRNA libraries that maximize on-target activity and minimize off-target effects to enable more effective and efficient genetic screens and genome engineering.


Figures

Figure 1
Figure 1
Comparative performance of the Avana library. (a) Distribution of Rule Set 1 scores across libraries. The box represents the 25th, 50th, and 75th percentiles, whiskers show 5th and 95th percentiles. (b) Comparison of the FDR-corrected q-values determined by STARS for the top 100 ranked genes in the vemurafenib resistance assay in A375 cells. (c) Validation of individual sgRNAs for vemurafenib resistance in a competition assay in A375 cells. Horizontal bars represent the average of the individual sgRNAs for each gene. Previously-validated genes are labeled in blue. ETP = early time point. (d) Subsampling analysis of the Avana library. We first identified genes that passed at different FDR thresholds with STARS when all six subpools were analyzed (first number in legend), the average number of retained genes that score at different FDR thresholds following removal of subpools (second number in legend). LG = lentiGuide; LC = lentiCRISPRv2. (e) ROC-AUC analysis of individual sgRNAs targeting core essential genes in dropout screens in A375 cells. AUC values are indicated in parentheses.
Figure 2
Figure 2
HPRT1 and NUDT5 confer 6-thioguanine resistance. (a) For each of 6 sgRNAs targeting these genes, fold-enrichment for the indicated sgRNA after two weeks of selection with 6-thioguanine, relative to its starting abundance, assayed in three different cell lines. (b) TIDE analysis of indels for sgRNAs number 4 and 6 from (a) targeting NUDT5 tested in three cell lines. * indicates a sample where no cells survived and thus TIDE analysis could not be performed (c) Schematic of purine metabolism. Proteins are shown in blue circles, small molecules in italics. PRPS1 is also known as PRPP synthetase; PRPP is phosphoribosyl pyrophosphate.
Figure 3
Figure 3
Tiled library screen for resistance genes. (a) Performance of sgRNAs by gene for each of three small molecule challenges. The box represents the 25th, 50th, and 75th percentiles, whiskers show 5th and 95th percentiles, and outliers are shown as individual dots. (b) For sgRNAs targeting MED12, comparison of the log2-fold-change when challenged with vemurafenib and selumetinib. (c) Activity of sgRNAs as a function of target site within the protein, divided by deciles, for 17 proteins. The box represents the 25th, 50th, and 75th percentiles, whiskers show 10th and 90th percentiles. The final decile has a statistically-significant difference in activity (adjusted p-values < 0.02, one-way ANOVA with repeated measures, with Tukey's correction for multiple comparisons).
Figure 4
Figure 4
Development of Rule Set 2 for prediction of sgRNA on-target activity. (a) Comparison of classification models. Spearman correlation between measured activity and predicted activity score is plotted. Error bars show the standard deviation across genes with a leave-one-gene-out approach. SVM + LogReg (Rule Set 1), performs better than the next-best model for all three datasets (left to right p-values of 1.8×10⁻⁸, 5.2×10⁻¹³, and p < 10−16, using the statistical test for differences in Spearman correlation). (b) Addition of new features improves performance using L1 linear regression. Significance determined as in (a), with p-values of, left to right, 4.2×10⁻³, p < 10−16, 2.32×10⁻⁴. (c) Comparison of regression models, as well as the best-performing classification model, SVM + LogReg. Significance values are shown for the comparison between gradient-boosted regression trees (Boosted RT) and L1 regression, using the same measure of significance as in (a), p-values of, left to right, 0.054, 4.9×10⁻⁴, and 5.3×10⁻⁵. (d) Assessment of modeling performance with increasing number of genes used in each training set. Error bars indicate one standard deviation across genes with a leave-one-gene-out approach. (e) Rule Set 2 performance on independently-generated negative selection datasets. From left to right, p-values for the three comparisons are 5.9×10−80, 2.1×10⁻²⁴, and 3.9×10⁻³⁵ (two-sample Kolmogorov-Smirnov test). (f) Rule Set 2 performance on independently-generated CRISPRa/i datasets. From left to right, p-values for the three comparisons are 1.8×10−40, 1.1×10⁻⁴, and 0.14 (two-sample Kolmogorov-Smirnov test).
Figure 5
Figure 5
CFD score for assessing off-target activity of sgRNAs. (a) Activity of sgRNAs as a function of the final two nucleotides of the PAM. The box represents the 25th, 50th, and 75th percentiles, whiskers show 5th and 95th percentiles, and outliers are shown as individual dots. (b) Distribution of log2-fold change values for three classifications of sgRNAs assessed by flow cytometry for activity against CD33. (c) Heat-map of the percent-active values for all sgRNA:DNA interactions where one nucleotide was removed from the sgRNA, creating a bulged DNA base. (d) Same as in (c) but with an insertion of nucleotide in the sgRNA to create a bulged RNA base. (e) Same as in (c) and (d) but with symmetric mismatches. Grayscale is the same for panels c – e. (f) Comparison of the correlation of 3 off-target scoring metrics to measured off-target activity of 89 sgRNAs with mismatches to the cell surface receptor H2-K (g) AUC values for GUIDE-Seq reads as a function of number of mismatches assessed by three scoring metrics; same color scheme as in (f). (h) Distribution of sgRNAs targeting non-essential genes in a dropout screen in A375 cells. All 109,463 sgRNAs in the Avana library screened in A375 cells were ranked by their depletion, binned by decile, and the count of 4,950 sgRNAs targeting the set of non-essential genes in each bin is plotted. (i) For the sgRNAs targeting non-essential genes plotted in (h), the distribution of the number of off-target sites in protein-coding regions with CFD scores > 0.2. The box represents the 25th, 50th, and 75th percentiles, whiskers show 10th and 90th percentiles. The first bin, with the most-depleted sgRNAs, is statistically significant compared to all other bins, Kruskal-Wallis test, p < 10−4. The x-axis is the same for panels (h) and (i).
Figure 6
Figure 6
On-target and off-target properties of the Brunello and Brie libraries. (a) Distribution of Rule Set 2 on-target activity scores across libraries. The box represents the 25th, 50th, and 75th percentiles, whiskers show 5th and 95th percentiles. (b) Cumulative distribution of the number of off-target sites with CFD scores > 0.2 in protein-coding regions across human libraries and (c) mouse libraries.

References

    1. Jinek M, et al. A Programmable Dual-RNA-Guided DNA Endonuclease in Adaptive Bacterial Immunity. Science. 2012;337:816–821. - PMC - PubMed
    1. Mali P, et al. RNA-Guided Human Genome Engineering via Cas9. Science. 2013;339:823–826. - PMC - PubMed
    1. Cong L, et al. Multiplex Genome Engineering Using CRISPR/Cas Systems. Science. 2013;339:819–823. - PMC - PubMed
    1. Jinek M, et al. RNA-programmed genome editing in human cells. eLife. 2013;2:e00471. - PMC - PubMed
    1. Hartenian E, Doench JG. Genetic screens and functional genomics using CRISPR/Cas9 technology. FEBS J. 2015;282:1383–1393. - PubMed

Publication types

Substances