

The roles of the zinc finger transcription factors XlnR, ClrA and ClrB in the breakdown of lignocellulose by Aspergillus niger
- PMID: 26780227
- PMCID: PMC4715039
- DOI: 10.1186/s13568-016-0177-0
The roles of the zinc finger transcription factors XlnR, ClrA and ClrB in the breakdown of lignocellulose by Aspergillus niger
Abstract
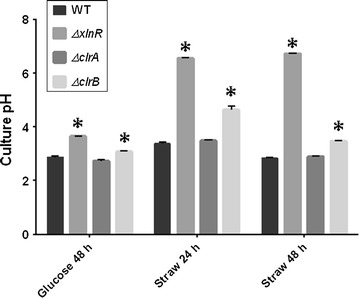
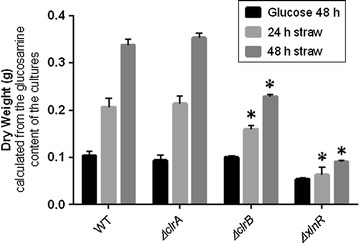
Genes encoding the key transcription factors (TF) XlnR, ClrA and ClrB were deleted from Aspergillus niger and the resulting strains were assessed for growth on glucose and wheat straw, transcription of genes encoding glycosyl hydrolases and saccharification activity. Growth of all mutant strains, based in straw on measurement of pH and assay of glucosamine, was impaired in relation to the wild-type (WT) strain although deletion of clrA had less effect than deletion of xlnR or clrB. Release of sugars from wheat straw was also lowered when culture filtrates from TF deletion strains were compared with WT culture filtrates. Transcript levels of cbhA, eglC and xynA were measured in all strains in glucose and wheat straw media in batch culture with and without pH control. Transcript levels from cbhA and eglC were lowered in all mutant strains compared to WT although the impact of deleting clrA was not pronounced with expression of eglC and had no effect on xynA. The impact on transcription was not related to changes in pH. In addition to impaired growth on wheat straw, the ΔxlnR strain was sensitive to oxidative stress and displayed cell wall defects in the glucose condition suggesting additional roles for XlnR. The characterisation of TFs, such as ClrB, provides new areas of improvement for industrial processes for production of second generation biofuels.
Keywords: Cell wall; Glysosyl-hydrolases; Regulation; Transcription factor; pH.
Figures


Similar articles
-
The Different Roles of Penicillium oxalicum LaeA in the Production of Extracellular Cellulase and β-xylosidase.Front Microbiol. 2016 Dec 22;7:2091. doi: 10.3389/fmicb.2016.02091. eCollection 2016. Front Microbiol. 2016. PMID: 28066400 Free PMC article.
-
Transcription Factors ClrB and XlnR and Their Effect on the Transcription of Cellulase Genes in the Filamentous Fungus Penicillium verruculosum.Int J Mol Sci. 2024 Dec 13;25(24):13373. doi: 10.3390/ijms252413373. Int J Mol Sci. 2024. PMID: 39769136 Free PMC article.
-
RNA-sequencing reveals the complexities of the transcriptional response to lignocellulosic biofuel substrates in Aspergillus niger.Fungal Biol Biotechnol. 2014 Nov 17;1:3. doi: 10.1186/s40694-014-0003-x. eCollection 2014. Fungal Biol Biotechnol. 2014. PMID: 28955445 Free PMC article.
-
Conservation and diversity of the regulators of cellulolytic enzyme genes in Ascomycete fungi.Curr Genet. 2017 Dec;63(6):951-958. doi: 10.1007/s00294-017-0695-6. Epub 2017 Apr 27. Curr Genet. 2017. PMID: 28451846 Review.
-
Regulation of transcription of cellulases- and hemicellulases-encoding genes in Aspergillus niger and Hypocrea jecorina (Trichoderma reesei).Appl Microbiol Biotechnol. 2008 Feb;78(2):211-20. doi: 10.1007/s00253-007-1322-0. Epub 2008 Jan 16. Appl Microbiol Biotechnol. 2008. PMID: 18197406 Review.
Cited by
-
Crosstalk of Cellulose and Mannan Perception Pathways Leads to Inhibition of Cellulase Production in Several Filamentous Fungi.mBio. 2019 Jul 2;10(4):e00277-19. doi: 10.1128/mBio.00277-19. mBio. 2019. PMID: 31266859 Free PMC article.
-
Transcriptomic insights into the roles of the transcription factors Clr1, Clr2 and Clr4 in lignocellulose degradation of the thermophilic fungal platform Thermothelomyces thermophilus.Front Bioeng Biotechnol. 2023 Oct 6;11:1279146. doi: 10.3389/fbioe.2023.1279146. eCollection 2023. Front Bioeng Biotechnol. 2023. PMID: 37869709 Free PMC article.
-
MtTRC-1, a Novel Transcription Factor, Regulates Cellulase Production via Directly Modulating the Genes Expression of the Mthac-1 and Mtcbh-1 in Myceliophthora thermophila.Appl Environ Microbiol. 2022 Oct 11;88(19):e0126322. doi: 10.1128/aem.01263-22. Epub 2022 Sep 27. Appl Environ Microbiol. 2022. PMID: 36165620 Free PMC article.
-
The transcriptional activator GaaR of Aspergillus niger is required for release and utilization of d-galacturonic acid from pectin.FEBS Lett. 2016 Jun;590(12):1804-15. doi: 10.1002/1873-3468.12211. Epub 2016 May 30. FEBS Lett. 2016. PMID: 27174630 Free PMC article.
-
Deletion of either the regulatory gene ara1 or metabolic gene xki1 in Trichoderma reesei leads to increased CAZyme gene expression on crude plant biomass.Biotechnol Biofuels. 2019 Apr 9;12:81. doi: 10.1186/s13068-019-1422-y. eCollection 2019. Biotechnol Biofuels. 2019. PMID: 31007715 Free PMC article.
References
-
- Aidoo KE, Hendry R, Wood BJB. Estimation of fungal growth in a solid-state fermentation system. Eur J Appl Microbiol. 1981;12:6–9. doi: 10.1007/BF00508111. - DOI
-
- Andersen MR (2008) Systems biology studies of Aspergilli—from sequence to science. PhD Thesis, Technical University of Denmark.
-
- Archer DB, Roberts IN, MacKenzie DA. Heterologous protein secretion from Aspergillus niger in phosphate-buffered batch culture. Appl Microbiol Biotechnol. 1990;34:313–315.
Grants and funding
LinkOut - more resources
Full Text Sources
Other Literature Sources
Miscellaneous
