. 2016 Feb;18(2):157-67.
doi: 10.1038/ncb3299. Epub 2016 Jan 18.

A dynamic niche provides Kit ligand in a stage-specific manner to the earliest thymocyte progenitors

Affiliations

A dynamic niche provides Kit ligand in a stage-specific manner to the earliest thymocyte progenitors

Mario Buono et al. Nat Cell Biol. 2016 Feb.

Abstract

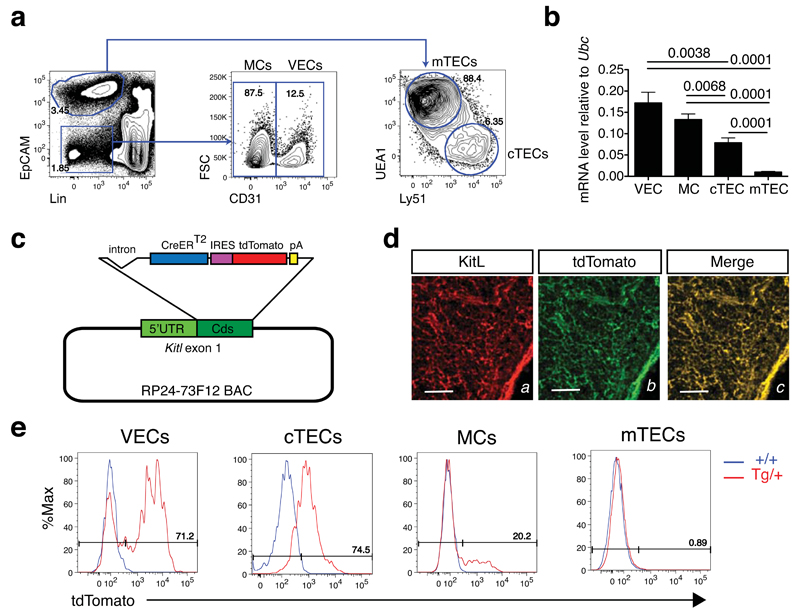
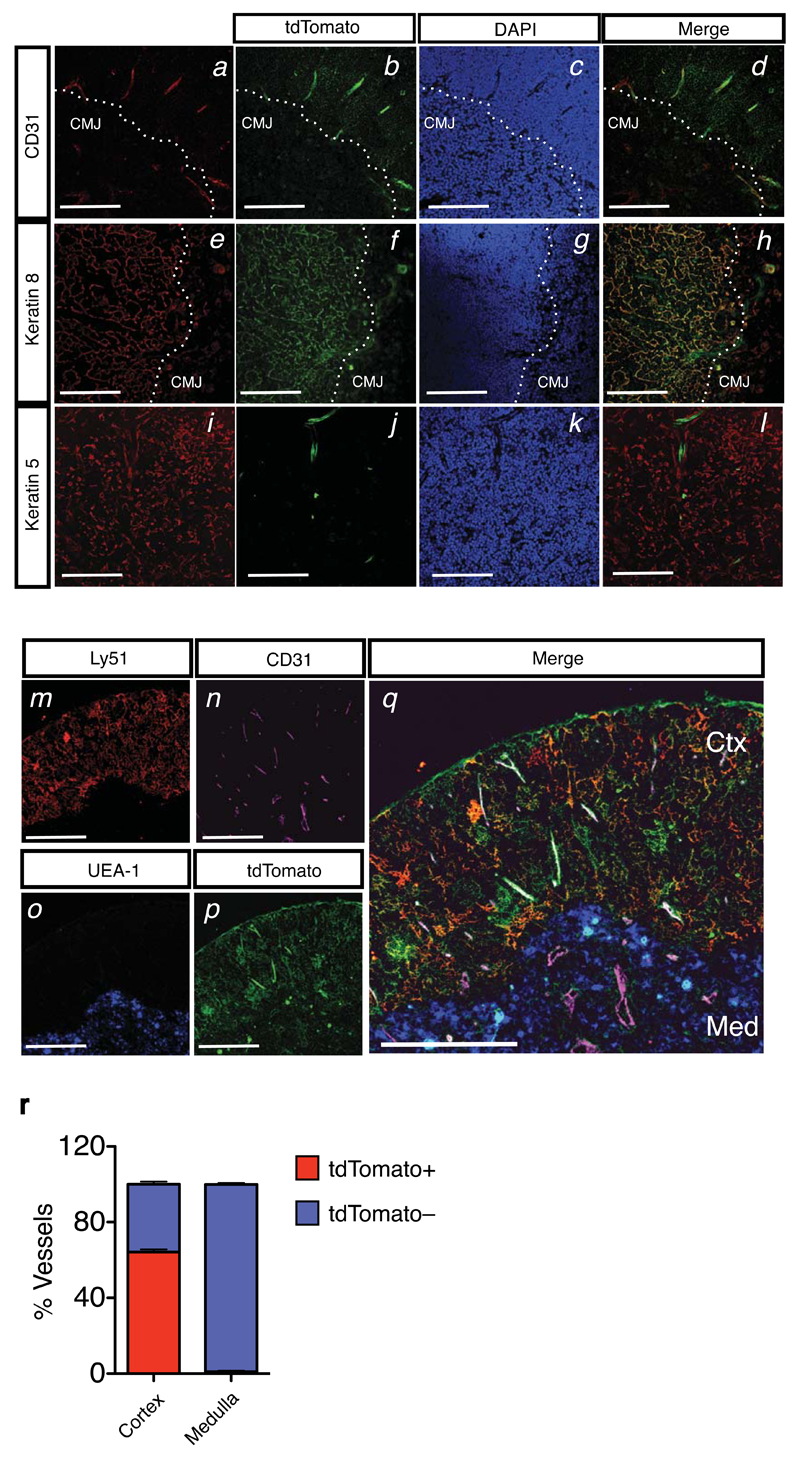
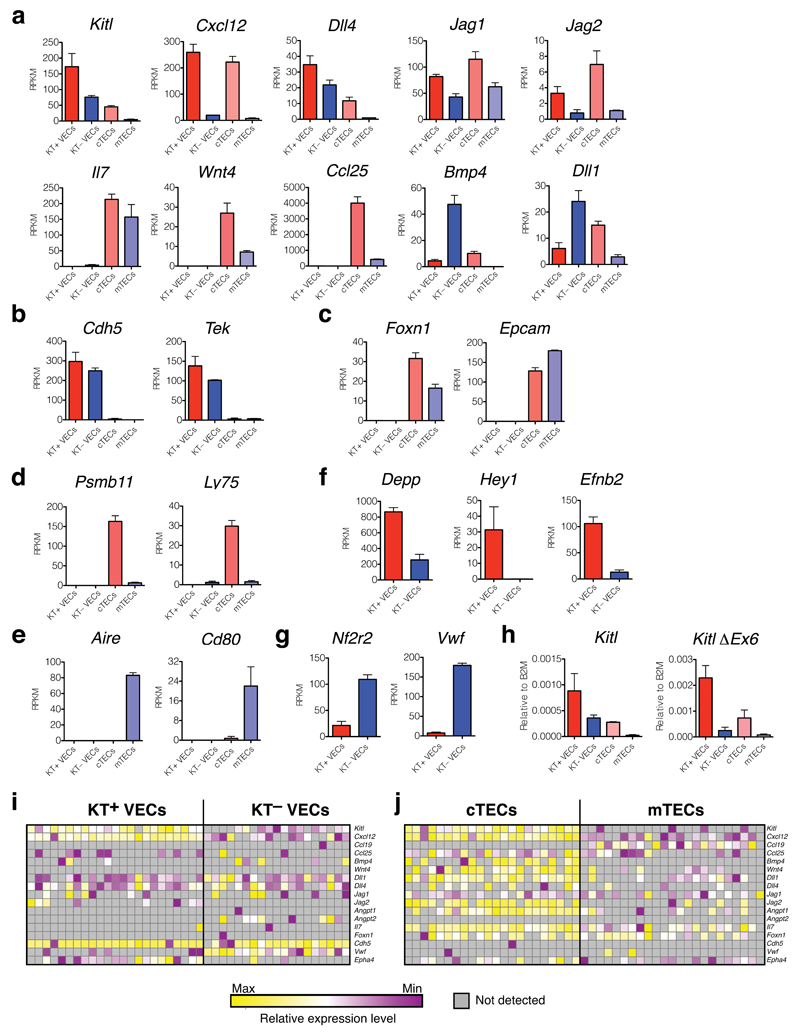
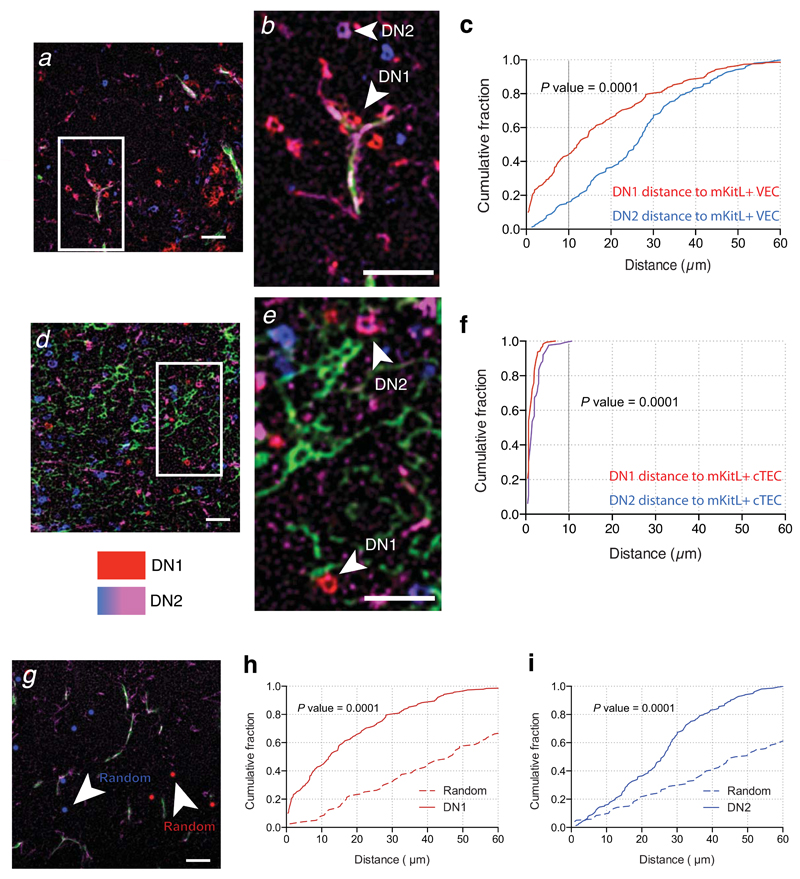
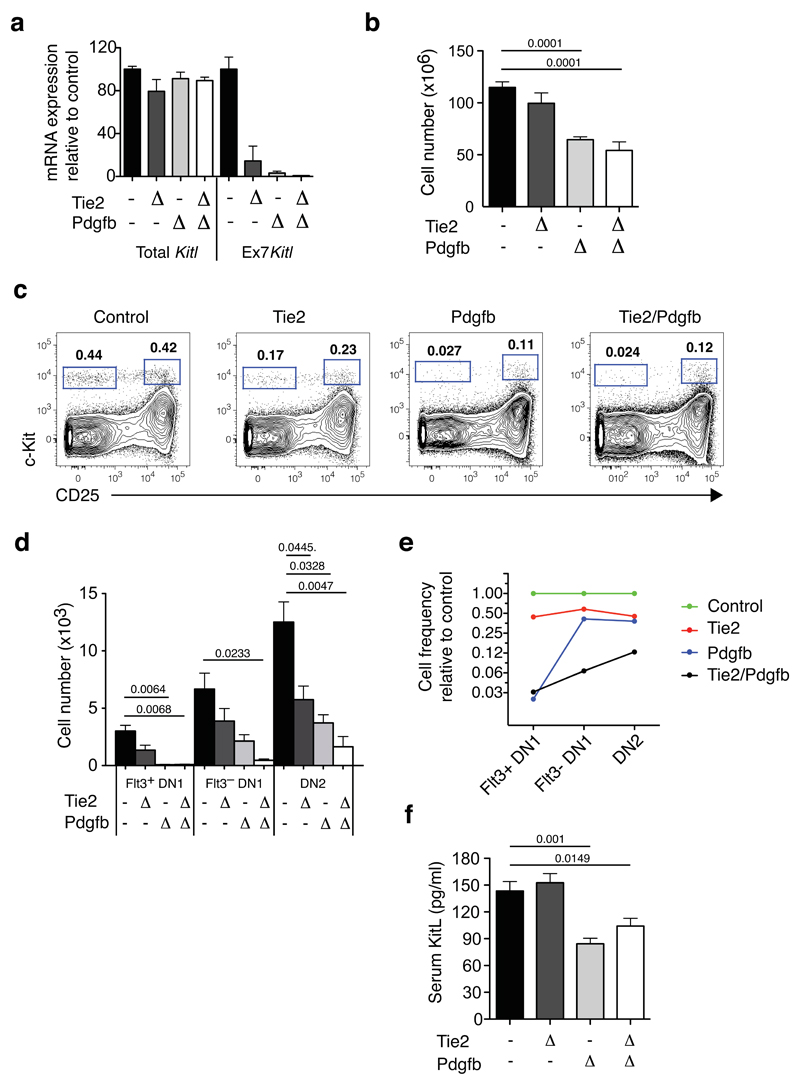
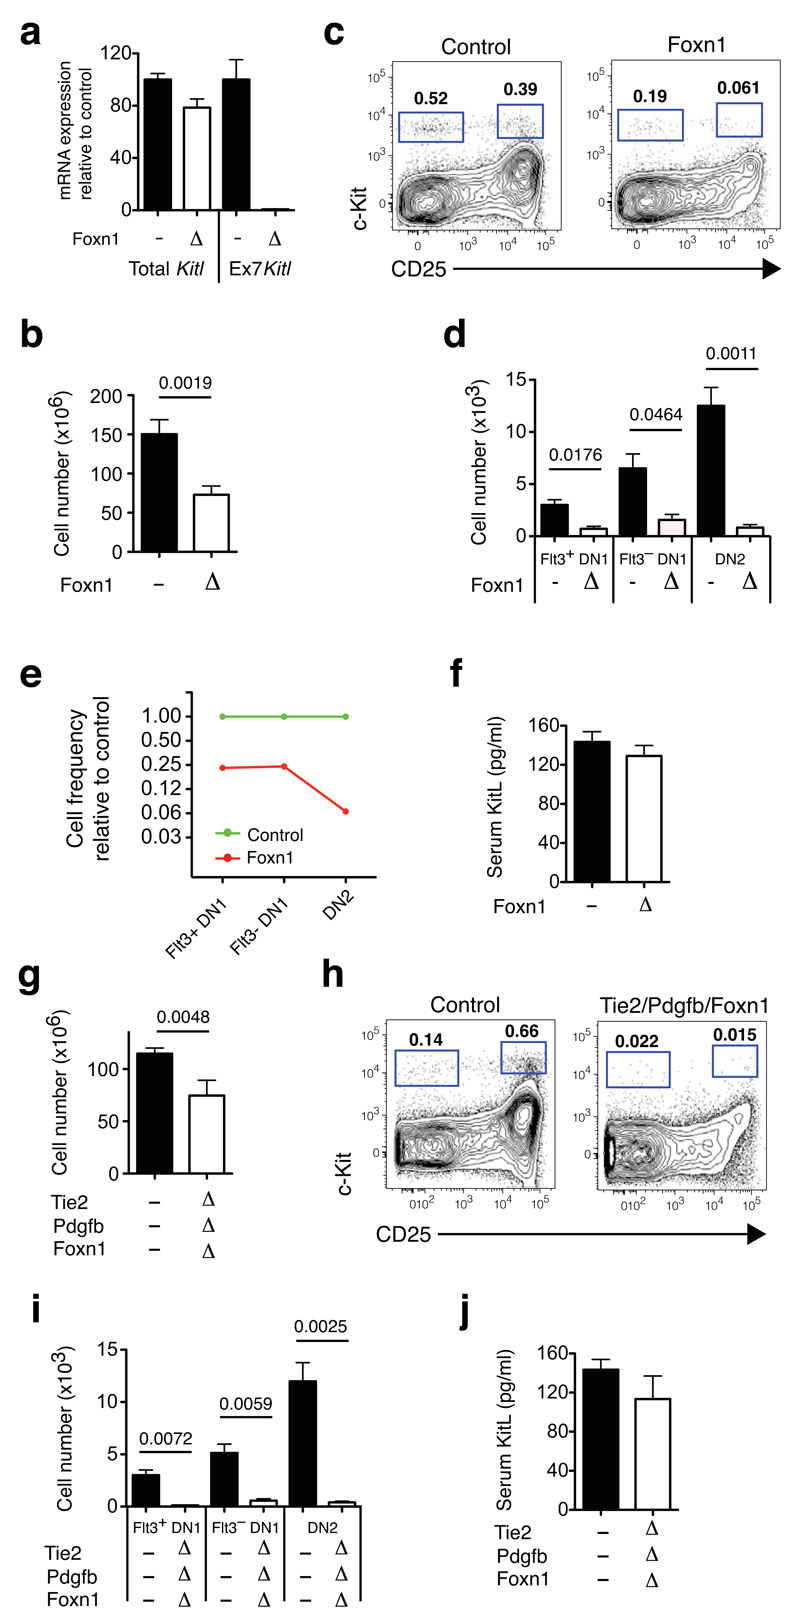
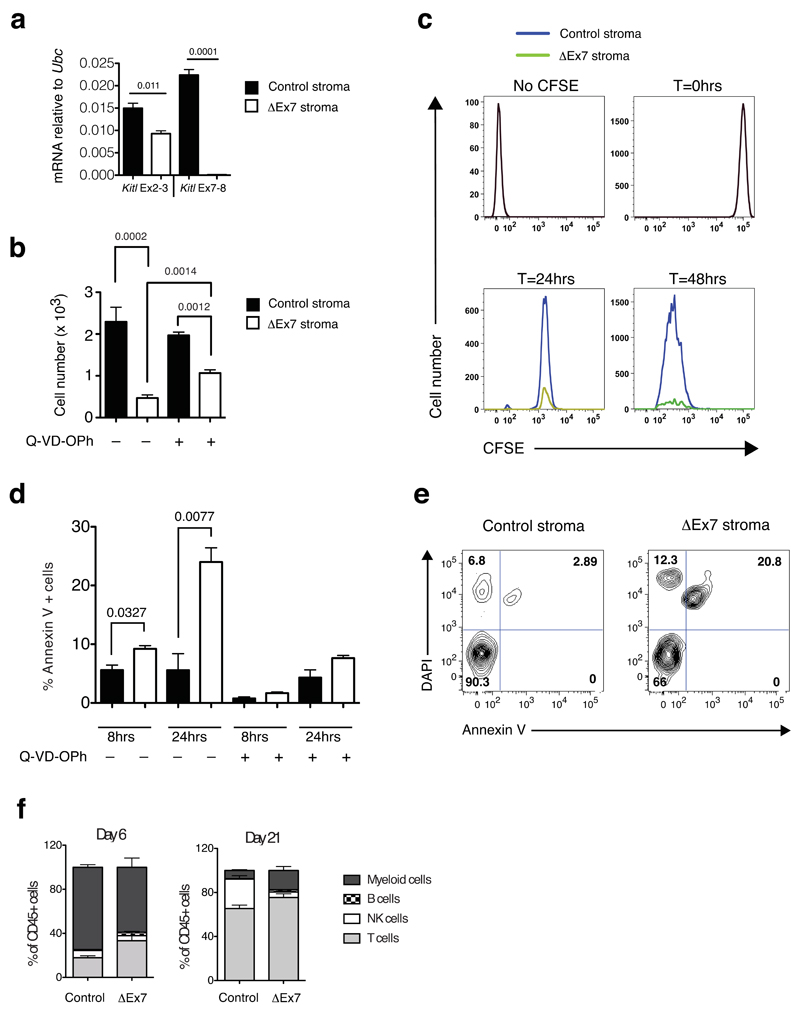
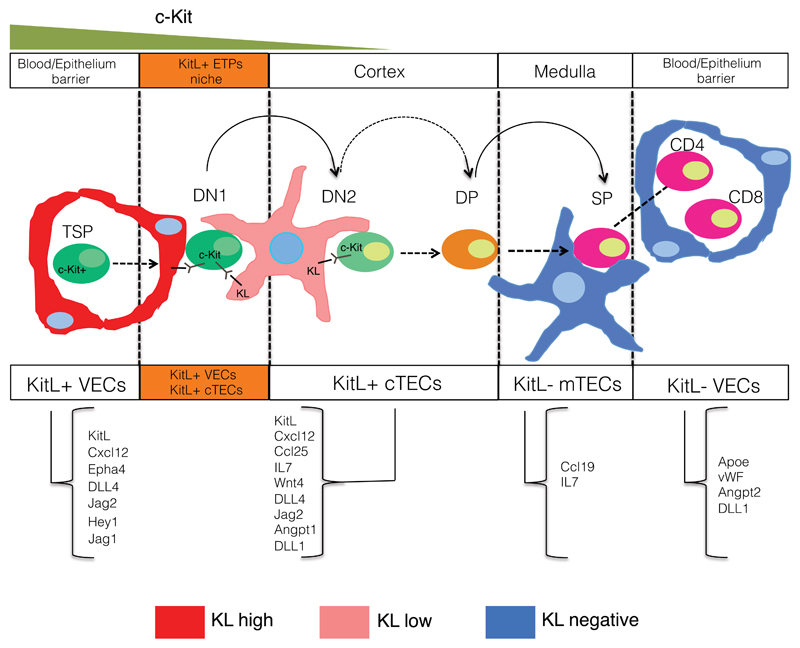
Thymic T cell development is initiated from bone-marrow-derived multi potent thymus-seeding progenitors. During the early stages of thymocyte differentiation, progenitors become T cell restricted. However, the cellular environments supporting these critical initial stages of T cell development within the thymic cortex are not known. Here we use the dependence of early, c-Kit-expressing thymic progenitors on Kit ligand (KitL) to show that CD4(-)CD8(-)c-Kit(+)CD25(-) DN1-stage progenitors associate with, and depend on, the membrane-bound form of KitL (mKitL) provided by a cortex-specific KitL-expressing vascular endothelial cell (VEC) population. In contrast, the subsequent CD4(-)CD8(-)c-Kit(+)CD25(+) DN2-stage progenitors associate selectively with cortical thymic epithelial cells (cTECs) and depend on cTEC-presented mKitL. These results show that the dynamic process of early thymic progenitor differentiation is paralleled by migration-dependent change to the supporting niche, and identify VECs as a thymic niche cell, with mKitL as a critical ligand.


Figures

Figure 1
Figure 1. Distinct patterns of Kit ligand expression in thymic stromal cell types.
(a) Representative flow cytometry plots and gating strategy for the detection of the indicated thymic stromal cell populations. VEC: vascular endothelial cells; MC: mesenchymal cells; mTEC: medullary thymic epithelial cells; cTEC: cortical thymic epithelial cells. (b) Real-time qPCR analysis of Kitl mRNA expression in sorted VECs, MCs, cTECs and mTECs. Cell populations were sorted from 4-week old C57Bl/6 mice and Kitl mRNA quantified by real-time qPCR. Values represent averages after normalization to Ubc mRNA. N=3 biological replicates, each measured in technical triplicate. Significance of differences in expression level were determined using Student’s t-test; P-values are shown. Error bars show the SEM. For source data see Supplementary Table 5. (c) Schematic representation of Kitl-CreERT2-IRES-tdTomato BAC transgene. IRES: internal ribosomal entry site; pA: polyadenylation site; Cds: coding sequence. (d) Double immunofluorescence analysis of thymic frozen section from of Kitl-tdTomatotg/+ mouse using antibodies against KitL (left panel; red) and tdTomato (center panel; green). KitL/tdTomato co-localization is shown (right panel, merge). Scale bars: 100μm. (e) Representative flow cytometric analysis of tdTomato expression in the indictaed thymic stromal cell populations from Kitl-tdTomatotg/+ mice and wild type controls. The fraction of tdTomato+ cells is shown for each population.
Figure 2
Figure 2. Localization of Kit ligand expressing thymic stromal subsets to the cortico-medullary junction and cortex.
(a-d) Immunofluorescence analysis of Kitl-tdTomatotg/+ thymic section using antibodies against CD31 (panel a, red), and tdTomato (panel b, green). DAPI staining was used to identify the cortico-medullary junction (CMJ). Colocalization of CD31 and tdTomato is shown (panel d). Scale bars: 300μm. (e-h) Analysis as in (a-d), using anti-K8 (panel e, red) and anti-tdTomato (panel f, green) antibodies. Scale bars: 300μm. (i-l) Analysis as in (a-d), using anti-K5 (panel i, red) and anti-tdTomato (panel j, green) antibodies. Scale bars: 300μm. (m-q) Immunofluorescence analysis of Kitl-tdTomatotg/+ thymic section using antibodies against Ly51 (panel m, red), CD31 (panel n, pink), UEA-1 (panel o, blue), tdTomato (panel p, green). Colocalization is shown (panel q). Note the preferential location of tdTomato+CD31+ VECs to the cortex (Ctx), whereas medullary (Med) VECs (CD31+) are tdTomato–. Scale bars: 300μm. (r) Quantification of the tdTomato+CD31+ and tdTomato–CD31+ VECs across the cortical and medullary regions. Result shown as average percentage of the total vascular structures counted in the cortical region (n=1475) and medulla (n=341) from 3 biological replicates and 2 separate experiments. Bars show the SEM.
Figure 3
Figure 3. Thymic stromal cell subsets show distinct ligand expression profiles.
(a) mRNA expression levels for ligands involved in T-cell development in KT+ VECs, KT– VECs, cTECs and mTECs, as indicated, measured by RNA sequencing. Bars show the average reads per kilobase transcript per million reads (RPKM) from 3 biological replicates; error bars represent standard errors. (b,c) Analysis as in (a) of VEC-specific (b) and TEC-specific (c) gene expression. (d,e) Analysis as in (a) of cTEC-specific (d) and mTEC-specific (e) gene expression. (f,g)Analysis as in (a) of genes associated with arterial (f) and venous endothelium (g). (h) Real-time qPCR analysis of Kitl mRNA and ΔEx6 Kitl mRNA expression in sorted KT+ and KT– VECs, cTECs and mTECs from (a). Values represent averages after normalization to B2m mRNA. N=3 biological replicates, each measured in technical triplicate. For source data see Supplementary Table 5. (I,j) mRNA expression in single KT+ VECs, KT– VECs (h) and cTECs and mTECs (i) using microfluidics-based qPCR. Expression values are normalized to B2m for each gene, and subsequently to the average value for each individual gene. Normalization was done separately for VECs and TECs. Each column represents a single cell.
Figure 4
Figure 4. c-Kit+ thymocyte progenitors home to mKitL expressing cortical VECs and TECs.
(a) Immunofluorescence analysis thymic sections using antibodies against CD31 (green), intracellular KitL+ (ICKitL; pink), c-Kit (red) and CD25 (blue) to identify mKitL+ VECs (CD31+ICKitL+) and c-Kit+ thymocyte progenitors (DN1: c-Kit+CD25–; DN2: c-Kit+CD25+). Scale bar: 100μm (b) Insert from (a) showing mKitL+ VEC-associated DN1 thymocyte (arrowhead) and DN2 thymocyte (arrow) indicated. Scale bar: 100μm (c) Distribution of the distances between ICKitL+ VECs and DN1 and DN2 thymocytes measured from sections stained as in (a). The plot shows the cumulative fraction of cells closer than the indicated distance. The significance of the difference in distance distribution between DN1 and DN2 thymocytes was calculated using the Kolmogorov-Smirnov test. DN1: N=189; DN2: N=153 from 3 biological replicates. (d,e) Analysis as in (a,b) using antibodies against against Ly51 (green), ICKitL (pink), c-Kit (red) and CD25 (blue) to identify mKitL+ cTECs (Ly51+ICKitL+) and c-Kit+ thymocyte progenitors (DN1: c-Kit+CD25–; DN2: c-Kit+CD25+). Scale bars: 100μm (f) Analysis as in (c) of the distances between ICKitL+ VECs and DN1 and DN2 thymocytes measured from sections stained as in (d). DN1: N=158; DN2: N=127 from 3 biological replicates. (g) Immunofluorescence analysis of thymic sections with antibodies against CD31 (green), intracellular KitL (pink) (used to generate data in (a)) was used as a platform to generate a random distribution of DN1 and DN2 cells. The original DN1 and DN2 cell staining was removed and replaced with randomly distributed red (DN1) and blue (DN2) dots that resembled the size and the in vivo frequency for these cells. (h) Distribution of the distances between ICKitL+ VECs/DN1 vs ICKitL+ VECs/Random. The significance of the difference in the distance distribution was calculated using the Kolmogorov-Smirnov test. P value is shown. DN1: N=189 (from panel c); Random: N=80. (i) Distribution of the distances between ICKitL+ VECs/DN2 vs ICKitL+ VECs/Random. The significance of the difference in the distance distribution was calculated using the Kolmogorov Smirnov test. P value is shown. DN2: N=153 (from panel c); Random: N=120.
Figure 5
Figure 5. Cortical vascular expression of mKitL is critical for thymocyte progenitor homeostasis.
(a). qPCR analysis of KItl mRNA levels using Kitl exon 2-3 spanning (Total Kitl) and exon7-8 (Ex7 Kitl) spanning amplicons was performed on sorted thymic VECs from Control (KitlLEx7/LEx7; n=10), Tie2ΔEx7 (n=4), PdgfbΔEx7 (n=5) and Tie2/PdgfbΔEx7 (n=6) mice, collected from 5 independent experiments. To induce Pdgfb-CreERT2–mediated deletion, mice were injected twice with 3mg tamoxifen with a 2-day interval, and analyzed 7 days after the last injection, at 4-5 weeks of age. Values shown are average expression as percentage of the control value; error bars indicate standard errors. For source data see Supplementary Table 5. (b) The number of total thymocytes in 4-5 weeks old Control (KitlLEx7/LEx7; n=20), Tie2ΔEx7 (n=7), Pdgf ΔEx7 (n=5) and Tie2/Pdgf ΔEx7 (n=4) mice, from 8 independent experiments and tamoxifen treated as in (a). The Cre drivers used are indicated on the x-axis. Values are group averages; error bars show standard errors. Student’s t-test P-values relative to the control group are shown. For source data see Supplementary Table 5. (c) Representative flow cytometric analysis of c-Kit+ DN thymocyte progenitors from the mice in (a). The gates used to identify DN1 (c-Kit+CD25–) and DN2 cells (c-Kit+CD25+) are indicated. (d) Absolute number of phenotypic Flt3+DN1, Flt3–DN1 and DN2 cells mice from (a). Values are group averages; error bars show standard errors. Student’s t-test P-values relative to the control group are shown. For source data see Supplementary Table 5. (e) Graph showing the average abundance of Flt3+DN1, Flt3-DN1 and DN2 cells in Tie2ΔEx7, Pdgf ΔEx7 and Tie2/Pdgf ΔEx7 mice relative to Cre- Control mice. (f) KitL concentration in the serum of the mice in (a). Values are group averages; error bars show standard errors. Student’s t-test P-values relative to the control group are shown. For source data see Supplementary Table 5.
Figure 6
Figure 6. Effect of thymic epithelial mKitL deletion on thymocyte number and thymic progenitors.
(a) qPCR analysis as in (Fig. 5e) of KItl gene expression in sorted cTECs from KitlLEx7/LEx7 (n=8) and Foxn1ΔEx7 mice (n=6) collected from 2 independent experiments. (b) Total thymic cellularities in 4-5 weeks old Control (KitlLEx7/LEx7; n=18) and Foxn1ΔEx7 mice (n=6) collected over 4 independent experiments. The Cre driver used is indicated on the x-axis. Values are group averages; error bars show standard errors. The Student’s t-test P-value relative to the control group is shown. (c) Representative flow cytometric analysis of c-Kit+ DN thymocyte progenitors from the mice in (a). The gates used to identify DN1 (c-Kit+CD25–) and DN2 progenitors (c-Kit+CD25+) are indicated. (d) Absolute number of phenotypic Flt3+DN1, Flt3–DN1 and DN2 thymocyte progenitors in mice from (a). The Cre drivers used are indicated on the x-axis. Values are group averages; error bars show standard errors. Student’s t-test P-values relative to the control group are shown. (e) Graph showing the average abundance of Flt3+DN1, Flt3–DN1 and DN2 cells in Foxn1ΔEx7 mice relative to Cre– Control mice. (f) KitL concentration in the serum of the mice in (a). Values are group averages; error bars show standard errors. (g) Total thymic cells in 4-5 weeks old Control (KitlLEx7/LEx7; n=18), Tie2/Pdgfb/Foxn1ΔEx7 (n=5) mice analysed over 4 independent experiments.. The Cre drivers used are indicated on the x-axis. Mice were tamoxifen treated as in Fig. 5a. Values are group averages; error bars show standard errors. Student’s t-test P-values relative to the control group are shown. (h) Representative flow cytometric analysis of c-Kit+ DN thymocyte progenitors from the mice in (g). The gates used to identify DN1 (c-Kit+CD25–) and DN2 cells (c-Kit+CD25+) are indicated. (i) Absolute number of phenotypic Flt3+DN1, Flt3–DN1 and DN2 thymocyte progenitors in mice from (g). The Cre drivers used are indicated on the x-axis. Values are group averages; error bars show standard errors. Student’s t-test P-values relative to the control group are shown. (j) KitL concentration in the serum of the mice in (g). Values are group averages; error bars show standard errors. P-values relative to the control group are shown.
Figure 7
Figure 7. mKitL promotes early thymocyte progenitor survival.
(a) qPCR analysis as in Fig, 5a of cultured thymic stroma from 4-week old KitlLEx7/LEx7;Rosa26-CreERT2 (ΔEx7 stroma) and Kitl+/+;Rosa26-CreERT2 (control (Con) stroma) treated with tamoxifen (4OHT). Each value is the mean, normalized to Ubc mRNA, of 3 biological replicates, each measured in technical triplicate. Error bars show standard errors. Significance of difference in expression level was determined using Student’s t-test; P-values are shown. For source data see Supplementary Table 5. (b) Total live thymocyte cell number from at 48 after plating DN1 cells on Con and ΔEx7 stroma, in the presence or absence of Q-VD-OPh as indicated (–Q-VD-OPh: N=7; +Q-VD-OPh: n=3 biological replicates pooled over 2 independent experiments). Error bars show standard errors. Significance of difference in expression level was determined using Student’s t-test; P-values are shown. (c) Representative histogram plots of CFSE labeled DN1 cells 24hrs and 48hrs after plating onto Con or ΔEx7 stroma. Profiles of unstained cells (No CFSE) and CFSE labeled cells prior to plating (T=0hrs) are shown. n at 24 hours=6; n at 48 hours=7. n represents biological replicates pooled over 3 different experiments (d) Percentage of Annexin V+ cells at 8hrs and 24hrs of culture in control and ΔEx7 cocultures, in the presence or absence of Q-VD-OPh as indicated. n=3 biological replicated for all conditions, pooled over 2 independent experiments. Error bars show standard errors. Significance of difference in expression level was determined using Student’s t-test; P-values are shown. For source data see Supplementary Table 5. (e) Representative FACS plot at the 24 hour time point of the data shown in (d). (f) Lineage readout at days 6 and 21 from 3x10³ sorted ETPs plated onto control and ΔEx7 primary thymic stroma. n=3 biological replicates for all conditions, from 2 independent experiments. Error bars show standard errors. For source data see Supplementary Table 5.
Figure 8
Figure 8. Model of the cellular niches occupied by c-Kit+ thymocyte progenitors.
Schematic diagram of the sequential interaction of c-Kit thymocyte progenitors with KitL+ VEC and cTEC stromal cells. The ligands found to be expressed by the different stromal cell subsets are indicated.

References

    1. Scadden DT. Nice neighborhood: emerging concepts of the stem cell niche. Cell. 2014;157:41–50. - PMC - PubMed
    1. Scadden DT. The stem-cell niche as an entity of action. Nature. 2006;441:1075–1079. - PubMed
    1. Chasis JA, Mohandas N. Erythroblastic islands: niches for erythropoiesis. Blood. 2008;112:470–478. - PMC - PubMed
    1. Zhu J, et al. Osteoblasts support B-lymphocyte commitment and differentiation from hematopoietic stem cells. Blood. 2007;109:3706–3712. - PubMed
    1. Ding L, Morrison SJ. Haematopoietic stem cells and early lymphoid progenitors occupy distinct bone marrow niches. Nature. 2013;495:231–235. - PMC - PubMed

Publication types

Substances