. 2016 Mar;19(3):504-16.
doi: 10.1038/nn.4222. Epub 2016 Jan 18.

Microglial brain region-dependent diversity and selective regional sensitivities to aging

Affiliations

Microglial brain region-dependent diversity and selective regional sensitivities to aging

Kathleen Grabert et al. Nat Neurosci. 2016 Mar.

Abstract

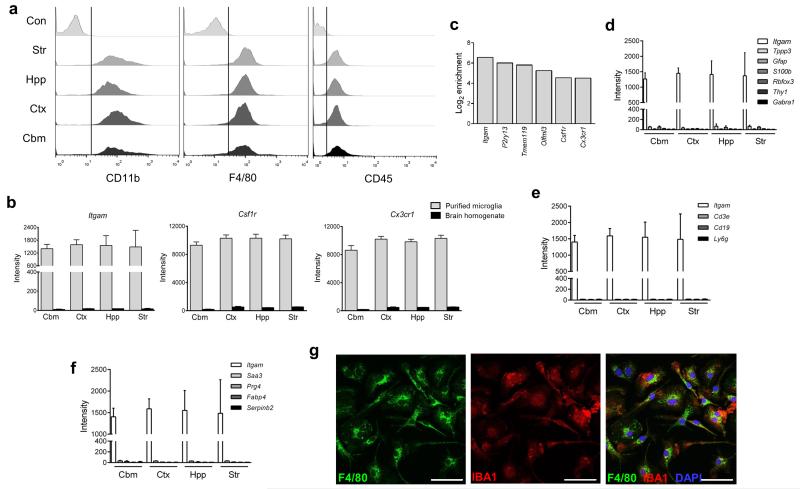
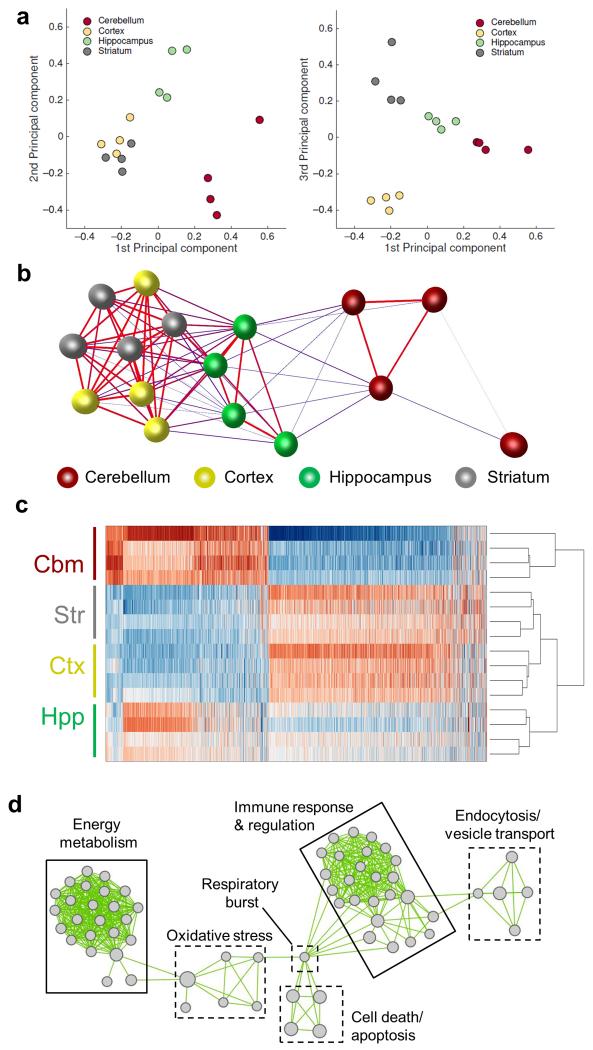
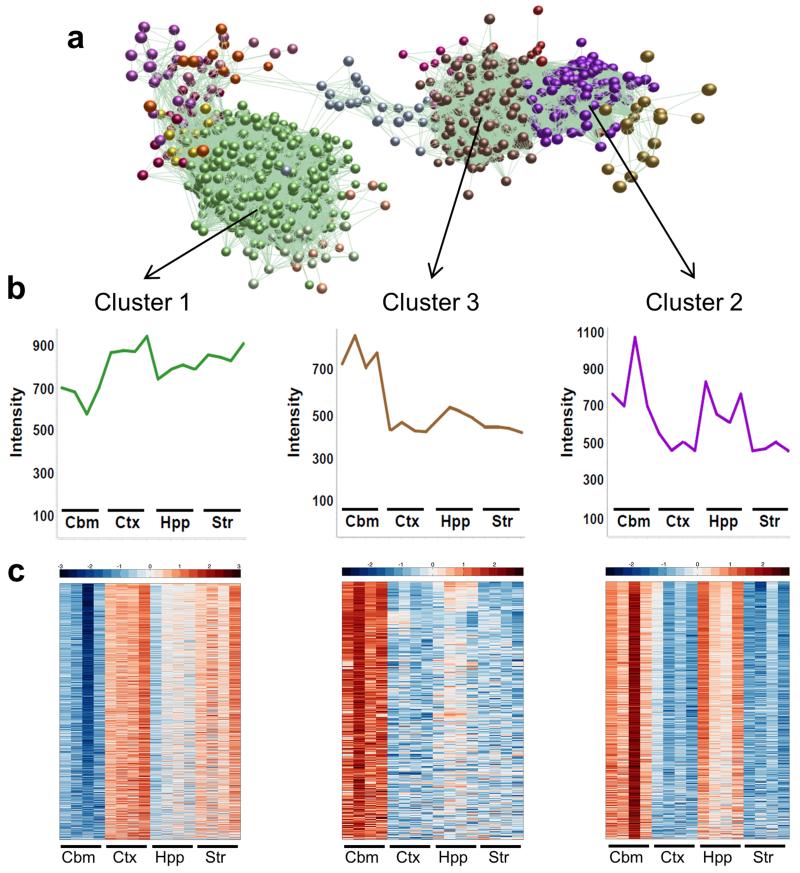
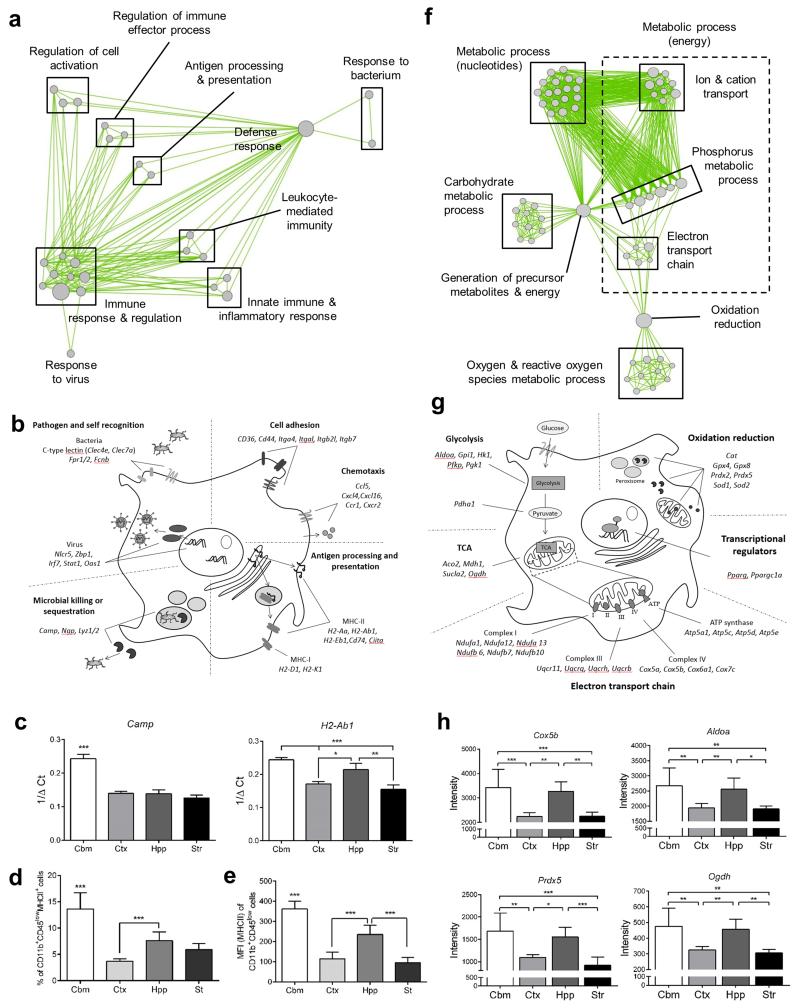
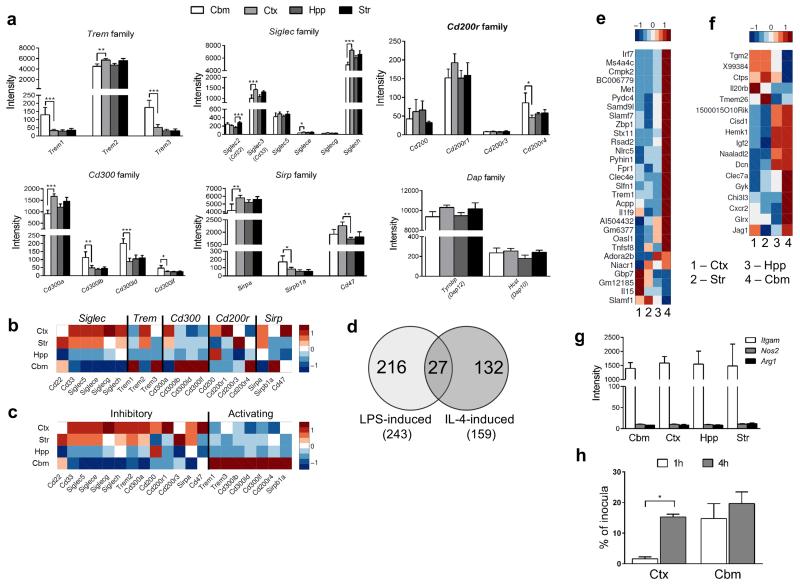
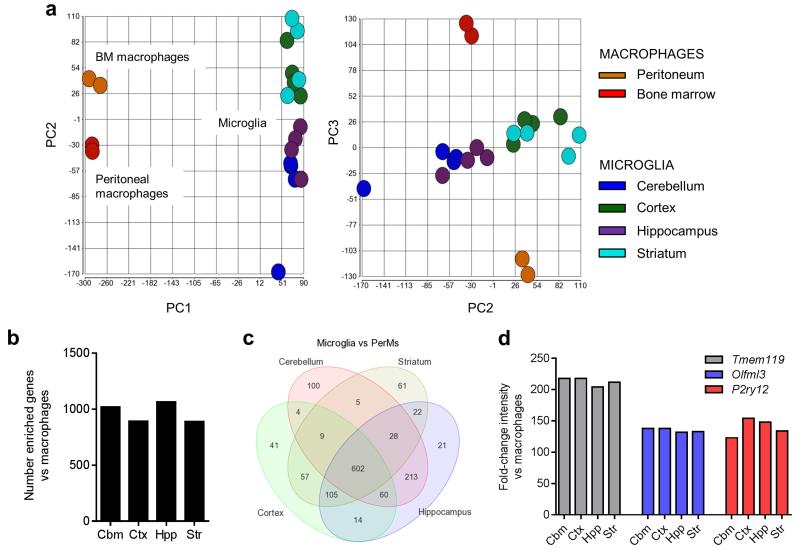
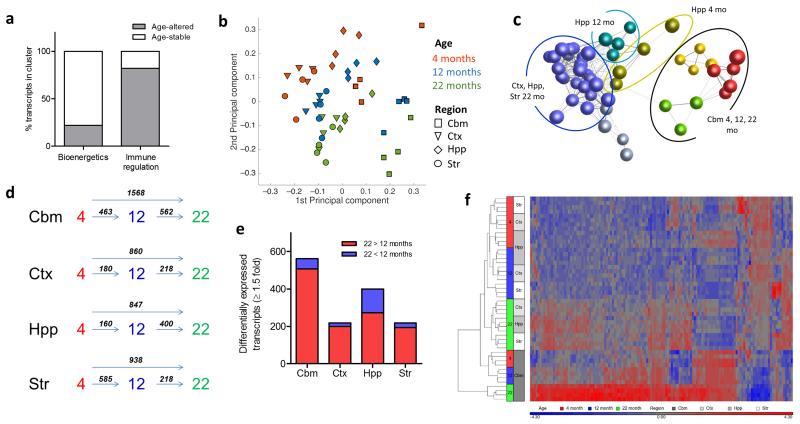
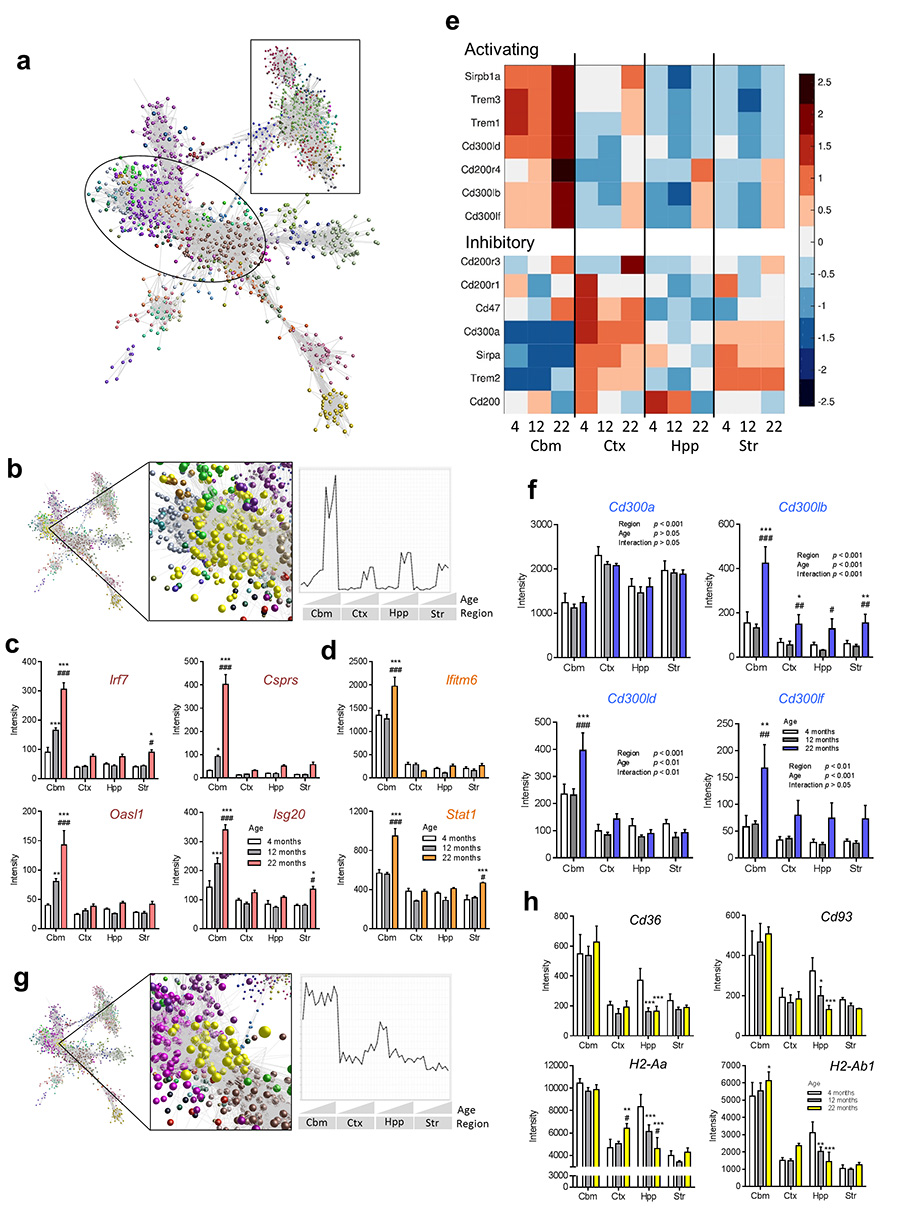
Microglia have critical roles in neural development, homeostasis and neuroinflammation and are increasingly implicated in age-related neurological dysfunction. Neurodegeneration often occurs in disease-specific, spatially restricted patterns, the origins of which are unknown. We performed to our knowledge the first genome-wide analysis of microglia from discrete brain regions across the adult lifespan of the mouse, and found that microglia have distinct region-dependent transcriptional identities and age in a regionally variable manner. In the young adult brain, differences in bioenergetic and immunoregulatory pathways were the major sources of heterogeneity and suggested that cerebellar and hippocampal microglia exist in a more immune-vigilant state. Immune function correlated with regional transcriptional patterns. Augmentation of the distinct cerebellar immunophenotype and a contrasting loss in distinction of the hippocampal phenotype among forebrain regions were key features during aging. Microglial diversity may enable regionally localized homeostatic functions but could also underlie region-specific sensitivities to microglial dysregulation and involvement in age-related neurodegeneration.


Figures

Figure 1
Figure 1
Validation of multi-region microglial purification. (a) Microglia were purified from discrete brain regions and the profile of expression for indicated surface markers examined by flow cytometry. A consistent CD11b+F4/80+CD45lo profile was observed for all regions (Con denotes isotype control staining of whole brain microglia). Data are representative of four independent cell preparations, each from tissue pooled from eight mice. (b) Microarray expression profiles for selected genes in purified microglia and mixed brain cell homogenates from each brain region. Data show mean ± SD, n = 4 independent samples, each from tissue pooled from eight mice (c) The fold change (log2) in microarray expression level for purified microglia versus mixed cell brain homogenates for indicated genes. (d) Microarray expression profiles in purified microglia from discrete brain regions for established marker genes of neurons, astrocytes and oligodendrocytes, (e) T cells (Cd3e), B cells (Cd19), granulocytes (Ly6g), and (f) non-CNS macrophages with comparison to Itgam. Data show mean ± SD, n = 4 independent samples, each from tissue pooled from eight mice. (g) Immunofluorescence images of purified microglia cultured for 7d and immunostained for indicated markers. Images are representative of two independent cultures. Scale bar, 50μm. Str, striatum; Hpp, hippocampus; Ctx, cerebral cortex; Cbm, cerebellum.
Figure 2
Figure 2
The adult mouse microglial transcriptome is regionally heterogeneous. (a) Principal components analysis on microarray expression profiles for purified microglia from discrete brain regions. (b) Sample-to-sample correlation of microarray datasets was performed in BioLayout Express3D and a network graph generated (Pearson correlation threshold r ≥ 0.96). Nodes represent individual samples and edges the degree of correlation between them. (c) Heat map showing the expression pattern of probesets differentially expressed by brain region (p < 0.05 with FDR correction). The scaled expression value (row Z-score) is displayed in a blue-red colour scheme with red indicating high expression and blue low expression. (d) Differentially expressed probesets were analysed for enrichment of Gene Ontology (GO) Biological Processes in DAVID. Enriched GO terms were imported to Enrichment Map and a network graph generated. Nodes represent individual GO terms (gene sets) and edges the relatedness between them. Two major clusters defined by immunoregulatory and metabolic function were identified. Str, striatum; Hpp, hippocampus; Ctx, cerebral cortex; Cbm, cerebellum.
Figure 3
Figure 3
Three major patterns of gene co-expression underpin regional microglial transcriptional heterogeneity. (a) A transcript-to-transcript correlation network graph of transcripts significantly differentially expressed by brain region was generated in BioLayout Express3D (Pearson correlation threshold r ≥ 0.80). Nodes represent transcripts (probesets) and edges the degree of correlation in expression pattern between them. The network graph was clustered using a Markov clustering algorithm and transcripts assigned a colour according to cluster membership. Three major clusters were identified. (b) Mean expression profile of all transcripts within clusters 1, 2 and 3. (c) Heat maps showing the expression profile of all transcripts contained within clusters 1, 2 and 3. Each probeset is represented in a blue-red row Z-score scale with red indicating high expression and blue low expression. Str, striatum; Hpp, hippocampus; Ctx, cerebral cortex; Cbm, cerebellum.
Figure 4
Figure 4
Regional transcriptional heterogeneity in microglial immunophenotype and bioenergetics. (a) Cluster 3 transcripts were analysed for enrichment of Gene Ontology (GO) Biological Processes in DAVID (p < 0.05 with Benjamini correction) and a network graph of enriched GO terms generated in Enrichment Map. Nodes represent individual GO terms (gene sets) and edges the relatedness between them. (b) Examples of individual genes in cluster 3 manually annotated to functional categories of immunoregulatory function. (c) mRNA expression of selected genes in purified microglia measured by quantitative PCR. Data show mean ± SD, n = 4 independent samples, each from tissue pooled from eight mice. *p < 0.05, **p < 0.01, ***p < 0.001, one-way ANOVA with Bonferroni correction. (d, e) Expression of MHC-II protein was measured by flow cytometry on freshly isolated adult microglia identified by CD11b+CD45lo profile in mixed brain cell suspensions from discrete brain regions. Data show (d) proportion of CD11b+CD45lo microglia positive for MHC-II and (e) mean fluorescence intensity of MHC-II expression on CD11b+CD45lo cells. Data show mean ± SD, n = 3 independent cell preparations. ***p < 0.001, one-way ANOVA with Bonferroni correction. (f) Cluster 2 transcripts were analysed for enrichment of GO Biological Processes (p < 0.05 with Benjamini correction) and a network graph of enriched GO terms generated in Enrichment Map. (g, h) Examples of individual genes in cluster 2 manually annotated to functional categories of bioenergetic function. Data show mean ± SD, n = 4 independent samples, each from tissue pooled from eight mice. *p < 0.05, **p < 0.01, ***p < 0.001, one-way ANOVA with Bonferroni correction. Str, striatum; Hpp, hippocampus; Ctx, cerebral cortex; Cbm, cerebellum. Specific p values for all statistical comparisons are presented in Supplementary Table 13.
Figure 5
Figure 5
Regional microglial heterogeneity in immunophenotype suggests differences in immune vigilance. (a) Microarray expression levels in purified microglia of selected families of immunoreceptors containing activating and inhibitory members. Data show mean ± SD, n = 4 independent samples, each from tissue pooled from eight mice. *p < 0.05, **p < 0.01, ***p < 0.001, one-way ANOVA with Bonferroni correction. (b,c) Heat maps showing microarray expression patterns of immunoreceptor genes arranged according to (b) family and (c) activating (A) or inhibitory (I) status. Column Z-score intensities represent the mean of four independent samples per region with red referring to a high probeset expression and blue low expression (d) Genes uniquely induced (>5-fold, p < 0.05 with FDR correction) by LPS or IL-4 in microglia were determined from publicly available microarray expression datasets. (e,f) Heat maps showing microarray expression patterns for the subsets of unique (e) LPS- or (f) IL-4-inducible genes that were differentially expressed (p < 0.05 with FDR correction) according to brain region. Row Z-score intensities represent the mean of four independent samples per region with red referring to a high probeset expression and blue low expression. (g) Microarray expression levels of archetypal marker genes of M1 (Nos2) and M2 (Arg1) activation with Itgam as comparison. Data show mean ± SD, n = 4 independent samples, each from tissue pooled from eight mice. (h) Region-dependent variation of cortical and cerebellar microglia in response to the stimulation with E.coli, Str, striatum; Hpp, hippocampus; Ctx, cerebral cortex; Cbm, cerebellum. (h) Purified microglia were incubated with Escherichia coli strain K-12 and net replication of bacteria within microglia computed from counts of bacterial colonies derived from microglial cell lysates at indicated timepoints. Data are representative of two independent cell preparations and show mean ± SEM, n = 3 replicate samples from one cell preparation. p < 0.05, two-way ANOVA with Bonferroni correction. Str, striatum; Hpp, hippocampus; Ctx, cerebral cortex; Cbm, cerebellum. Specific p values for all statistical comparisons are presented in Supplementary Table 13.
Figure 6
Figure 6
Regional microglial heterogeneity is comparable to inter-tissue macrophage diversity. (a) Principal components analysis of the present regional microglial expression datasets and systemic macrophage datasets shows the extent of regional microglial heterogeneity relative to macrophage tissue diversity. (b) The number of highly-enriched genes (>10-fold, p < 0.05 with FDR correction) in microglia compared to peritoneal macrophages was similar for microglia from each brain region. (c) Venn diagram showing regional overlap of the genes highly enriched in microglia versus peritoneal macrophages. (d) The fold-change (microglia versus peritoneal macrophages) in expression of selected genes recently identified as signature genes distinguishing microglia from systemic macrophages was comparable across brain regions. Str, striatum; Hpp, hippocampus; Ctx, cerebral cortex; Cbm, cerebellum.
Figure 7
Figure 7
Region-specific microglial ageing. (a) Transcripts within the 4 months old immunoregulatory and bioenergetics clusters (see Fig 3) were assessed for age-regulated differential expression and the proportion of age-stable and age-altered transcripts determined. (b) Principal components analysis plot of microarray expression profiles for purified microglia from discrete brain regions at 4, 12 and 22 months of age. (c) Sample-to-sample correlation network graph of microarray datasets was performed in BioLayout Express3D and clustered using a Markov clustering algorithm. Nodes represent individual samples and edges the degree of correlation between their expression patterns. Colours denote discrete clusters. (d) Comparison of the number of differentially expressed transcripts (p < 0.05 with FDR correction, fold change ≥ 1.5) between different ages for each brain region. (e) Comparison of the number of up-regulated and down-regulated transcripts (p < 0.05 with FDR correction, fold change ≥ 1.5) at 22 vs 12 months in each brain region. (f) Hierarchical clustering and heat map of top transcripts with significant age-region interaction (p < 0.05, two-way ANOVA with FDR correction). The scaled expression value (row Z-score) is displayed in a blue-red colour scheme with red indicating higher expression and lower expression in blue. Str, striatum; Hpp, hippocampus; Ctx, cerebral cortex; Cbm, cerebellum.
Figure 8
Figure 8
Biological pathways underlying region-specific microglial ageing. (a) Transcript-to-transcript correlation network graph of transcripts differentially expressed according to age (p < 0.05 with FDR correction) and clustered using a Markov clustering algorithm. Nodes represent individual transcripts and edges the degree of correlation in expression pattern between them. Colours denote discrete clusters. Circled region includes clusters with greater expression in cerebellum and/or increasing with age; square region includes clusters with greater expression in forebrain regions and/or declining expression with age. (b) Cluster position and mean expression profile of transcripts from cluster 2 indicating greater and/or earlier age-related changes. (c, d) Interferon pathway genes showing (c) earlier and/or (d) greater/selective increases in expression in cerebellar microglia compared to forebrain regions during ageing. Data show mean ± SD, n = 4 independent samples, each pooled from tissue from eight mice. *p < 0.05, **p < 0.01, ***p < 0.001 vs 4 month; #p < 0.05, ##p < 0.01, ###p < 0.001 vs 12 month, two-way ANOVA with Bonferroni correction. (e) Heat maps showing microarray expression patterns of selected immunoreceptor family genes during ageing arranged according to activating (A) or inhibitory (I) classification. Row Z-score intensities represent the mean of four independent samples per region and age with red indicating higher expression and lower expression in blue. (f) Expression patterns of Cd300 family genes show interaction between brain region and age for activating but not inhibitory members. Data show mean ± SD, n = 4 independent samples, each pooled from tissue from eight mice. *p < 0.05, **p < 0.01, ***p < 0.001 vs 4 month; #p < 0.05, ##p < 0.01, ###p < 0.001 vs 12 month, two-way ANOVA with Bonferroni correction. (g, h) Cluster position and mean expression profile of transcripts from cluster 14 indicating selective decline in expression during ageing in hippocampal microglia. (h) Expression profiles of selected genes from cluster 14. Data show mean ± SD, n = 4 independent samples, each pooled from tissue from eight mice. *p < 0.05, **p < 0.01, ***p < 0.001 vs 4 month; #p < 0.05, ##p < 0.01, ###p < 0.001 vs 12 month, two-way ANOVA with Bonferroni correction. Str, striatum; Hpp, hippocampus; Ctx, cerebral cortex; Cbm, cerebellum. Specific p values for all statistical comparisons are presented in Supplementary Table 13.

References

    1. Prinz M, Mildner A. Microglia in the CNS: immigrants from another world. Glia. 2011;59:177–187. - PubMed
    1. Prinz M, Priller J. Microglia and brain macrophages in the molecular age: from origin to neuropsychiatric disease. Nat Rev Neurosci. 2014;15:300–312. - PubMed
    1. Paolicelli RC, et al. Synaptic Pruning by Microglia Is Necessary for Normal Brain Development. Science (New York, N.Y. 2011;333:1456–1458. - PubMed
    1. Schafer Dorothy P., et al. Microglia Sculpt Postnatal Neural Circuits in an Activity and Complement-Dependent Manner. Neuron. 2012;74:691–705. - PMC - PubMed
    1. Coull JAM, et al. BDNF from microglia causes the shift in neuronal anion gradient underlying neuropathic pain. Nature. 2005;438:1017–1021. - PubMed

Publication types