. 2016 Mar;48(3):238-244.
doi: 10.1038/ng.3489. Epub 2016 Jan 18.

Identification of neutral tumor evolution across cancer types

Affiliations

Identification of neutral tumor evolution across cancer types

Marc J Williams et al. Nat Genet. 2016 Mar.

Abstract

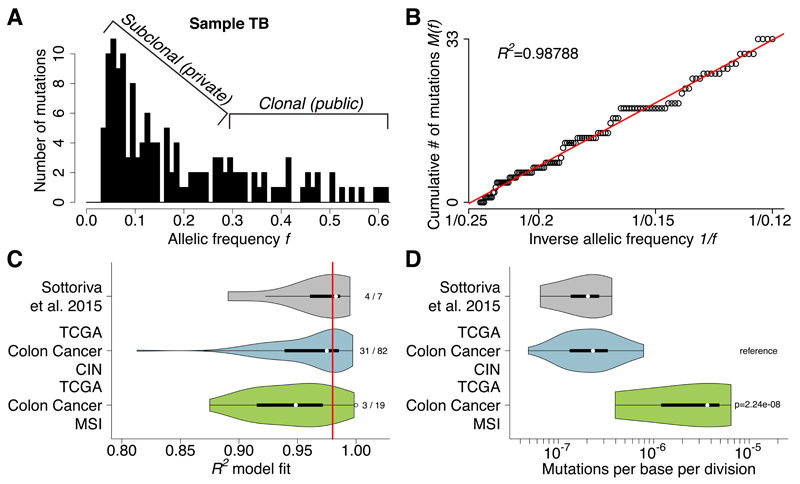
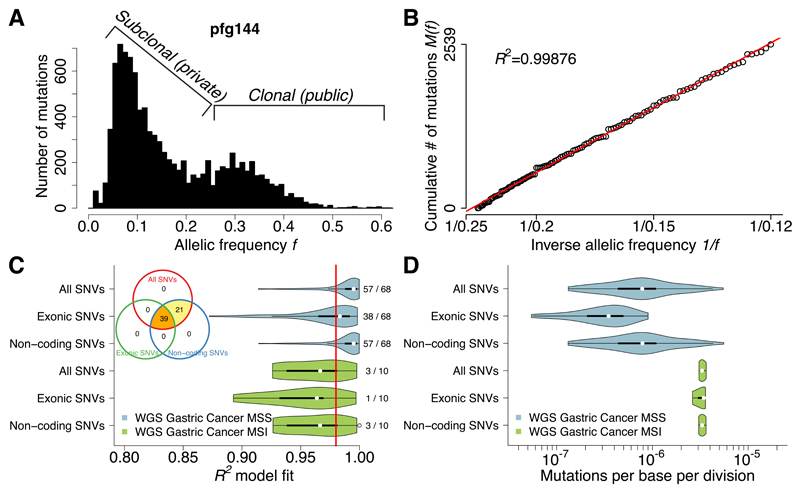
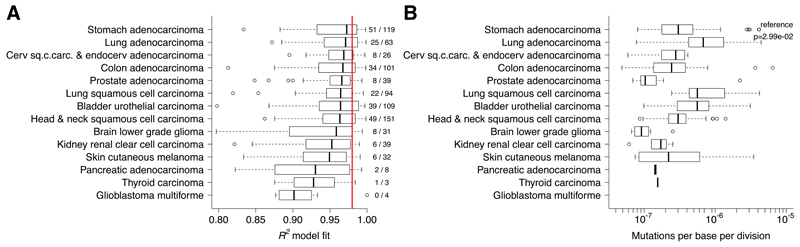
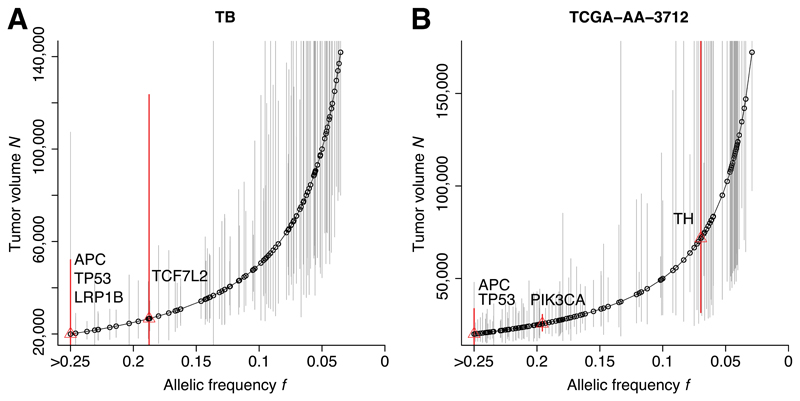
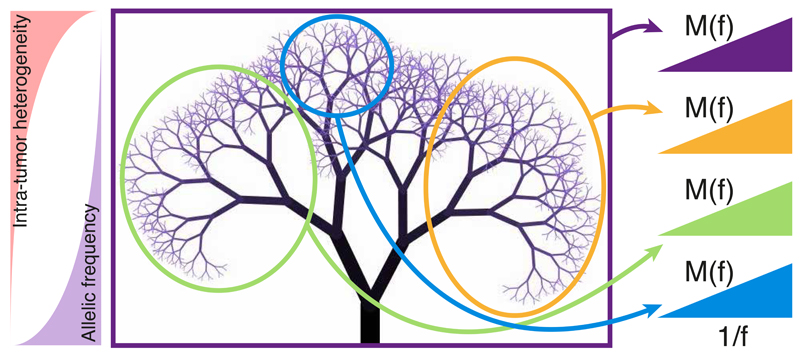
Despite extraordinary efforts to profile cancer genomes, interpreting the vast amount of genomic data in the light of cancer evolution remains challenging. Here we demonstrate that neutral tumor evolution results in a power-law distribution of the mutant allele frequencies reported by next-generation sequencing of tumor bulk samples. We find that the neutral power law fits with high precision 323 of 904 cancers from 14 types and from different cohorts. In malignancies identified as evolving neutrally, all clonal selection seemingly occurred before the onset of cancer growth and not in later-arising subclones, resulting in numerous passenger mutations that are responsible for intratumoral heterogeneity. Reanalyzing cancer sequencing data within the neutral framework allowed the measurement, in each patient, of both the in vivo mutation rate and the order and timing of mutations. This result provides a new way to interpret existing cancer genomic data and to discriminate between functional and non-functional intratumoral heterogeneity.


Figures

Figure 1
Figure 1. Neutral evolution is common in colon cancer and allows the measurement of mutation rates in each tumor.
(A) The output of NGS data, such as whole-exome sequencing, can be summarized as a histogram of mutant allele frequencies, here for sample TB. Considering purity and ploidy, mutations with relatively high frequency (>0.25) are likely to be clonal (public), whereas low frequency mutations capture the tumor subclonal architecture. (B) The same data can be represented as the cumulative distribution M(f) of subclonal mutations. This was found to be linear with 1/f, precisely as predicted by the neutral model. (C) R2 goodness of fit of our CRC cohort (n=7) and the TCGA colon cancer cohort (n=101) grouped by CIN versus MSI confirmed that neutral evolution is common (38/108, 35.1% with R2≥0.98). (D) Measurements of the mutation rate showed that the CIN groups had median mutation rate of µe=2.31×10⁻⁷, whereas MSI tumors reported a 15-fold higher rate (median: µe=3.65×10⁻⁶, F-test: p=2.24×10⁻⁸), as predicted due to their DNA mismatch repair deficiency.
Figure 2
Figure 2. Neutral evolution across the whole-genome of gastric cancers.
(A) Large number of coding and non-coding mutations can be identified using WGS. (B) All detected mutations precisely accumulate as 1/f following the neutral model in this example. (C) Neutral evolution is very common in gastric cancer, with 60/78 (76.9%) samples showing goodness of fit of the neutral model R2≥0.98. This was consistent using all, exonic or non-coding subclonal mutations. The same tumors were identified as neutral by all three methods, although limitations in detecting neutrality were present when considering exonic mutations due to the limited number of variants. (D) Mutation rates were more than 4 times higher in MSI (µe=3.30×10⁻⁶) versus MSS (µe=7.82×10⁻⁷; F-test: p=1.35×10⁻⁴) cancers, consistently with the underlying biology.
Figure 3
Figure 3. Neutral evolution and mutation rates across cancer types.
(A) R2 values from 819 cancers of 14 different types supported neutral evolution in a large proportion of cases (259/819, 31.6% of R2≥0.98) and across different cancer types, particularly in stomach (validating the WGS analysis), lung, bladder, cervical and colon. On the contrary, renal, melanoma, pancreatic, thyroid, and glioblastoma were characterized by non-neutral evolution. The other types displayed a mixed dynamics. (B) The highest mutation rates were found in lung cancer. Lower rates were found in thyroid, low grade glioma and prostate.
Figure 4
Figure 4. Reconstruction of the mutational timeline in each patient.
The allelic frequency of a mutation within the tumor predicts the size of the tumor when the mutation occurred. (A,B) The deconvolution of the mutational timeline is illustrated for samples TB and TCGA-AA-3712 respectively. Whereas established CRC drivers (APC, KRAS, TP53) were found to be present from the first malignant cell, several recurrent putative drivers not yet validated were mutated after malignant seeding, despite the underlying neutral dynamics. This suggests that some of these candidate alterations may not be fundamental drivers of growth in all cases. Confidence intervals are calculated using a binomial test on the number of variant reads versus the depth of coverage for each mutation.
Figure 5
Figure 5. Neutral evolution and tumor phylogeny.
After the accumulation of key genomic alterations, in neutral malignancies the cancer expansion is likely triggered by a single critical genomic event (the accumulation of a “full house” of genomic changes) followed by neutral evolution that generates a large number of new mutations in ever-smaller subclones. While the tumor heterogeneity rapidly increases, the allele frequency of heterogeneous mutations decreases. In this context, the accumulation of mutations M(f) follows a characteristic 1/f distribution. Moreover, the tumor phylogeny displays a characteristic fractal topology that is self-similar. Sampling in different regions of the phylogenetic tree exposes distinct mutations that however show the same 1/f distribution. Clonal mutations in a sample (not considered in the model) arose in to the most recent common ancestor of the sampled cells. Due to the large population of cells sampled using bulk sequencing, the majority of detected clonal mutations belongs to the trunk of the tree and therefore is found in the first cancer cell. Deviations from the 1/f law indicate different dynamics from neutral growth.

Comment in

References

    1. Greaves M, Maley CC. Clonal evolution in cancer. Nature. 2012;481:306–313. - PMC - PubMed
    1. Basanta D, Anderson ARA. Exploiting ecological principles to better understand cancer progression and treatment. Interface Focus. 2013;3:20130020. - PMC - PubMed
    1. Vogelstein B, et al. Cancer genome landscapes. Science. 2013;339:1546–1558. - PMC - PubMed
    1. Burrell RA, McGranahan N, Bartek J, Swanton C. The causes and consequences of genetic heterogeneity in cancer evolution. Nature. 2013;501:338–345. - PubMed
    1. Marusyk A, Almendro V, Polyak K. Intra-tumour heterogeneity: a looking glass for cancer? Nat Rev Cancer. 2012;12:323–334. - PubMed

Publication types