. 2016 Jan 19:5:e10509.
doi: 10.7554/eLife.10509.

The cerebellum linearly encodes whisker position during voluntary movement

Affiliations

The cerebellum linearly encodes whisker position during voluntary movement

Susu Chen et al. Elife. .

Abstract

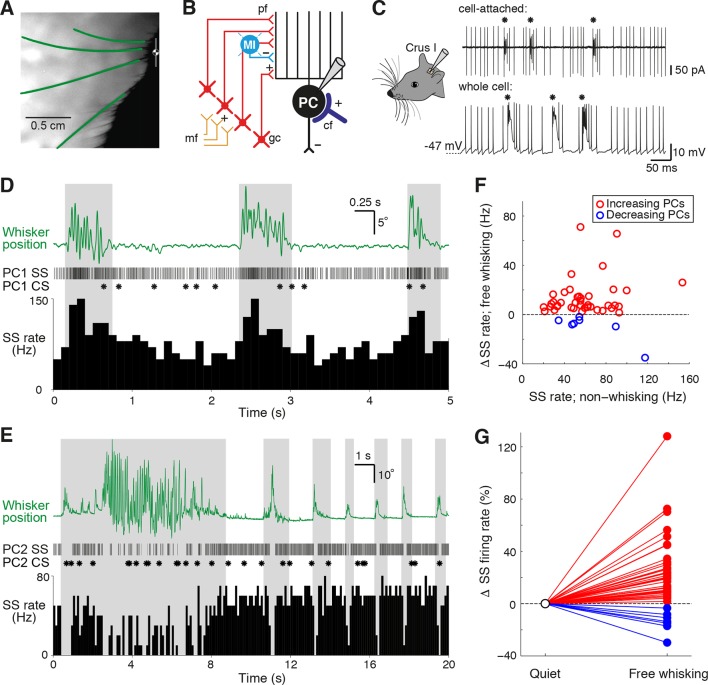
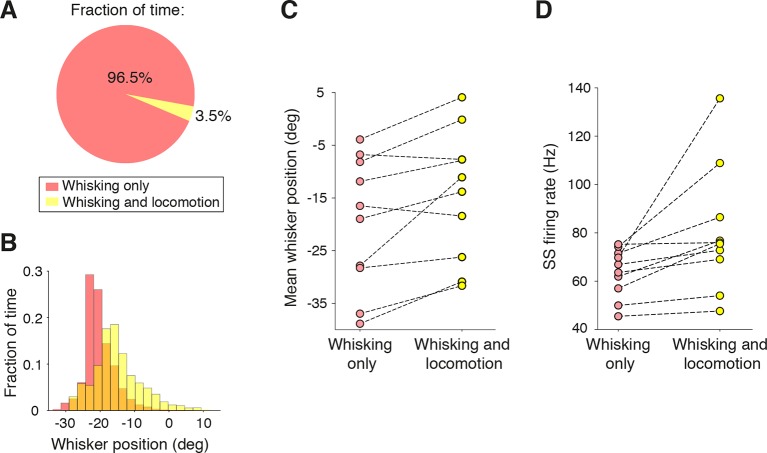
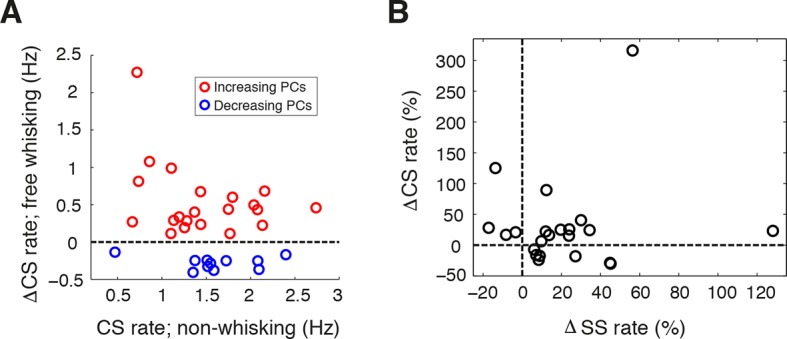
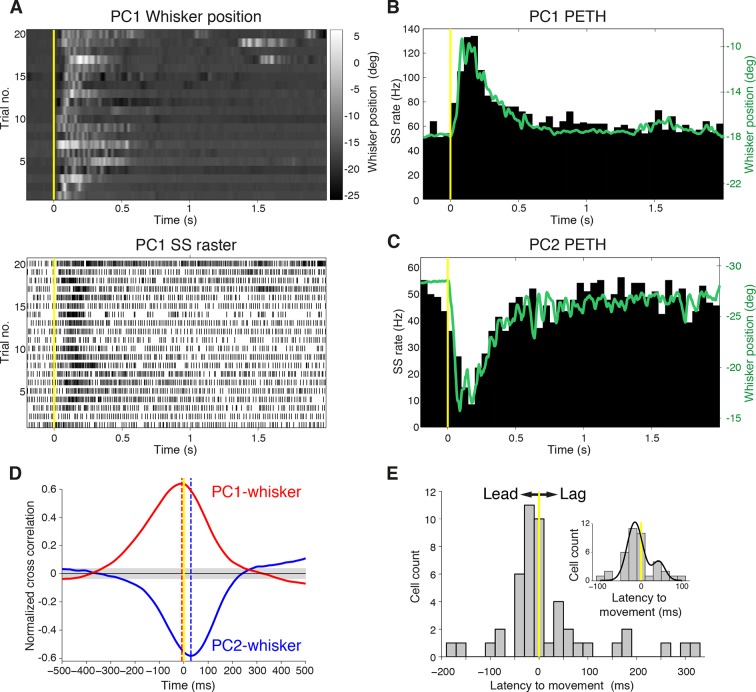
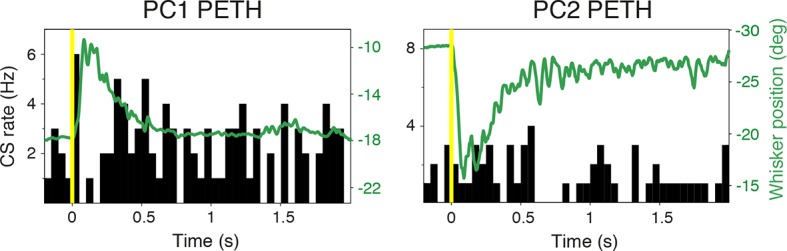
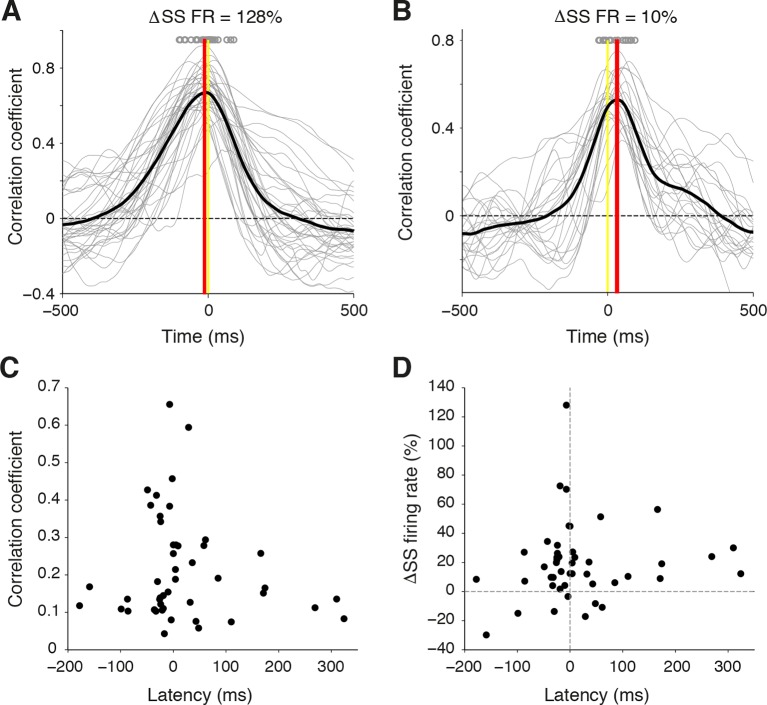
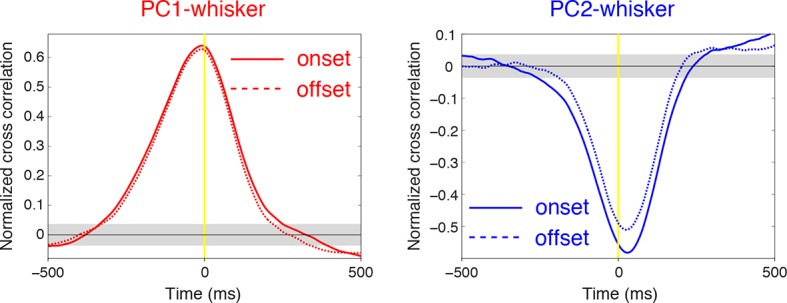
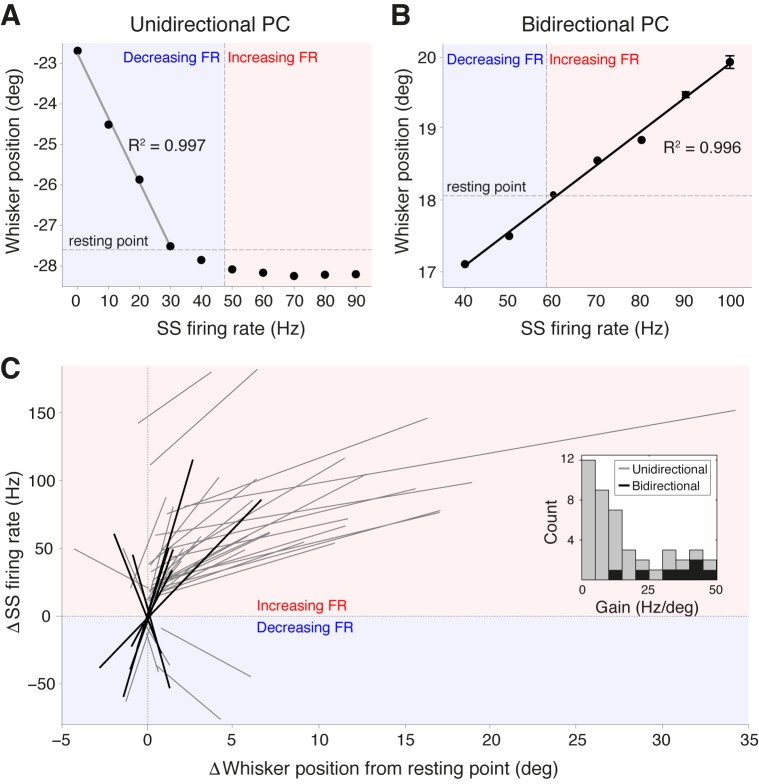
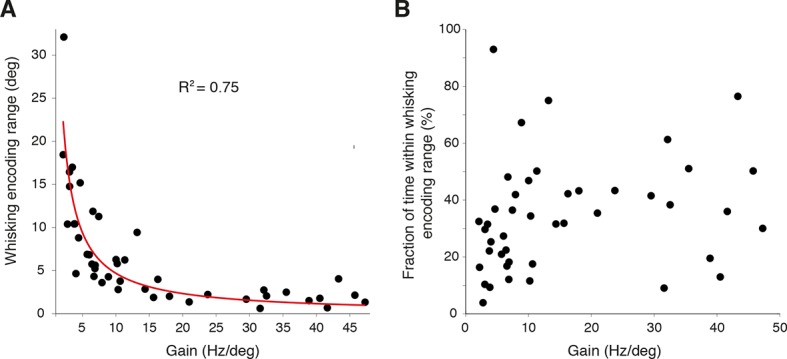
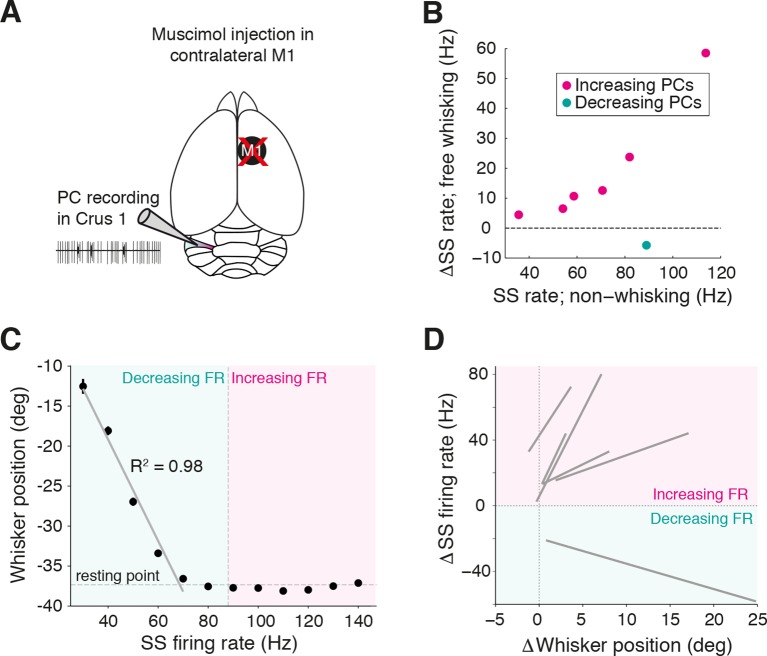
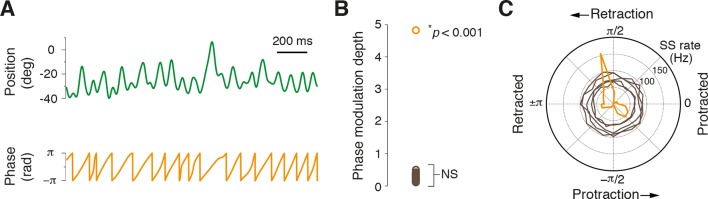
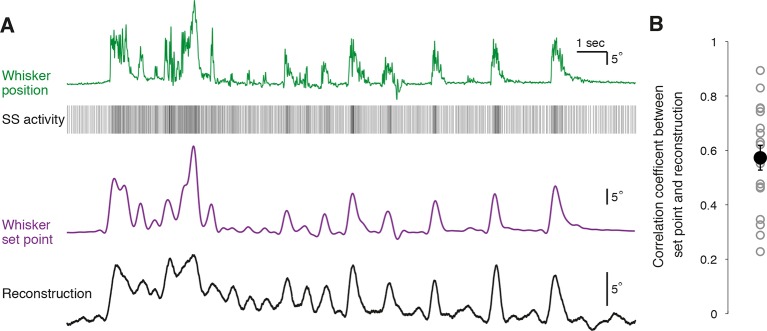
Active whisking is an important model sensorimotor behavior, but the function of the cerebellum in the rodent whisker system is unknown. We have made patch clamp recordings from Purkinje cells in vivo to identify whether cerebellar output encodes kinematic features of whisking including the phase and set point. We show that Purkinje cell spiking activity changes strongly during whisking bouts. On average, the changes in simple spike rate coincide with or slightly precede movement, indicating that the synaptic drive responsible for these changes is predominantly of efferent (motor) rather than re-afferent (sensory) origin. Remarkably, on-going changes in simple spike rate provide an accurate linear read-out of whisker set point. Thus, despite receiving several hundred thousand discrete synaptic inputs across a non-linear dendritic tree, Purkinje cells integrate parallel fiber input to generate precise information about whisking kinematics through linear changes in firing rate.

Keywords: Crus I; Purkinje cell; mouse; neuroscience; simple spike; vibrissa.


Conflict of interest statement

The authors declare that no competing interests exist.

Figures

Figure 1.
Figure 1.. Alteration of Purkinje cell activity during free whisking.
(A) Videography of a head-restrained mouse with four traced whiskers (from row C, labeled in green). (B) Simplified diagram of the cerebellar circuit (cf: climbing fiber; gc: granule cell; PC: Purkinje cell; pf: parallel fiber; mf: mossy fiber; MI: molecular layer interneuron). (C) PC electrical activity in awake behaving mice, acquired via cell-attached and whole cell patch clamp recordings. Asterisks highlight the incidence of complex spiking. (D) Observed behavior of PC that increased simple spike (SS) frequency during spontaneous whisker movements (gray shading), including (top) traced whisker position (green; upward deflections indicate protraction), (middle) corresponding SS and CS trains, and (bottom) SS instantaneous firing rate histogram (bin size: 100 ms). (E) Observed behavior of PC that decreased SS frequency during spontaneous whisking. (F) Scatter plot showing relative SS firing rate changes during whisking with respect to non-whisking baseline firing rates for all significantly modulated units (p<0.05, n = 47, Mann-Whitney-Wilcoxon test). Red and blue symbols indicate increasing (n = 40) and decreasing (n = 7) PCs, respectively. (G) Relative SS firing rate changes with respect to baseline firing rate between quiet wakefulness and free whisking for all modulated cells (red: increasing PCs, blue: decreasing PCs). DOI: http://dx.doi.org/10.7554/eLife.10509.003
Figure 1—figure supplement 1.
Figure 1—figure supplement 1.. Influence of locomotion on simple spike rate alteration during free whisking.
(A) The fraction of time from all recordings (n = 47) that mice were engaged in locomotion during whisking was very small. (B) Distribution of whisker positions during a single recording session within epochs of whisking alone (pink), and whisking and locomotion (yellow). Locomotion was associated with a protraction of whisker position. (C) Mean whisker position during whisking alone, and during whisking plus locomotion for all recordings in which mice ran (n = 10, see Materials and methods). On average, locomotion was associated with a protraction of 5.5 ± 1.7 degrees. (D) SS firing rates during whisking alone and with locomotion. Running was associated with a significant elevation (p = 0.03) in SS rate across the population. DOI: http://dx.doi.org/10.7554/eLife.10509.004
Figure 1—figure supplement 2.
Figure 1—figure supplement 2.. Complex spike rate alteration during free whisking.
(A) Relative CS firing rate changes during whisking with respect to non-whisking CS rates for all significantly modulated units (n = 33, Mann-Whitney-Wilcoxon test, p<0.05). Red and blue symbols depict PCs with increasing (n = 22) and decreasing (n = 11) firing rates respectively. (B) Scatter plot of relative changes in CS- versus SS rate with respect to baseline firing rate for PCs that displayed significant modulation in both CS and SS during whisking (n = 22). No correlation was observed between directions of CS and SS modulation for individual PCs. DOI: http://dx.doi.org/10.7554/eLife.10509.005
Figure 2.
Figure 2.. Purkinje cell simple spike discharges reliably track whisker movements.
(A) Whisker movements and corresponding simple spike raster from a single PC across 20 epochs of free whisking. Neuron demonstrates increased SS frequency during movement. (B) Peri-event time histogram (PETH) for the same PC, obtained by averaging SS rate across trials illustrated in (A), overlaid with averaged whisker position (in green). Note the close relationship between SS firing rate change and mean whisker position. (C) PETH for a PC demonstrating reduced SS frequency during movement. The close relationship between SS firing rate change and mean whisker position is preserved. (D) Normalized cross-correlations between whisker position and SS discharge for exemplar PCs. The peak (red for PC1; shown in A, B) or trough (blue for PC2; shown in C) indicates the temporal relationship between whisker position and spiking. PC1 leads whisker movement by 8 ms (difference between red and yellow dashed lines), while PC2 lags movement by 27 ms (difference between blue and yellow dashed lines). Gray shade demonstrates 95% confidence interval. (E) Temporal relationship between whisker movement and SS discharge for all modulated PCs (bin size: 20 ms). More units show lead (negative latency to movement) than lag (positive latency to movement) with respect to behavior. Inset: zoomed-in histogram between -100 ms and 100 ms. Black line is best fit of two summed Gaussians. DOI: http://dx.doi.org/10.7554/eLife.10509.008
Figure 2—figure supplement 1.
Figure 2—figure supplement 1.. Complex spike relationship to whisker movement.
CS peri-event time histograms (PETHs) overlaid with average whisker positions for the same cells shown in Figure 2. Note the absence of the close relationships between CS firing rate change and whisker movement, in contrast to SS rate. DOI: http://dx.doi.org/10.7554/eLife.10509.009
Figure 2—figure supplement 2.
Figure 2—figure supplement 2.. Temporal relationship between whisker movement and SS firing rate for strongly and weakly modulated PCs.
(A) Cross-correlation between whisker position and SS discharge for individual whisking bouts (gray lines) of a strongly modulated PC. Gray circles: time of peak correlation for individual bouts. Black line: average cross-correlation for all bouts. Red line: time of average peak correlation (-12 ± 5 ms). (B) Cross-correlation between whisker position and SS discharge for individual whisking bouts (gray lines) of a weakly modulated PC. Gray circles: time of peak correlation for individual bouts. Black line: average cross-correlation for all bouts. Red line: time of average peak correlation (26 ± 7 ms). (C) Relationship between correlation strength and latency for all PCs. (D) Relationship between SS modulation strength and latency for all PCs. DOI: http://dx.doi.org/10.7554/eLife.10509.010
Figure 2—figure supplement 3.
Figure 2—figure supplement 3.. Relationship between SS firing rate and whisking offset.
Normalized cross-correlations measured at whisking onset (solid lines) and offset (dashed lines) for example PCs shown in Figure 2. The temporal relationship between whisking and SS modulation is preserved at movement offset. Gray shade demonstrates 95% confidence interval. DOI: http://dx.doi.org/10.7554/eLife.10509.011
Figure 3.
Figure 3.. Purkinje cell simple spike frequency linearly encodes whisker position.
(A) Relationship between SS rate and whisker position for PC with strong linear tuning in the forward direction only (unidirectional PC). Linear regression was performed for whisker positions anterior of the resting point (horizontal dashed line). Vertical dashed line shows the cell’s spontaneous firing rate (FR). This cell showed linear reductions in SS frequency during forward movement. Blue and red shaded areas represent decreases and increases in SS FR, respectively. (B) Relationship between SS rate and whisker position for PC with strong linear tuning in both forward and backward directions (bidirectional PC). Linear fit encompassed the entire range of SS FR modulation. This cell showed increases in SS frequency during forward movement, and decreases in SS frequency during backward movement. (C) Summary of all unidirectional PCs (n = 37, gray lines) and bidirectional PCs (n= 7, black lines) with significant linear correlations between SS FR and whisker position (ANOVA, p<0.05, R2 > 0.86). FR change and whisker position were normalized with respect to spontaneous firing rate and resting point, respectively. Inset: distribution of gain, defined as the slope of individual linear fit, for both unidirectional (gray) and bidirectional (black) units. Note bidirectional PCs have higher gain values than unidirectional PCs on average, implying they are more sensitive to changes in whisker position during movement. DOI: http://dx.doi.org/10.7554/eLife.10509.012
Figure 3—figure supplement 1.
Figure 3—figure supplement 1.. Linear encoding range of individual PCs.
(A) Relationship between whisker encoding range and PC gain. A strong inverse relationship was observed between linear encoding range and gain of SS modulation, indicating that high gain neurons encode a relatively smaller range of whisker position than low gain neurons. (B) Fraction of time spent within linear encoding range with respect to individual PC gain. The fraction of time that a whisker spent within the linear encoding range of an individual PC was independent of gain. DOI: http://dx.doi.org/10.7554/eLife.10509.013
Figure 3—figure supplement 2.
Figure 3—figure supplement 2.. Inactivation of contralateral motor cortex does not degrade cerebellar representation of whisker position.
(A) PC recordings in Crus I were performed during transient inactivation of contralateral motor cortex (M1; via local muscimol injection, see ‘Materials and methods’). (B) Relative SS firing rate changes during whisking with respect to non-whisking baseline firing rates for significantly modulated units (n = 7/15, Mann-Whitney-Wilcoxon test, p<0.05). Pink and teal symbols depict increasing (n = 6) and decreasing (n = 1) PCs, respectively. (C) Relationship between SS rate and whisker position for PC with strong linear tuning in the forward direction. Vertical dashed line shows the cell’s spontaneous firing rate (FR). This cell showed linear reductions in SS frequency during forward movement. (D) Summary of all PCs (n = 6, gray lines) with significant linear correlations between SS FR and whisker position. FR change and whisker position were normalized with respect to spontaneous firing rate and resting point, respectively. DOI: http://dx.doi.org/10.7554/eLife.10509.014
Figure 4.
Figure 4.. Most Purkinje cells do not encode the phase of whisking cycle.
(A) Example of rhythmic whisker movement (green trace), and corresponding phase (orange) derived from the Hilbert transform of the raw position trace. (B) Modulation depth of phase tuning for population of PCs. Phase tuning is absent in SS patterns of all but one PC (NS; not significant, n = 30/31). (C) Polar plot depicts the phase tuning of five representative cells that did not demonstrate phase tuning (brown) and one strongly modulated PC (orange), which showed SS firing locked to mid-point of whisker retraction. DOI: http://dx.doi.org/10.7554/eLife.10509.015
Figure 5.
Figure 5.. Reconstruction of set point trajectories from simple spike activity of single Purkinje cells.
(A) Reconstruction of whisker movement from single PC SS train based on the calculated transfer function. Whisker set point information (purple) is accurately reconstructed (black trace, bottom) using SS activity from a single PC (down-sampled x3 for visual clarity), highlighting the strong linear relationship between simple spiking and slow whisker kinematics. Correlation coefficient value between reconstruction and set point is 0.78. (B) Correlation coefficients between whisker set point and linear reconstruction from individual PCs (gray open circles). Black filled circle: mean ± SEM across all cells (n = 18). DOI: http://dx.doi.org/10.7554/eLife.10509.016

References

    1. Albus JS. A theory of cerebellar function. Mathematical Biosciences. 1971;10:25–61. doi: 10.1016/0025-5564(71)90051-4. - DOI
    1. Badura A, Schonewille M, Voges K, Galliano E, Renier N, Gao Z, Witter L, Hoebeek FE, Chédotal A, De Zeeuw CI. Climbing fiber input shapes reciprocity of Purkinje cell firing. Neuron. 2013;78:700–713. doi: 10.1016/j.neuron.2013.03.018. - DOI - PubMed
    1. Barmack NH, Yakhnitsa V. Cerebellar climbing fibers modulate simple spikes in Purkinje cells. Journal of Neuroscience. 2003;23:7904–7916. - PMC - PubMed
    1. Berg RW, Kleinfeld D. Rhythmic whisking by rat: retraction as well as protraction of the vibrissae is under active muscular control. Journal of Neurophysiology. 2003;89:104–117. doi: 10.1152/jn.00600.2002. - DOI - PubMed
    1. Bosman LWJ, Houweling AR, Owens CB, Tanke N, Shevchouk OT, Rahmati N, Teunissen WHT, Ju C, Gong W, Koekkoek SKE, De Zeeuw CI. Anatomical pathways involved in generating and sensing rhythmic whisker movements. Frontiers in Integrative Neuroscience. 2011;5 doi: 10.3389/fnint.2011.00053. - DOI - PMC - PubMed

Publication types